Modeling extremal dependence in multivariate and spatial problems: a practical perspective
Pith reviewed 2026-05-23 07:15 UTC · model grok-4.3
The pith
The ExtremalDep R package supplies instructions for analyzing multivariate and spatial extreme events after minimal background.
A machine-rendered reading of the paper's core claim, the machinery that carries it, and where it could break.
Core claim
After a minimal background on the statistical methodologies, the ExtremalDep R package supplies a toolbox that lets users analyse multivariate and spatial extreme events, with the instructions and code validated through several real-world applications.
What carries the argument
The ExtremalDep R package toolbox for fitting models of extremal dependence in multivariate and spatial settings.
If this is right
- Users can extrapolate risks beyond observed data while accounting for dependence among multiple variables.
- Spatial extreme events can be modelled and assessed with the same package functions.
- Professionals in environmental sciences and finance can perform the analyses by following the supplied instructions.
- The package reduces the expertise barrier for routine risk assessments that involve extremes.
Where Pith is reading between the lines
- The same instructional style could be applied to other R packages that implement specialised statistical models.
- The examples could be extended to include simulation-based validation of the fitted models.
- Users might combine the package output with existing spatial mapping tools to visualise results more directly.
- Future package updates could add support for newer dependence measures not covered in the current applications.
Load-bearing premise
The real-world applications shown in the paper correctly implement and validate the multivariate and spatial extreme value methods without hidden data-selection choices that affect the reported fits.
What would settle it
Re-running the package on the paper's example datasets produces fits that materially differ from those reported or fail standard checks for extremal dependence.
Figures


read the original abstract
From environmental sciences to finance, there is a growing demand for methods that can assess the risks of extreme events beyond those observed in available data. Extrapolating extreme events beyond the range of the data is not obvious. Risk assessments are often further complicated by the need to account for multiple variables simultaneously. Extreme value theory provides important tools for the analysis of multivariate or spatial extreme events, but these are not easily accessible to professionals without appropriate expertise. This article provides a minimal background on multivariate and spatial extremes and gives simple yet thorough instructions on how to analyse them using the R package ExtremalDep. After briefly introducing the statistical methodologies, we focus on road testing the package's toolbox through several real-world applications.
Editorial analysis
A structured set of objections, weighed in public.
Referee Report
Summary. The paper supplies a concise introduction to multivariate and spatial extreme-value methods and demonstrates their implementation through the ExtremalDep R package on several real-data examples drawn from environmental and financial contexts.
Significance. If the reported applications correctly implement the methods and fully document modeling choices, the work provides accessible, reproducible guidance that can increase uptake of extremal-dependence tools among practitioners; the package itself constitutes a concrete deliverable.
major comments (2)
- [Applications / real-world examples] Applications section (real-world examples): the manuscript does not report the precise threshold-selection procedure or block-maxima definitions used for each dataset, nor does it include sensitivity checks on these choices; because extremal-dependence parameter estimates are known to be sensitive to such decisions, the claim that the package supplies 'thorough instructions' cannot be independently verified from the presented results.
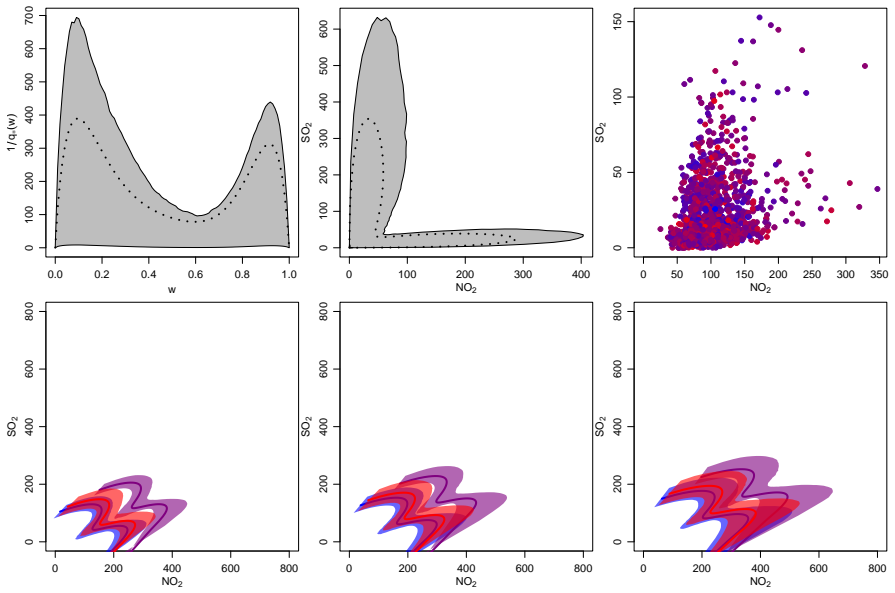
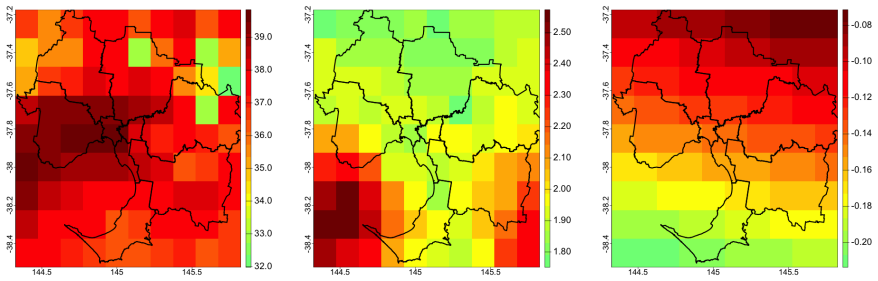
- [Spatial modeling subsection] Section on spatial max-stable models: the paper does not state whether the reported parameter estimates include standard errors obtained from the full likelihood or from a composite-likelihood approximation, nor whether the spatial dependence range was estimated jointly or fixed a priori; this information is required to assess the reliability of the fitted surfaces shown in the figures.
minor comments (2)
- [Multivariate methods] Notation for the logistic model parameters is introduced without an explicit link to the corresponding function arguments in the ExtremalDep package; adding a short table mapping symbols to function names would improve usability.
- [Figures] Figure captions for the spatial dependence plots omit the coordinate system and the units of the distance axis; this makes it difficult to interpret the range of dependence.
Simulated Author's Rebuttal
We thank the referee for the constructive comments. We address each major point below and indicate planned revisions to improve reproducibility.
read point-by-point responses
-
Referee: Applications section (real-world examples): the manuscript does not report the precise threshold-selection procedure or block-maxima definitions used for each dataset, nor does it include sensitivity checks on these choices; because extremal-dependence parameter estimates are known to be sensitive to such decisions, the claim that the package supplies 'thorough instructions' cannot be independently verified from the presented results.
Authors: We agree that explicit documentation of threshold selection and block-maxima definitions is required for independent verification. The revised manuscript will add these details for each dataset together with sensitivity checks on the key modeling choices. revision: yes
-
Referee: Section on spatial max-stable models: the paper does not state whether the reported parameter estimates include standard errors obtained from the full likelihood or from a composite-likelihood approximation, nor whether the spatial dependence range was estimated jointly or fixed a priori; this information is required to assess the reliability of the fitted surfaces shown in the figures.
Authors: We acknowledge the omission. The revision will specify the likelihood method used for standard errors and clarify whether the spatial range was estimated jointly or held fixed. revision: yes
Circularity Check
Expository paper; no derivations or predictions present
full rationale
The manuscript is instructional: it supplies background on multivariate/spatial extremes and demonstrates the ExtremalDep R package via applications. No equations, fitted parameters, uniqueness theorems, or predictions are introduced that could reduce to self-defined inputs or self-citations. All content is external to any internal derivation chain.
Axiom & Free-Parameter Ledger
Lean theorems connected to this paper
-
IndisputableMonolith/Foundation/RealityFromDistinction.leanreality_from_one_distinction unclear?
unclearRelation between the paper passage and the cited Recognition theorem.
This article provides a minimal background on multivariate and spatial extremes and gives simple yet thorough instructions on how to analyse them using the R package ExtremalDep.
What do these tags mean?
- matches
- The paper's claim is directly supported by a theorem in the formal canon.
- supports
- The theorem supports part of the paper's argument, but the paper may add assumptions or extra steps.
- extends
- The paper goes beyond the formal theorem; the theorem is a base layer rather than the whole result.
- uses
- The paper appears to rely on the theorem as machinery.
- contradicts
- The paper's claim conflicts with a theorem or certificate in the canon.
- unclear
- Pith found a possible connection, but the passage is too broad, indirect, or ambiguous to say the theorem truly supports the claim.
Reference graph
Works this paper leans on
-
[1]
Beirlant, J., Y. Goegebeur, J. Segers, and J. L. Teugels (2004). Statistics of extremes: theory and applications . John Wiley & Sons
work page 2004
-
[2]
Belzile, L. R., C. Dutang, P. J. Northrop, and T. Opitz (2023). A modeler's guide to extreme value software. Extremes\/ 26\/ (4), 595--638
work page 2023
-
[3]
Belzile, L. R., S. D. Grimshaw, R. Huser, P. J. Northrop, and J. L. Wadsworth (2022). mev: Modelling of Extreme Values . R package version 1.17
work page 2022
-
[4]
Beranger, B. and S. A. Padoan (2015). Extreme dependence models. In Extreme Value Modeling and Risk Analysis , pp.\ 325--352. Chapman and Hall/CRC
work page 2015
-
[5]
Beranger, B., S. A. Padoan, and G. Marcon (2025). ExtremalDep: Extremal Dependence Models . R package version 1.0.0
work page 2025
-
[6]
Beranger, B., S. A. Padoan, and S. A. Sisson (2017). Models for extremal dependence derived from skew-symmetric families. Scandinavian Journal of Statistics\/ 44\/ (1), 21--45
work page 2017
-
[7]
Beranger, B., S. A. Padoan, and S. A. Sisson (2021). Estimation and uncertainty quantification for extreme quantile regions. Extremes\/ 24\/ (2), 349--375
work page 2021
-
[8]
Beranger, B., A. G. Stephenson, and S. A. Sisson (2021). High-dimensional inference using the extremal skew-t process. Extremes\/ 24\/ (3), 653--685
work page 2021
- [9]
-
[10]
Brown, B. M. and S. I. Resnick (1977). Extreme values of independent stochastic processes. J. Appl. Probability\/ 14\/ (4), 732--739
work page 1977
-
[11]
Cai, J.-J., J. H. Einmahl, and L. De Haan (2011). Estimation of extreme risk regions under multivariate regular variation. The Annals of Statistics\/ 39\/ (3), 1803--1826
work page 2011
-
[12]
Coles, S. (2001). An introduction to statistical modeling of extreme values . Springer
work page 2001
-
[13]
Coles, S. G. and J. A. Tawn (1991). Modelling extreme multivariate events. Journal of the Royal Statistical Society: Series B (Methodological)\/ 53\/ (2), 377--392
work page 1991
-
[14]
Cooley, D., R. A. Davis, and P. Naveau (2010). The pairwise beta distribution: a flexible parametric multivariate model for extremes. J. Multivariate Anal.\/ 101\/ (9), 2103--2117
work page 2010
-
[15]
Cormier, E., C. Genest, and J. G. Ne s lehov \'a (2014). Using b-splines for nonparametric inference on bivariate extreme-value copulas. Extremes\/ 17\/ (4), 633--659
work page 2014
-
[16]
Davis, R. A., T. Mikosch, and I. Cribben (2011). Estimating extremal dependence in univariate and multivariate time series via the extremogram. https://arxiv.org/abs/1107.5592\/
work page internal anchor Pith review Pith/arXiv arXiv 2011
-
[17]
Davison, A. C., S. A. Padoan, and M. Ribatet (2012). Statistical modeling of spatial extremes, with discussion. Statistical Science\/ 27\/ (2), 161–186
work page 2012
-
[18]
de Fondeville, R. and L. R. Belzile (2021). mvPot: Multivariate peaks-over-threshold modelling for spatial extreme events . R package version 0.1.5
work page 2021
-
[19]
de Fondeville, R. and A. C. Davison (2018). High-dimensional peaks-over-threshold inference. Biometrika\/ 105\/ (3), 575–592
work page 2018
-
[20]
de Haan, L. and A. Ferreira (2006). Extreme value theory: an introduction , Volume 21. Springer
work page 2006
-
[21]
Dombry, C., S. Engelke, and M. Oesting (2016). Exact simulation of max-stable processes. Biometrika\/ 103\/ (2), 303--317
work page 2016
-
[22]
Einmahl, J. H., L. de Haan, and A. Krajina (2013). Estimating extreme bivariate quantile regions. Extremes\/ 16\/ (2), 121--145
work page 2013
-
[23]
Engelke, S. and A. S. Hitz (2020). Graphical models for extremes. Journal of the Royal Statistical Society: Series B\/ 84\/ (4), 871–932
work page 2020
-
[24]
Engelke, S., A. S. Hitz, N. Gnecco, and M. Hentschel (2024). graphicalExtremes: Statistical Methodology for Graphical Extreme Value Models . R package version 0.3.2
work page 2024
-
[25]
Engelke, S., A. Malinowski, Z. Kabluchko, and M. Schlather (2015). Estimation of h \"u sler--reiss distributions and brown--resnick processes. Journal of the Royal Statistical Society: Series B (Statistical Methodology)\/ 77\/ (1), 239--265
work page 2015
-
[26]
Falk, M., J. H \"u sler, and R.-D. Reiss (2010). Laws of small numbers: extremes and rare events . Springer Science & Business Media
work page 2010
-
[27]
Fils-Villetard, A., A. Guillou, and J. Segers (2008). Projection estimators of pickands dependence functions. Canadian Journal of Statistics\/ 36\/ (3), 369--382
work page 2008
-
[28]
Frolova, N. and I. Cribben (2016). extremogram: Estimation of Extreme Value Dependence for Time Series Data . R package version 1.0.2
work page 2016
-
[29]
Garthwaite, P. H., Y. Fan, and S. A. Sisson (2016). Adaptive optimal scaling of metropolis--hastings algorithms using the robbins--monro process. Communications in Statistics-Theory and Methods\/ 45\/ (17), 5098--5111
work page 2016
-
[30]
Gilleland, E. and R. W. Katz (2016). extremes 2.0: A n extreme value analysis package in R . Journal of Statistical Software\/ 72\/ (8), 1--39
work page 2016
-
[31]
Haario, H., E. Saksman, and J. Tamminen (2001). An adaptive Metropolis algorithm. Bernoulli\/ 7 , 223--242
work page 2001
-
[32]
He, Y. and J. H. Einmahl (2017). Estimation of extreme depth-based quantile regions. Journal of the Royal Statistical Society: Series B (Statistical Methodology)\/ 79\/ (2), 449--461
work page 2017
-
[33]
Heffernan, J. E. and A. G. Stephenson (2018). ismev: An introduction to statistical modeling of extreme values . R package version 1.4.2
work page 2018
-
[34]
Heffernan, J. E. and J. A. Tawn (2004). A conditional approach for multivariate extreme values (with discussion). Journal of the Royal Statistical Society: Series B (Statistical Methodology)\/ 66\/ (3), 497--546
work page 2004
-
[35]
Hijmans, R. J. (2024). terra: Spatial Data Analysis . R package version 1.7-78
work page 2024
-
[36]
Joe, H. (2014). Dependence modeling with copulas . CRC press
work page 2014
-
[37]
Marcon, G., P. Naveau, and S. Padoan (2017). A semi-parametric stochastic generator for bivariate extreme events. Stat\/ 6\/ (1), 184--201
work page 2017
-
[38]
Marcon, G., S. A. Padoan, and I. Antoniano-Villalobos (2016). Bayesian inference for the extremal dependence. Electronic Journal of Statistics\/ 10\/ (2), 3310--3337
work page 2016
-
[39]
Marcon, G., S. A. Padoan, P. Naveau, P. Muliere, and J. Segers (2017). Multivariate nonparametric estimation of the P ickands dependence function using B ernstein polynomials. J. Statist. Plann. Inference\/ 183 , 1--17
work page 2017
-
[40]
Northrop, P. J. and N. Attalides (2016). Posterior propriety in bayesian extreme value analyses using reference priors. Statistica Sinica\/ 26\/ (2), 721--743
work page 2016
-
[41]
Opitz, T. (2013). Extremal t processes: Elliptical domain of attraction and a spectral representation. Journal of Multivariate Analysis\/ 122\/ (0), 409 -- 413
work page 2013
-
[42]
Padoan, S. A., M. Ribatet, and S. A. Sisson (2010). Likelihood-based inference for max-stable processes. Journal of the American Statistical Association\/ 105\/ (489), 263--277
work page 2010
-
[43]
Padoan, S. A. and G. Stupfler (2020). ExtremeRisks: Extreme risk measures . R package version 0.0.4
work page 2020
-
[44]
Ribatet, M. (2022). SpatialExtremes: Modelling Spatial Extremes . R package version 2.1-0
work page 2022
-
[45]
Roberts, G. O., A. Gelman, and W. R. Gilks (1997). Weak convergence and optimal scaling of random walk Metropolis algorithms. Annals of Applied Probability\/ 7\/ (1), 110--120
work page 1997
-
[46]
Sabourin, A., P. Naveau, and A.-L. Fougeres (2013). Bayesian model averaging for multivariate extremes. Extremes\/ 16\/ (3), 325--350
work page 2013
-
[47]
Stephenson, A. and J. Tawn (2005). Exploiting occurrence times in likelihood inference for componentwise maxima. Biometrika\/ 92\/ (1), 213--227
work page 2005
-
[48]
Stephenson, A. G. (2002, June). evd: Extreme value distributions. R News\/ 2\/ (2), 31--32
work page 2002
-
[49]
Stephenson, A. G. and M. Ribatet (2023). evdbayes: Bayesian Analysis in Extreme Value Theory . R package version 1.1-3
work page 2023
-
[50]
Ypma, J. and S. G. Johnson (2022). The nlopt nonlinear-optimization package. R package version 2.0.3
work page 2022
discussion (0)
Sign in with ORCID, Apple, or X to comment. Anyone can read and Pith papers without signing in.