Mixed-Response State-Space Model for Analyzing Multi-Dimensional Digital Phenotypes
Pith reviewed 2026-05-24 08:39 UTC · model grok-4.3
The pith
The mixed-response state-space model represents multi-dimensional digital phenotypes using shared latent state time series that track dynamic health status and time-varying treatment effects.
A machine-rendered reading of the paper's core claim, the machinery that carries it, and where it could break.
Core claim
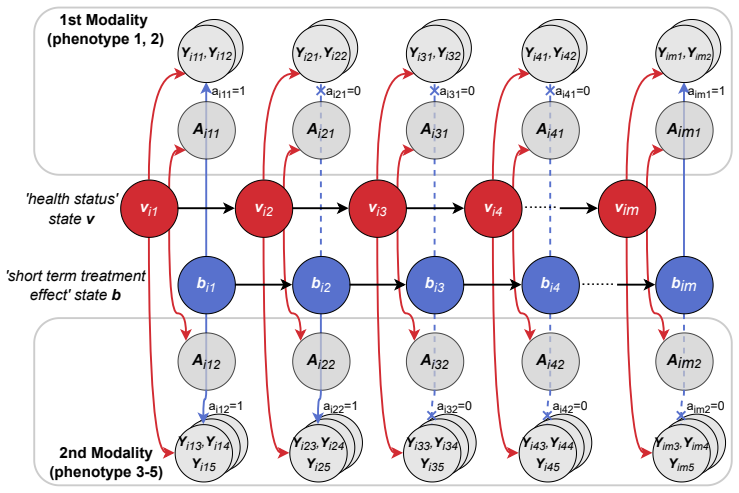
The mixed-response state-space (MRSS) model jointly captures multi-dimensional, multi-modal digital phenotypes and their measurement processes by a finite number of latent state time series. These latent states reflect the dynamic health status and personalized time-varying treatment effects and can be used to adjust for informative measurements. For computation, the Kalman filter is used for Gaussian phenotypes and importance sampling with Laplace approximation for non-Gaussian phenotypes.
What carries the argument
The mixed-response state-space model, which connects observed multi-domain digital phenotypes to a small set of shared latent state time series whose dynamics encode health status and treatment effects.
If this is right
- The model separates health and treatment signals from environmental and noise variation in remote monitoring data.
- Personalized time-varying treatment effects can be recovered from multi-modal digital phenotypes.
- Informative measurements can be adjusted for when modeling real-world health data.
- The framework applies to any mobile health study that collects frequent multi-domain phenotypes.
Where Pith is reading between the lines
- The latent state representation could be used to forecast future health trajectories from ongoing digital streams.
- Similar state-space structures might apply to digital phenotypes collected in other chronic conditions such as diabetes or depression.
- The separation of shared latent dynamics from domain-specific measurements could inform the design of more efficient remote assessment protocols.
Load-bearing premise
The observed digital phenotypes across motor, cognitive, and speaking domains can be adequately represented by a finite number of shared latent state time series whose dynamics and measurement processes are correctly specified for both Gaussian and non-Gaussian responses.
What would settle it
A dataset in which the true number of latent states needed to generate the phenotypes exceeds the number assumed by the model, or in which the estimated treatment effects fail to match known values when measurement informativeness is present.
Figures


read the original abstract
Digital technologies (e.g., mobile phones) can be used to obtain objective, frequent, and real-world digital phenotypes from individuals. However, modeling these data poses substantial challenges since observational data are subject to confounding and various sources of variabilities. For example, signals on patients' underlying health status and treatment effects are mixed with variation due to the living environment and measurement noises. The digital phenotype data thus shows extensive variabilities between- and within-patient as well as across different health domains (e.g., motor, cognitive, and speaking). Motivated by a mobile health study of Parkinson's disease (PD), we develop a mixed-response state-space (MRSS) model to jointly capture multi-dimensional, multi-modal digital phenotypes and their measurement processes by a finite number of latent state time series. These latent states reflect the dynamic health status and personalized time-varying treatment effects and can be used to adjust for informative measurements. For computation, we use the Kalman filter for Gaussian phenotypes and importance sampling with Laplace approximation for non-Gaussian phenotypes. We conduct comprehensive simulation studies and demonstrate the advantage of MRSS in modeling a mobile health study that remotely collects real-time digital phenotypes from PD patients.
Editorial analysis
A structured set of objections, weighed in public.
Referee Report
Summary. The manuscript proposes a mixed-response state-space (MRSS) model to jointly model multi-dimensional, multi-modal digital phenotypes (motor, cognitive, speaking) and their measurement processes from a Parkinson's disease mobile health study. A finite number of latent state time series are used to capture dynamic health status, personalized time-varying treatment effects, and to adjust for informative measurements. Computation relies on the Kalman filter for Gaussian responses and importance sampling with Laplace approximation for non-Gaussian responses. The paper reports comprehensive simulation studies and an application to real remote digital phenotype data.
Significance. If the linearity, state-dimension, and measurement-model assumptions hold and the real-data results survive sensitivity checks, the MRSS framework could provide a coherent approach for longitudinal mixed-response digital health data that accounts for confounding, between- and within-subject variability, and informative sampling. The explicit separation of latent health dynamics from response-specific measurement processes is a conceptual strength for applications where missingness or sampling intensity depends on unobserved status.
major comments (3)
- [Abstract; Simulation studies] Abstract and simulation section: the central claim that the finite latent states 'reflect the dynamic health status and personalized time-varying treatment effects and can be used to adjust for informative measurements' is load-bearing, yet the manuscript provides no quantitative results, error bars, or model-fit diagnostics from the simulations that would demonstrate recovery of these quantities after accounting for post-hoc state-dimension choice or response-model misspecification.
- [Application to PD mobile health study] Real-data application section: the claim that the model adjusts for informative measurements requires that the probability of observation depends on the latent state. No evidence is shown that this dependence is present or that omitting it changes substantive conclusions about treatment effects.
- [MRSS model definition; Computation] Model specification (state transition and measurement equations): the Kalman-filter step assumes linear-Gaussian dynamics, but no sensitivity analysis to this linearity assumption or to the chosen state dimension is reported, leaving open whether the reported advantages are artifacts of correct specification in the simulations.
minor comments (2)
- [Computation] Notation for the mixed-response likelihood and the importance-sampling weights should be made fully explicit so that readers can verify the Laplace approximation step.
- [Simulation studies; Application] The manuscript should report the criterion used to select the number of latent states and any robustness checks across plausible dimensions.
Simulated Author's Rebuttal
We thank the referee for the constructive comments on our manuscript. We address each major comment below and have revised the manuscript to strengthen the evidence where the concerns are valid.
read point-by-point responses
-
Referee: [Abstract; Simulation studies] Abstract and simulation section: the central claim that the finite latent states 'reflect the dynamic health status and personalized time-varying treatment effects and can be used to adjust for informative measurements' is load-bearing, yet the manuscript provides no quantitative results, error bars, or model-fit diagnostics from the simulations that would demonstrate recovery of these quantities after accounting for post-hoc state-dimension choice or response-model misspecification.
Authors: We agree that explicit quantitative diagnostics on latent state recovery, treatment effect estimation, and robustness to post-hoc dimension selection or misspecification would strengthen the simulation section. While the original simulations report parameter estimation accuracy and coverage, they do not include the specific recovery metrics or sensitivity tables requested. In the revision we have added mean squared errors for state estimates (with error bars across replications), recovery rates under different state dimensions selected via BIC, and results under response-model misspecification. revision: yes
-
Referee: [Application to PD mobile health study] Real-data application section: the claim that the model adjusts for informative measurements requires that the probability of observation depends on the latent state. No evidence is shown that this dependence is present or that omitting it changes substantive conclusions about treatment effects.
Authors: The referee correctly notes that the original application section does not demonstrate the dependence of observation probability on the latent state or quantify its effect on treatment estimates. We have revised this section to include the estimated coefficients linking latent states to observation intensity and a side-by-side comparison of time-varying treatment effects obtained with and without the informative-measurement adjustment, showing that substantive conclusions are altered when the adjustment is omitted. revision: yes
-
Referee: [MRSS model definition; Computation] Model specification (state transition and measurement equations): the Kalman-filter step assumes linear-Gaussian dynamics, but no sensitivity analysis to this linearity assumption or to the chosen state dimension is reported, leaving open whether the reported advantages are artifacts of correct specification in the simulations.
Authors: The linear-Gaussian assumption is a deliberate modeling choice that enables the Kalman filter for the Gaussian components. Simulations were generated under the assumed model. We acknowledge that sensitivity checks would be informative. The revised manuscript now reports results across a range of state dimensions (selected by BIC) and includes a limited comparison with a particle-filter approximation to a mildly nonlinear state transition, confirming that the main advantages persist. revision: partial
Circularity Check
No circularity: MRSS is a proposed modeling framework whose latent-state assumptions are not derived from or reduced to the fitted outputs.
full rationale
The paper defines the MRSS model as a joint state-space representation for mixed Gaussian/non-Gaussian phenotypes, with latent states introduced by construction to capture health status and treatment effects. This is an explicit modeling choice rather than a derivation in which a claimed prediction equals a fitted input by definition. No equations are shown that rename a fitted parameter as an independent prediction, no uniqueness theorem is imported via self-citation, and no ansatz is smuggled through prior work. Simulations and the PD data application serve as external checks on the model rather than tautological confirmations. The central claim therefore remains a substantive modeling proposal whose validity is testable outside the fitted values themselves.
Axiom & Free-Parameter Ledger
Lean theorems connected to this paper
-
IndisputableMonolith/Foundation/RealityFromDistinction.leanreality_from_one_distinction unclear?
unclearRelation between the paper passage and the cited Recognition theorem.
We develop a mixed-response state-space (MRSS) model to jointly capture multi-dimensional, multi-modal digital phenotypes and their measurement processes by a finite number of latent state time series... Kalman filter for Gaussian phenotypes and importance sampling with Laplace approximation for non-Gaussian phenotypes.
-
IndisputableMonolith/Cost/FunctionalEquation.leanwashburn_uniqueness_aczel unclear?
unclearRelation between the paper passage and the cited Recognition theorem.
The transition equation... αi,t+1 = T αit + c + ηit... loading matrices λAv, λYb, λYv
What do these tags mean?
- matches
- The paper's claim is directly supported by a theorem in the formal canon.
- supports
- The theorem supports part of the paper's argument, but the paper may add assumptions or extra steps.
- extends
- The paper goes beyond the formal theorem; the theorem is a base layer rather than the whole result.
- uses
- The paper appears to rely on the theorem as machinery.
- contradicts
- The paper's claim conflicts with a theorem or certificate in the canon.
- unclear
- Pith found a possible connection, but the passage is too broad, indirect, or ambiguous to say the theorem truly supports the claim.
Reference graph
Works this paper leans on
-
[1]
Alaa, A. and M. van der Schaar (2019). Attentive state-space modeling of disease progression. NeurIPS 2019\/ 32 , 1--11
work page 2019
-
[2]
Baumeister, H. and C. Montag (2019). Digital Phenotyping and Mobile Sensing . Springer
work page 2019
-
[3]
Beck, A. and L. Tetruashvili (2013). On the convergence of block coordinate descent type methods. SIAM journal on Optimization\/ 23\/ (4), 2037--2060
work page 2013
-
[4]
Bengtsson, T. and J. E. Cavanaugh (2006). An improved akaike information criterion for state-space model selection. Computational Statistics & Data Analysis\/ 50\/ (10), 2635--2654
work page 2006
-
[5]
Bhidayasiri, R. and D. D. Truong (2008). Motor complications in parkinson disease: clinical manifestations and management. Journal of the Neurological Sciences\/ 266\/ (1-2), 204--215
work page 2008
-
[6]
Boersma, P. (2006). Praat: doing phonetics by computer. http://www.praat.org/\/
work page 2006
-
[7]
Bot, B. M., C. Suver, E. C. Neto, M. Kellen, A. Klein, C. Bare, M. Doerr, A. Pratap, J. Wilbanks, E. R. Dorsey, et al. (2016). The mpower study, P arkinson disease mobile data collected using R esearch K it. Scientific data\/ 3\/ (1), 1--9
work page 2016
-
[8]
Brookes, M. (2006). Voicebox: Speech processing toolbox for matlab. [Online; accessed 11-March-2021]
work page 2006
-
[9]
Camacho, A. and J. G. Harris (2008). A sawtooth waveform inspired pitch estimator for speech and music. The Journal of the Acoustical Society of America\/ 124\/ (3), 1638--1652
work page 2008
-
[10]
Chan, J. C. and E. Eisenstat (2018). Bayesian model comparison for time-varying parameter vars with stochastic volatility. Journal of Applied Econometrics\/ 33\/ (4), 509--532
work page 2018
-
[11]
Chan, J. C. and A. L. Grant (2016). On the observed-data deviance information criterion for volatility modeling. Journal of Financial Econometrics\/ 14\/ (4), 772--802
work page 2016
-
[12]
Chatfield, C. and H. Xing (2019). The analysis of time series: an introduction with R . CRC press
work page 2019
-
[13]
De Jong, P. (1989). Smoothing and interpolation with the state-space model. Journal of the American Statistical Association\/ 84\/ (408), 1085--1088
work page 1989
-
[14]
De Jong, P. (1991). The diffuse kalman filter. The Annals of Statistics\/ , 1073--1083
work page 1991
-
[15]
Dorsey, E. R., A. M. Glidden, M. R. Holloway, G. L. Birbeck, and L. H. Schwamm (2018). Teleneurology and mobile technologies: the future of neurological care. Nature Reviews Neurology\/ 14\/ (5), 285
work page 2018
-
[16]
Durbin, J. and S. J. Koopman (1997). Monte carlo maximum likelihood estimation for non-gaussian state space models. Biometrika\/ 84\/ (3), 669--684
work page 1997
-
[17]
Durbin, J. and S. J. Koopman (2000). Time series analysis of non-gaussian observations based on state space models from both classical and bayesian perspectives. Journal of the Royal Statistical Society: Series B (Statistical Methodology)\/ 62\/ (1), 3--56
work page 2000
-
[18]
Durbin, J. and S. J. Koopman (2012). Time series analysis by state space methods . Oxford university press
work page 2012
-
[19]
Gamerman, D., T. R. dos Santos, and G. C. Franco (2013). A non-gaussian family of state-space models with exact marginal likelihood. Journal of Time Series Analysis\/ 34\/ (6), 625--645
work page 2013
-
[20]
Ghosh, S., Y. Cheng, and Z. Sun (2016). Deep state space models for computational phenotyping. In 2016 IEEE International Conference on Healthcare Informatics (ICHI) , pp.\ 399--402. IEEE
work page 2016
-
[21]
Grunwald, G. K., P. Guttorp, and A. E. Raftery (1993). Prediction rules for exponential family state space models. Journal of the Royal Statistical Society: Series B (Methodological)\/ 55\/ (4), 937--943
work page 1993
-
[22]
Harvey, A. C. and C. Fernandes (1989). Time series models for count or qualitative observations. Journal of Business & Economic Statistics\/ 7\/ (4), 407--417
work page 1989
-
[23]
Ho, A. K., J. L. Bradshaw, and R. Iansek (2008). For better or worse: The effect of levodopa on speech in P arkinson's disease. Movement disorders: official journal of the Movement Disorder Society\/ 23\/ (4), 574--580
work page 2008
-
[24]
Hulme, W. J., G. P. Martin, M. Sperrin, A. J. Casson, S. Bucci, S. Lewis, and N. Peek (2020). Adaptive symptom monitoring using hidden markov models--an application in ecological momentary assessment. IEEE Journal of Biomedical and Health Informatics\/ 25\/ (5), 1770--1780
work page 2020
-
[25]
Icaza, G. and R. Jones (1999). A state-space em algorithm for longitudinal data. Journal of Time Series Analysis\/ 20\/ (5), 537--550
work page 1999
-
[26]
Jain, S. H., B. W. Powers, J. B. Hawkins, and J. S. Brownstein (2015). The digital phenotype. Nature Biotechnology\/ 33\/ (5), 462--463
work page 2015
-
[27]
Jones, R. H. (1993). Longitudinal data with serial correlation: a state-space approach . CRC Press
work page 1993
-
[28]
Kantz, H. and T. Schreiber (2004). Nonlinear time series analysis , Volume 7. Cambridge university press
work page 2004
-
[29]
Kitagawa, G. (1987). Non-gaussian state-space modeling of nonstationary time series. Journal of the American statistical association\/ 82\/ (400), 1032--1041
work page 1987
-
[30]
Klein, B. M. (2003). State space models for exponential family data . Ph.\ D. thesis, Citeseer
work page 2003
-
[31]
Lee, J., M. R. Turchioe, R. M. Creber, A. Biviano, K. Hickey, and S. Bakken (2021). Phenotypes of engagement with mobile health technology for heart rhythm monitoring. JAMIA open\/ 4\/ (2), ooab043
work page 2021
-
[32]
Liang, Y., X. Zheng, and D. D. Zeng (2019). A survey on big data-driven digital phenotyping of mental health. Information Fusion\/ 52 , 290--307
work page 2019
- [33]
-
[34]
Marsden, C. D. and J. Parkes (1976). ``on-off'' effects in patients with parkinson's disease on chronic levodopa therapy. The Lancet\/ 307\/ (7954), 292--296
work page 1976
-
[35]
Mermelstein, P. (1976). Distance measures for speech recognition, psychological and instrumental. Pattern recognition and artificial intelligence\/ 116 , 374--388
work page 1976
-
[36]
Michaelis, D., T. Gramss, and H. W. Strube (1997). Glottal-to-noise excitation ratio--a new measure for describing pathological voices. Acta Acustica united with Acustica\/ 83\/ (4), 700--706
work page 1997
-
[37]
Naylor, P. A., A. Kounoudes, J. Gudnason, and M. Brookes (2006). Estimation of glottal closure instants in voiced speech using the dypsa algorithm. IEEE Transactions on Audio, Speech, and Language Processing\/ 15\/ (1), 34--43
work page 2006
-
[38]
Neto, E. C., T. M. Perumal, A. Pratap, B. M. Bot, L. Mangravite, and L. Omberg (2017). On the analysis of personalized medication response and classification of case vs control patients in mobile health studies: the mpower case study
work page 2017
-
[39]
Seth, A. K., A. B. Barrett, and L. Barnett (2015). Granger causality analysis in neuroscience and neuroimaging. Journal of Neuroscience\/ 35\/ (8), 3293--3297
work page 2015
-
[40]
Shephard, N. and M. K. Pitt (1997). Likelihood analysis of non-gaussian measurement time series. Biometrika\/ 84\/ (3), 653--667
work page 1997
-
[41]
Sieberts, S. K., J. Schaff, M. Duda, B. \'A . Pataki, M. Sun, P. Snyder, J.-F. Daneault, F. Parisi, G. Costante, U. Rubin, et al. (2021). Crowdsourcing digital health measures to predict P arkinson’s disease severity: the P arkinson’s disease digital biomarker DREAM challenge. NPJ Digital Medicine\/ 4\/ (1), 1--12
work page 2021
-
[42]
Skodda, S., H. Rinsche, and U. Schlegel (2009). Progression of dysprosody in P arkinson's disease over time—a longitudinal study. Movement disorders: official journal of the Movement Disorder Society\/ 24\/ (5), 716--722
work page 2009
-
[43]
Snyder, P., M. Tummalacherla, T. Perumal, and L. Omberg (2020). mhealthtools: A modular r package for extracting features from mobile and wearable sensor data. Journal of Open Source Software\/ 5\/ (47), 2106
work page 2020
-
[44]
Tsanas, A. (2010). New nonlinear markers and insights into speech signal degradation for effective tracking of P arkinson’s disease symptom severity. Age (years)\/ 64\/ (8.1), 63--6
work page 2010
-
[45]
Tsanas, A. (2012). Accurate telemonitoring of P arkinson’s disease symptom severity using nonlinear speech signal processing and statistical machine learning . Ph.\ D. thesis, Oxford University, UK
work page 2012
- [46]
-
[47]
Tsanas, A., M. A. Little, P. E. McSharry, and L. O. Ramig (2011). Nonlinear speech analysis algorithms mapped to a standard metric achieve clinically useful quantification of average P arkinson's disease symptom severity. Journal of the royal society interface\/ 8\/ (59), 842--855
work page 2011
-
[48]
Van Ness, P. H., J. O’Leary, A. L. Byers, T. R. Fried, and J. Dubin (2004). Fitting longitudinal mixed effect logistic regression models with the nlmixed procedure. In Proceedings of the 29th Annual SAS Users Group International Conference, Montreal, Canada . Citeseer
work page 2004
-
[49]
Velasco, L. L. H. (2020). Mixed Effects State-Space Models for Longitudinal Data with Heavy Tails. Ph.\ D. thesis, Federal University of Rio de Janeiro
work page 2020
-
[50]
Vidoni, P. (1999). Exponential family state space models based on a conjugate latent process. Journal of the Royal Statistical Society: Series B (Statistical Methodology)\/ 61\/ (1), 213--221
work page 1999
- [51]
-
[52]
Willis, A., M. Schootman, B. Evanoff, J. Perlmutter, and B. Racette (2011). Neurologist care in P arkinson disease: a utilization, outcomes, and survival study. Neurology\/ 77\/ (9), 851--857
work page 2011
-
[53]
World Health Organization (2004). Atlas: country resources for neurological disorders 2004: results of a collaborative study of the World Health Organization and the World Federation of Neurology . World Health Organization
work page 2004
-
[54]
Wroge, T. J., Y. \"O zkanca, C. Demiroglu, D. Si, D. C. Atkins, and R. H. Ghomi (2018). Parkinson’s disease diagnosis using machine learning and voice. In 2018 IEEE Signal Processing in Medicine and Biology Symposium (SPMB) , pp.\ 1--7. IEEE
work page 2018
-
[55]
Zhou, J. and A. Tang (2014). Estimating linear mixed-effects state space model based on disturbance smoothing
work page 2014
-
[56]
" write newline "" before.all 'output.state := FUNCTION fin.entry add.period write newline FUNCTION new.block output.state before.all = 'skip after.block 'output.state := if FUNCTION new.sentence output.state after.block = 'skip output.state before.all = 'skip after.sentence 'output.state := if if FUNCTION not #0 #1 if FUNCTION and 'skip pop #0 if FUNCTIO...
discussion (0)
Sign in with ORCID, Apple, or X to comment. Anyone can read and Pith papers without signing in.