Photospheric Lorentz force changes in eruptive and confined solar flares
Pith reviewed 2026-05-24 05:21 UTC · model grok-4.3
The pith
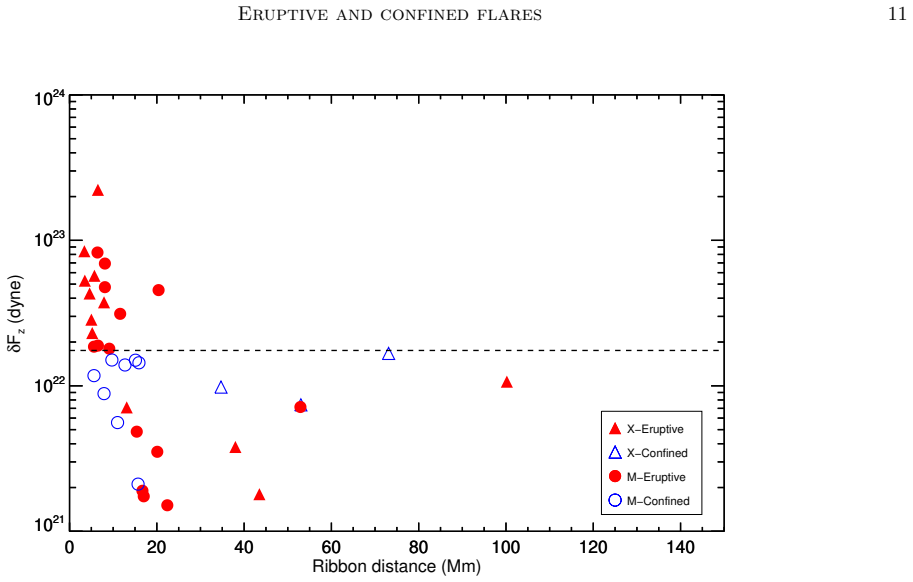
Confined solar flares show total downward Lorentz force changes below 1.8 × 10^22 dyne, unlike eruptive flares.
A machine-rendered reading of the paper's core claim, the machinery that carries it, and where it could break.
Core claim
Analysis of SHARP vector-magnetograms shows a rapid increase in the horizontal magnetic field along the flaring polarity inversion line together with a significant change in the downward-directed Lorentz force in the same region. All confined events exhibit a total change in Lorentz force of less than 1.8 × 10^22 dyne. This threshold distinguishes eruptive from confined flares, and the magnitude of the change further depends on reconnection height in the corona.
What carries the argument
Total change in downward-directed Lorentz force integrated over a localized area around the polarity inversion line encompassing the flare site.
If this is right
- Eruptive flares transmit a larger upward impulse from the photosphere that can drive a coronal mass ejection.
- The 1.8 × 10^22 dyne threshold supplies a practical diagnostic for classifying flare eruptivity from surface magnetic data.
- The Lorentz force change correlates with reconnection height, linking photospheric and coronal dynamics during the flare.
- Synthetic delta-sunspot simulations reproduce the same pattern of force changes seen in the observations.
Where Pith is reading between the lines
- Real-time tracking of photospheric Lorentz force near polarity inversion lines could supply an early indicator of whether an ongoing flare will produce an ejection.
- Applying the same measurement to weaker flares would test whether the threshold scales with flare magnitude.
- The reconnection-height dependence points to a direct energy-transfer pathway that MHD models could target for verification.
- Automated detection of the integration area around the polarity inversion line might reduce selection uncertainty in future applications.
Load-bearing premise
The 37 selected M5+ flares and the precise areas chosen around each polarity inversion line are representative and free of projection or data-processing artifacts that would systematically alter the integrated force for one class versus the other.
What would settle it
Detection of even one confined flare exceeding 1.8 × 10^22 dyne total Lorentz force change, or one eruptive flare staying below it, in a comparable set of HMI magnetograms would falsify the threshold distinction.
Figures


read the original abstract
Solar flares are known to leave imprints on the magnetic field at the photosphere, often manifested as an abrupt and permanent change in the downward-directed Lorentz force in localized areas inside the active region. Our study aims to differentiate eruptive and confined solar flares based on the vertical Lorentz force variations. We select 26 eruptive and 11 confined major solar flares (stronger than the GOES M5 class) observed during 2011-2017. We analyze these flaring regions using SHARP vector-magnetograms obtained from the NASA's Helioseismic and Magnetic Imager (HMI). We also compare data corresponding to 2 synthetic flares from a $\delta$--sunspot simulation reported in Chatterjee et al. [Phys. Rev. Lett. 116, 101101 (2016)]. We estimate the change in the horizontal magnetic field and the total Lorentz force integrated over an area around the polarity inversion line (PIL) that encompasses the location of the flare. Our results indicate a rapid increase of the horizontal magnetic field along the flaring PIL, accompanied by a significant change in the downward-directed Lorentz force in the same vicinity. Notably, we find that all the confined events under study exhibit a total change in Lorentz force of < $1.8 \times 10^{22}$ dyne. This threshold plays an important factor in effectively distinguishing eruptive and confined flares. Further, our analysis suggests that the change in total Lorentz force also depends on the reconnection height in the solar corona during the associated flare onset. The results provide significant implications for understanding the flare-related upward impulse transmission for the associated coronal mass ejection.
Editorial analysis
A structured set of objections, weighed in public.
Referee Report
Summary. The manuscript analyzes HMI vector magnetograms for 26 eruptive and 11 confined M5+ flares (2011-2017) plus two synthetic flares from a δ-sunspot simulation. It reports a rapid increase in horizontal field along the PIL accompanied by a change in downward Lorentz force, finding that every confined event shows a total integrated ΔF_Lorentz < 1.8 × 10^22 dyne while eruptive events exceed this value; the threshold is presented as an effective discriminator, with additional dependence on coronal reconnection height.
Significance. If the separation survives scrutiny of area selection and sample definition, the result supplies an empirical photospheric observable that links force changes to eruptive potential and could inform CME forecasting. Use of public HMI data and direct comparison to simulation output are clear strengths that enhance reproducibility.
major comments (2)
- [Abstract and data-analysis description] The central separation at 1.8 × 10^22 dyne is obtained by integrating over 'an area around the PIL that encompasses the location of the flare.' No fixed physical radius, automated contour, or sensitivity test to area variations is described; because eruptive flares systematically occupy larger areas, the integrated quantity can be altered by the area choice itself rather than by the underlying physics. This directly undermines attribution of the clean threshold to the eruptive/confined distinction.
- [Results and discussion of the threshold] The threshold is an empirical summary statistic derived from the 37-event sample rather than a pre-specified criterion; with only 11 confined events, no cross-validation or stability test against sample definition or area choice is reported. The separation could therefore be sensitive to the particular flares selected or the precise integration boundaries.
minor comments (1)
- [Abstract] The abstract states that the change in total Lorentz force 'also depends on the reconnection height' but provides no quantitative relation or figure; a brief clarification or reference to the relevant panel would improve readability.
Simulated Author's Rebuttal
We thank the referee for the constructive comments. We address each major point below, agreeing where revisions are needed to improve clarity and robustness.
read point-by-point responses
-
Referee: [Abstract and data-analysis description] The central separation at 1.8 × 10^22 dyne is obtained by integrating over 'an area around the PIL that encompasses the location of the flare.' No fixed physical radius, automated contour, or sensitivity test to area variations is described; because eruptive flares systematically occupy larger areas, the integrated quantity can be altered by the area choice itself rather than by the underlying physics. This directly undermines attribution of the clean threshold to the eruptive/confined distinction.
Authors: We agree that the integration area requires a more explicit and reproducible definition. The areas were chosen to encompass the observed region of horizontal field increase along the PIL associated with each flare, guided by the spatial extent of the flare ribbons and field changes in the HMI data. In revision we will add a quantitative description of the selection (e.g., contour at a minimum ΔB_h threshold) and include sensitivity tests that vary the area by ±20 % around the nominal choice, showing that the 1.8 × 10^22 dyne separation persists. These changes will be incorporated. revision: yes
-
Referee: [Results and discussion of the threshold] The threshold is an empirical summary statistic derived from the 37-event sample rather than a pre-specified criterion; with only 11 confined events, no cross-validation or stability test against sample definition or area choice is reported. The separation could therefore be sensitive to the particular flares selected or the precise integration boundaries.
Authors: The threshold is an empirical discriminator identified from the clear separation in the 37-event sample. With only 11 confined events we recognize the statistical limitations and lack of cross-validation. In the revised manuscript we will expand the discussion to state explicitly that the value is sample-derived, note the modest confined-flare count, and report the area-sensitivity tests described above. We maintain that the observed separation is physically informative for this dataset while agreeing to highlight these caveats. revision: partial
Circularity Check
No circularity; purely observational empirical threshold
full rationale
The paper is an observational analysis of HMI vector magnetograms for 37 selected flares (26 eruptive, 11 confined). It computes the integrated change in downward Lorentz force over an area around the PIL and reports that all confined events fall below an empirical threshold of 1.8e22 dyne as a direct summary statistic of the measurements. No equations derive this threshold from prior assumptions or inputs; the separation is a post-hoc observation from the data. The citation to Chatterjee et al. (2016) supplies only supplementary synthetic flare comparisons and does not load-bear the central observational claim. No self-definitional steps, fitted inputs renamed as predictions, or ansatz smuggling occur.
Axiom & Free-Parameter Ledger
free parameters (1)
- Lorentz-force threshold =
1.8e22 dyne
axioms (1)
- domain assumption SHARP/HMI vector magnetograms provide a faithful representation of the photospheric magnetic field vector without significant projection or calibration artifacts inside the chosen PIL boxes.
Lean theorems connected to this paper
-
IndisputableMonolith/Foundation/AlexanderDuality.lean (D=3 forcing)alexander_duality_circle_linking unclear?
unclearRelation between the paper passage and the cited Recognition theorem.
We estimate the change in the horizontal magnetic field and the total Lorentz force integrated over an area around the polarity inversion line (PIL)
What do these tags mean?
- matches
- The paper's claim is directly supported by a theorem in the formal canon.
- supports
- The theorem supports part of the paper's argument, but the paper may add assumptions or extra steps.
- extends
- The paper goes beyond the formal theorem; the theorem is a base layer rather than the whole result.
- uses
- The paper appears to rely on the theorem as machinery.
- contradicts
- The paper's claim conflicts with a theorem or certificate in the canon.
- unclear
- Pith found a possible connection, but the passage is too broad, indirect, or ambiguous to say the theorem truly supports the claim.
Reference graph
Works this paper leans on
-
[1]
Andrews, M. D. 2003, SoPh, 218, 261, doi: 10.1023/B:SOLA.0000013039.69550.bf
-
[2]
2016, Nature Physics, 12, 998, doi: 10.1038/nphys3938
Aulanier, G. 2016, Nature Physics, 12, 998, doi: 10.1038/nphys3938
-
[3]
2004, Space Weather, 2, S02004, doi: 10.1029/2003SW000044
Panasyuk, M. 2004, Space Weather, 2, S02004, doi: 10.1029/2003SW000044
-
[4]
Barczynski, K., Aulanier, G., Masson, S., & Wheatland, M. S. 2019, ApJ, 877, 67, doi: 10.3847/1538-4357/ab1b3d
-
[5]
M., Tomczyk, S., Kubo, M., et al
Borrero, J. M., Tomczyk, S., Kubo, M., et al. 2011, SoPh, 273, 267, doi: 10.1007/s11207-010-9515-6
-
[6]
1964, in NASA Special Publication, Vol
Carmichael, H. 1964, in NASA Special Publication, Vol. 50, 451 Castellanos Dur´ an, J. S., Kleint, L., & Calvo-Mozo, B. 2018, ApJ, 852, 25, doi: 10.3847/1538-4357/aa9d37
-
[7]
2016, PhRvL, 116, 101101, doi: 10.1103/PhysRevLett.116.101101
Chatterjee, P., Hansteen, V., & Carlsson, M. 2016, PhRvL, 116, 101101, doi: 10.1103/PhysRevLett.116.101101
-
[8]
2017, Physics of Plasmas, 24, 090501, doi: 10.1063/1.4993929
Chen, J. 2017, Physics of Plasmas, 24, 090501, doi: 10.1063/1.4993929
-
[9]
Fisher, G. H., Bercik, D. J., Welsch, B. T., & Hudson, H. S. 2012, SoPh, 277, 59, doi: 10.1007/s11207-011-9907-2
-
[10]
Fletcher, L., & Hudson, H. S. 2008, ApJ, 675, 1645, doi: 10.1086/527044
-
[11]
2012, ApJ, 749, 85, doi: 10.1088/0004-637X/749/1/85
Gosain, S. 2012, ApJ, 749, 85, doi: 10.1088/0004-637X/749/1/85
-
[12]
2018, SSRv, 214, 46, doi: 10.1007/s11214-017-0462-5
Veronig, A. 2018, SSRv, 214, 46, doi: 10.1007/s11214-017-0462-5
-
[13]
Harrison, R. A. 2003, Advances in Space Research, 32, 2425, doi: 10.1016/j.asr.2003.03.016
-
[14]
1974, SoPh, 34, 323, doi: 10.1007/BF00153671
Hirayama, T. 1974, SoPh, 34, 323, doi: 10.1007/BF00153671
-
[15]
Hudson, H. S. 2000, ApJL, 531, L75, doi: 10.1086/312516
-
[16]
Hudson, H. S., Fisher, G. H., & Welsch, B. T. 2008, in Astronomical Society of the Pacific Conference Series, Vol. 383, Subsurface and Atmospheric Influences on Solar Activity, ed. R. Howe, R. W. Komm, K. S. Balasubramaniam, & G. J. D. Petrie, 221
work page 2008
-
[17]
2018, ApJ, 864, 138, doi: 10.3847/1538-4357/aad6e4
Jing, J., Liu, C., Lee, J., et al. 2018, ApJ, 864, 138, doi: 10.3847/1538-4357/aad6e4
-
[18]
Kazachenko, M. D. 2023, arXiv e-prints, arXiv:2310.02878, doi: 10.48550/arXiv.2310.02878
-
[19]
Kazachenko, M. D., Albelo-Corchado, M. F., Tamburri, C. A., & Welsch, B. T. 2022, SoPh, 297, 59, doi: 10.1007/s11207-022-01987-6
-
[20]
2017, ApJ, 834, 26, doi: 10.3847/1538-4357/834/1/26
Kleint, L. 2017, ApJ, 834, 26, doi: 10.3847/1538-4357/834/1/26
-
[21]
Kopp, R. A., & Pneuman, G. W. 1976, SoPh, 50, 85, doi: 10.1007/BF00206193 Kors´ os, M. B., Chatterjee, P., & Erd´ elyi, R. 2018, ApJ, 857, 103, doi: 10.3847/1538-4357/aab891 Kors´ os, M. B., Ludm´ any, A., Erd´ elyi, R., & Baranyi, T. 2015, ApJL, 802, L21, doi: 10.1088/2041-8205/802/2/L21
-
[22]
2020, MNRAS, 497, 976, doi: 10.1093/mnras/staa1974
Kumar, H., & Kumar, B. 2020, MNRAS, 497, 976, doi: 10.1093/mnras/staa1974
-
[23]
Lemen, J. R., Title, A. M., Akin, D. J., et al. 2012, SoPh, 275, 17, doi: 10.1007/s11207-011-9776-8
-
[24]
2011, ApJL, 727, L19, doi: 10.1088/2041-8205/727/1/L19
Li, Y., Jing, J., Fan, Y., & Wang, H. 2011, ApJL, 727, L19, doi: 10.1088/2041-8205/727/1/L19
-
[25]
2022, ApJL, 934, L33, doi: 10.3847/2041-8213/ac83bf
Liu, L., Zhou, Z., Wang, Y., Sun, X., & Wang, G. 2022, ApJL, 934, L33, doi: 10.3847/2041-8213/ac83bf
-
[26]
Moore, R. L., Sterling, A. C., Hudson, H. S., & Lemen, J. R. 2001, ApJ, 552, 833, doi: 10.1086/320559 Pencil Code Collaboration, Brandenburg, A., Johansen, A., et al. 2021, The Journal of Open Source Software, 6, 2807, doi: 10.21105/joss.02807
-
[27]
Pesnell, W. D., Thompson, B. J., & Chamberlin, P. C. 2012, SoPh, 275, 3, doi: 10.1007/s11207-011-9841-3
-
[28]
Petrie, G. J. D. 2012, ApJ, 759, 50, doi: 10.1088/0004-637X/759/1/50
-
[29]
Petrie, G. J. D. 2019, ApJS, 240, 11, doi: 10.3847/1538-4365/aaef2f
-
[30]
Petrie, G. J. D., & Sudol, J. J. 2010, ApJ, 724, 1218, doi: 10.1088/0004-637X/724/2/1218
-
[31]
Reep, J. W., & Toriumi, S. 2017, ApJ, 851, 4, doi: 10.3847/1538-4357/aa96fe
-
[32]
2000, ApJ, 540, 583, doi: 10.1086/309303
Sammis, I., Tang, F., & Zirin, H. 2000, ApJ, 540, 583, doi: 10.1086/309303
-
[33]
2018, SoPh, 293, 16, doi: 10.1007/s11207-017-1235-8
Sarkar, R., & Srivastava, N. 2018, SoPh, 293, 16, doi: 10.1007/s11207-017-1235-8
-
[34]
Sarkar, R., Srivastava, N., & Veronig, A. M. 2019, The Astrophysical Journal Letters, 885, L17, doi: 10.3847/2041-8213/ab4da2
-
[35]
Schou, J., Scherrer, P. H., Bush, R. I., et al. 2012, SoPh, 275, 229, doi: 10.1007/s11207-011-9842-2
-
[36]
2011, Living Reviews in Solar Physics, 8, 6, doi: 10.12942/lrsp-2011-6
Shibata, K., & Magara, T. 2011, Living Reviews in Solar Physics, 8, 6, doi: 10.12942/lrsp-2011-6
-
[37]
Siscoe, G. 2000, Journal of Atmospheric and Solar-Terrestrial Physics, 62, 1223, doi: 10.1016/S1364-6826(00)00074-2
-
[38]
Sturrock, P. A. 1966, Nature, 211, 695, doi: 10.1038/211695a0
-
[39]
Sudol, J. J., & Harvey, J. W. 2005, ApJ, 635, 647, doi: 10.1086/497361
-
[40]
2017, ApJ, 839, 67, doi: 10.3847/1538-4357/aa69c1 Eruptive and confined flares 19
Chen, R. 2017, ApJ, 839, 67, doi: 10.3847/1538-4357/aa69c1 Eruptive and confined flares 19
-
[41]
Sun, X., Hoeksema, J. T., Liu, Y., et al. 2012, ApJ, 748, 77, doi: 10.1088/0004-637X/748/2/77
-
[42]
2017, ApJ, 834, 56, doi: 10.3847/1538-4357/834/1/56
Nagashima, K. 2017, ApJ, 834, 56, doi: 10.3847/1538-4357/834/1/56
-
[43]
2019, Living Reviews in Solar Physics, 16, 3, doi: 10.1007/s41116-019-0019-7
Toriumi, S., & Wang, H. 2019, Living Reviews in Solar Physics, 16, 3, doi: 10.1007/s41116-019-0019-7
-
[44]
Turmon, M., Jones, H. P., Malanushenko, O. V., & Pap, J. M. 2010, SoPh, 262, 277, doi: 10.1007/s11207-009-9490-y
-
[45]
Doddamani, V. H. 2022, ApJ, 927, 86, doi: 10.3847/1538-4357/ac4d8c
-
[46]
2006, ApJ, 649, 490, doi: 10.1086/506320
Wang, H. 2006, ApJ, 649, 490, doi: 10.1086/506320
-
[47]
2015, Research in Astronomy and Astrophysics, 15, 145, doi: 10.1088/1674-4527/15/2/001
Wang, H., & Liu, C. 2015, Research in Astronomy and Astrophysics, 15, 145, doi: 10.1088/1674-4527/15/2/001
-
[48]
2012a, ApJL, 745, L17, doi: 10.1088/2041-8205/745/2/L17
Wang, S., Liu, C., Liu, R., et al. 2012a, ApJL, 745, L17, doi: 10.1088/2041-8205/745/2/L17
-
[49]
2012b, ApJL, 757, L5, doi: 10.1088/2041-8205/757/1/L5
Wang, S., Liu, C., & Wang, H. 2012b, ApJL, 757, L5, doi: 10.1088/2041-8205/757/1/L5
-
[50]
Webb, D. F., & Howard, T. A. 2012, Living Reviews in Solar Physics, 9, 3, doi: 10.12942/lrsp-2012-3
-
[51]
Wheatland, M. S., Melrose, D. B., & Mastrano, A. 2018, ApJ, 864, 159, doi: 10.3847/1538-4357/aad8ae
-
[52]
Wiegelmann, T., Thalmann, J. K., & Solanki, S. K. 2014, A&A Rv, 22, 78, doi: 10.1007/s00159-014-0078-7
-
[53]
Yadav, R., & Kazachenko, M. D. 2023, ApJ, 944, 215, doi: 10.3847/1538-4357/acaa9d
-
[54]
Yang, Y.-H., Hsieh, M.-S., Yu, H.-S., & Chen, P. F. 2017, ApJ, 834, 150, doi: 10.3847/1538-4357/834/2/150
-
[55]
2009, in Universal Heliophysical Processes, ed
Yashiro, S., & Gopalswamy, N. 2009, in Universal Heliophysical Processes, ed. N. Gopalswamy & D. F
work page 2009
-
[56]
257, 233–243, doi: 10.1017/S1743921309029342
Webb, Vol. 257, 233–243, doi: 10.1017/S1743921309029342
-
[57]
Howard, R. A. 2005, Journal of Geophysical Research (Space Physics), 110, A12S05, doi: 10.1029/2005JA011151
-
[58]
2012, NRIAG Journal of Astronomy and Geophysics, 1, 172, doi: 10.1016/j.nrjag.2012.12.014
Youssef, M. 2012, NRIAG Journal of Astronomy and Geophysics, 1, 172, doi: 10.1016/j.nrjag.2012.12.014
-
[59]
White, S. M. 2001, ApJ, 559, 452, doi: 10.1086/322405
-
[60]
Zirin, H., & Liggett, M. A. 1987, SoPh, 113, 267, doi: 10.1007/BF00147707
discussion (0)
Sign in with ORCID, Apple, or X to comment. Anyone can read and Pith papers without signing in.