The effect of a new power interconnector on energy prices volatility: the case of Sicily
Pith reviewed 2026-05-23 23:09 UTC · model grok-4.3
The pith
The Sorgente-Rizziconi interconnector increased price volatility in Sicily without lowering average prices or affecting other zones.
A machine-rendered reading of the paper's core claim, the machinery that carries it, and where it could break.
Core claim
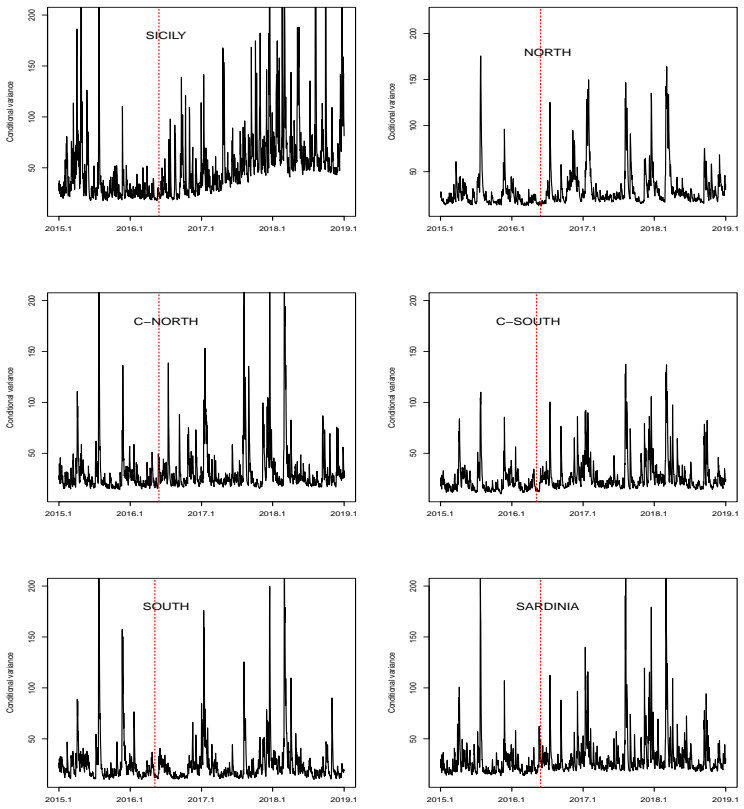
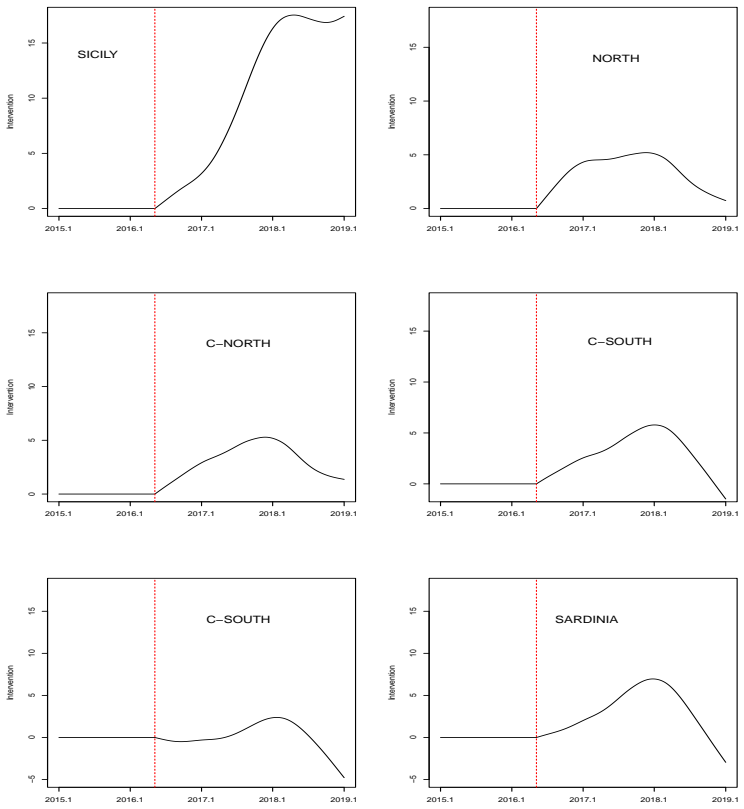
The new interconnector significantly increased price volatility in Sicily, without reducing average price levels. No significant effects were observed in other Italian market zones. The analysis used daily data from 2015 to 2018 and applied a semi-parametric GARCH model with a logistic intervention function to estimate changes in conditional price variance, with a fully non-parametric additive model as robustness check.
What carries the argument
Semi-parametric GARCH model with logistic intervention function to isolate the effect of the 28 May 2016 commissioning on conditional price variance.
If this is right
- Adding an interconnector does not necessarily reduce average electricity prices.
- Physical integration can increase price volatility in the newly connected zone.
- Effects of interconnectors are context-dependent and may not generalize across market zones.
- Energy policy should account for potential volatility increases when planning infrastructure investments.
Where Pith is reading between the lines
- Similar projects in other poorly connected regions could see volatility rises if local supply conditions differ from the mainland.
- Risk management strategies for electricity traders in Sicily may need adjustment post-integration.
- Further analysis could examine whether regulatory changes or market rules accompanied the physical link and influenced the outcome.
Load-bearing premise
That the timing and form of the intervention can be precisely captured by the logistic function so that the model attributes the volatility change specifically to the interconnector rather than other simultaneous factors.
What would settle it
Finding no volatility increase when re-estimating the model after adding controls for other events around May 2016 or when applying the same method to a control zone without an interconnector.
Figures


read the original abstract
Integrating energy islands into the European electricity market is a key challenge for the energy transition. This study investigates the impact of the Sorgente-Rizziconi interconnector on electricity price volatility in Sicily. Before its commissioning on 28 May 2016, the Sicilian electricity market zone was poorly interconnected with the Italian mainland. Using daily data from 2015 to 2018, the analysis applies a semi-parametric GARCH model with a logistic intervention function to estimate changes in conditional price variance. A fully non-parametric additive model is employed as a robustness check, allowing the data to shape volatility dynamics without imposing a predefined structure. The results reveal that the new interconnector significantly increased price volatility in Sicily, without reducing average price levels. No significant effects were observed in other Italian market zones. These findings highlight the context-dependent nature of infrastructure impacts and suggest that physical integration alone does not guarantee price stability. The results have important implications for energy policy, investment planning, and risk management in electricity markets.
Editorial analysis
A structured set of objections, weighed in public.
Referee Report
Summary. The paper investigates the causal impact of the Sorgente-Rizziconi interconnector (commissioned 28 May 2016) on Sicilian electricity price volatility using daily 2015–2018 data. It employs a semi-parametric GARCH model that incorporates a logistic intervention function to capture the shift in conditional variance, supplemented by a fully non-parametric additive model as a robustness check. The central claim is that the interconnector raised volatility in Sicily without lowering average price levels, with no analogous effects detected in other Italian market zones.
Significance. If the identification strategy holds, the result is significant for energy economics and infrastructure policy: it demonstrates that physical market integration can raise rather than dampen price volatility in an island context, underscoring the importance of complementary measures. The dual use of a semi-parametric GARCH with an explicit intervention term and a non-parametric additive model provides a useful robustness contrast that is not common in the literature.
major comments (2)
- [Methodology] Methodology section (logistic intervention term in the semi-parametric GARCH): the central claim attributes post-28 May 2016 shifts in conditional variance exclusively to the interconnector via the logistic function. This identification is load-bearing yet rests on the untested assumption that no Sicily-specific time-varying confounders (renewable penetration changes, demand shocks, or regulatory adjustments) coincide with the commissioning date; the paper provides no additional controls, event-study windows, or sensitivity checks to alternative transition dates or functional forms.
- [Results] Results section (placebo and robustness): while the absence of effects in other Italian zones is reported, the manuscript does not present falsification tests that vary the intervention timing within Sicily or compare pre-trends in volatility drivers; without these, the Sicily-specific causal interpretation cannot be distinguished from model assumptions about the logistic shape and transition window.
minor comments (2)
- [Abstract] Abstract: headline quantitative estimates (magnitude of volatility change, standard errors, or p-values) are omitted; including them would allow readers to assess economic significance immediately.
- [Methodology] Notation: the precise functional form of the logistic intervention (location, scale, and any interaction terms with the GARCH variance equation) should be written explicitly as an equation rather than described only in prose.
Simulated Author's Rebuttal
We thank the referee for the thoughtful and constructive comments on our manuscript. We address each major comment below and will incorporate additional robustness checks in the revised version.
read point-by-point responses
-
Referee: [Methodology] Methodology section (logistic intervention term in the semi-parametric GARCH): the central claim attributes post-28 May 2016 shifts in conditional variance exclusively to the interconnector via the logistic function. This identification is load-bearing yet rests on the untested assumption that no Sicily-specific time-varying confounders (renewable penetration changes, demand shocks, or regulatory adjustments) coincide with the commissioning date; the paper provides no additional controls, event-study windows, or sensitivity checks to alternative transition dates or functional forms.
Authors: We agree that the identification assumption is central and that additional checks would strengthen the analysis. The commissioning date was determined by the physical completion of the infrastructure project, which provides some exogeneity, but we acknowledge that concurrent Sicily-specific factors cannot be ruled out without further tests. In the revision we will add: (i) sensitivity analyses replacing the logistic intervention with a simple step function and with alternative transition windows centered on May 2016; (ii) explicit controls for renewable generation shares (wind and solar) and demand in the GARCH variance equation; and (iii) event-study style plots of volatility drivers around the commissioning date. The non-parametric additive model already relaxes the logistic functional-form assumption and yields qualitatively similar results. revision: yes
-
Referee: [Results] Results section (placebo and robustness): while the absence of effects in other Italian zones is reported, the manuscript does not present falsification tests that vary the intervention timing within Sicily or compare pre-trends in volatility drivers; without these, the Sicily-specific causal interpretation cannot be distinguished from model assumptions about the logistic shape and transition window.
Authors: We will add the requested falsification exercises. Specifically, we will estimate the model using placebo intervention dates both before (e.g., 2015) and after (e.g., late 2016) the true commissioning date within Sicily and report whether the volatility shift appears only at the actual date. We will also compare pre-2016 trends in volatility determinants (renewable penetration, demand volatility) between Sicily and the other zones to assess differential pre-trends. These tests will be presented in a new subsection of the results and will be used to qualify the causal interpretation. revision: yes
Circularity Check
No circularity: empirical estimation on external data with standard models
full rationale
The paper applies a semi-parametric GARCH model with logistic intervention and a non-parametric additive model to daily electricity price series from 2015-2018. No equations reduce a claimed prediction to a fitted parameter by construction, no load-bearing self-citations justify uniqueness or ansatzes, and the central volatility effect is estimated from observed data rather than defined into existence. The derivation chain is self-contained against external benchmarks and does not exhibit any of the enumerated circular patterns.
Axiom & Free-Parameter Ledger
Lean theorems connected to this paper
-
IndisputableMonolith/Cost/FunctionalEquation.leanwashburn_uniqueness_aczel unclear?
unclearRelation between the paper passage and the cited Recognition theorem.
σ²_t = ω + α ε²_{t-1} + β σ²_{t-1} + I(t0)·a/(1+b·exp(−c·t))
-
IndisputableMonolith/Foundation/RealityFromDistinction.leanreality_from_one_distinction unclear?
unclearRelation between the paper passage and the cited Recognition theorem.
ANOVA test comparing full vs reduced non-parametric model for intervention effect
What do these tags mean?
- matches
- The paper's claim is directly supported by a theorem in the formal canon.
- supports
- The theorem supports part of the paper's argument, but the paper may add assumptions or extra steps.
- extends
- The paper goes beyond the formal theorem; the theorem is a base layer rather than the whole result.
- uses
- The paper appears to rely on the theorem as machinery.
- contradicts
- The paper's claim conflicts with a theorem or certificate in the canon.
- unclear
- Pith found a possible connection, but the passage is too broad, indirect, or ambiguous to say the theorem truly supports the claim.
Reference graph
Works this paper leans on
-
[1]
Acemoglu, D., Chernozhukov, V., Kasy, M., and Duflo, E. (2017). Competition in electricity markets with renewable energy sources. The Energy Journal , 38:137--155. Accessed 5 June 2025
work page 2017
-
[2]
Amado, C. and Ter\"asvirta, T. (2013). Modelling volatility by variance decomposition. Journal of Econometrics , 175:142--143
work page 2013
-
[3]
Amado, C. and Ter\"asvirta, T. (2017). Specification and testing of multiplicative time-varying garch models with applications. Econometric Reviews , 36:421--446
work page 2017
-
[4]
Bernardi, M. and Lisi, F. (2020). Point and interval forecasting of zonal electricity prices and demand using heteroscedastic models: The ipex case. Energies , 13(23):6191
work page 2020
-
[5]
Bertolini, M., Buso, M., and Greco, L. (2020). Competition in smart distribution grids. Energy Policy , 145:111729
work page 2020
-
[6]
Cassetta, E., Nava, C. R., and Zoia, M. G. (2022). Eu electricity market integration and cross-country convergence in residential and industrial end-user prices. Energy Policy , 165:112934
work page 2022
-
[7]
Cleary, B., Duffy, A., Bach, B., Vitina, A., O’Connor, A., and Conlon, M. (2016). Estimating the electricity prices, generation costs and co2 emissions of large scale wind energy exports from ireland to great britain. Energy Policy , 91:38--48
work page 2016
-
[8]
Codegoni, A. (2016). Prezzi elettrici e caso Sicilia: ma il cavo Sorgente-Rizziconi funziona o no? Consultato il 2 giugno 2025
work page 2016
-
[9]
Creti, A., Fumagalli, E., and Fumagalli, E. (2010). Integration of electricity markets in europe: Relevant issues for italy. Energy Policy , 38(11):6966--6976. Energy Efficiency Policies and Strategies with regular papers
work page 2010
-
[10]
Denny, E., Tuohy, A., Meibom, P., Keane, A., Flynn, D., Mullane, A., and O’Malley, M. (2010). The impact of increased interconnection on electricity systems with large penetrations of wind generation: A case study of ireland and great britain. Energy Policy , 38(11):6946--6954. Energy Efficiency Policies and Strategies with regular papers
work page 2010
-
[11]
A., Wang, Y., Francis, C., Zobiri, F., Parra, D., and Papaemmanouil, A
Dudjak, V., Neves, D., Alskaif, T., Khadem, S., Pena-Bello, A., Saggese, P., Bowler, B., Andoni, M., Bertolini, M., Zhou, Y., Lormeteau, B., Mustafa, M. A., Wang, Y., Francis, C., Zobiri, F., Parra, D., and Papaemmanouil, A. (2021). Impact of local energy markets integration in power systems layer: A comprehensive review. Applied Energy , 301:117434
work page 2021
-
[12]
Entso‑e – building a clean and competitive power system for europe
ENTSO‑E (2025). Entso‑e – building a clean and competitive power system for europe. https://www.entsoe.eu/. Accessed: 2025‑07‑31
work page 2025
-
[13]
A policy framework for climate and energy in the period from 2020 to 2030
European Commission (2014). A policy framework for climate and energy in the period from 2020 to 2030. https://eur-lex.europa.eu/legal-content/EN/ALL/?uri=CELEX:52014DC0015
work page 2014
-
[14]
Commission communication: Grids, the missing link – an eu action plan for grids
European Commission (2023). Commission communication: Grids, the missing link – an eu action plan for grids. https://eur-lex.europa.eu/legal-content/EN/TXT/?uri=COM:2023:757:FIN
work page 2023
-
[15]
European Commission (2025). Electricity market design. https://energy.ec.europa.eu/topics/markets-and-consumers/electricity-market-design_en. Accessed: 27 July 2025
work page 2025
-
[16]
European Union Parliament (2018). Regulation (eu) 2018/1999 of the european parliament and of the council of 11 december 2018 on the governance of the energy union and climate action. https://eur-lex.europa.eu/legal-content/EN/TXT/PDF/?uri=CELEX:32018R1999
work page 2018
-
[17]
Directive (eu) 2024/1711 of the european parliament and of the council of 13 june 2024
European Union Parliament (2024). Directive (eu) 2024/1711 of the european parliament and of the council of 13 june 2024. Official Journal of the European Union
work page 2024
-
[18]
Fabra, N. (2023). Reforming european electricity markets: Lessons from the energy crisis. Energy Economics , 126:106963
work page 2023
-
[19]
Fischhendler, I., Nathan, D., and Boymel, D. (2015). Marketing renewable energy through geopolitics: Solar farms in israel. Global Environmental Politics , 15(2):98--120
work page 2015
-
[20]
Zonal electricity prices — market results
GME (2025). Zonal electricity prices — market results. https://www.mercatoelettrico.org/en-us/Home/Results/Electricity/MGP/Results/ZonalPrices. Accessed: 2025-07-29
work page 2025
-
[21]
Hastie, T., Tibshirani, R., and Friedman, J. (2001). The Elements of Statistical Learning: Data Mining, Inference, and Prediction . Springer
work page 2001
-
[22]
Jansen, M., Duffy, C., Green, T. C., and Staffell, I. (2022). Island in the sea: The prospects and impacts of an offshore wind power hub in the north sea. Advances in Applied Energy , 6:100090
work page 2022
-
[23]
C., Odabaşı, A., and Tiryaki, C
Karahan, C. C., Odabaşı, A., and Tiryaki, C. S. (2024). Wired together: Integration and efficiency in european electricity markets. Energy Economics , 133:107505
work page 2024
-
[24]
Lisi, F. and Pelagatti, M. M. (2018). Component estimation for electricity market data: Deterministic or stochastic? Energy Economics , 74:13--37
work page 2018
-
[25]
Lo Prete , C., Palmer, K., and Robertson, M. (2025). Time for a market upgrade? a review of wholesale electricity market designs for the future. Energy Economics , 148:108640
work page 2025
-
[26]
Lobato, E., Sigrist, L., and Rouco, L. (2017). Value of electric interconnection links in remote island power systems: The spanish canary and balearic archipelago cases. International Journal of Electrical Power & Energy Systems , 91:192--200
work page 2017
-
[27]
Álvaro Cartea and González-Pedraz, C. (2012). How much should we pay for interconnecting electricity markets? a real options approach. Energy Economics , 34(1):14--30
work page 2012
-
[28]
Malaguzzi Valeri , L. (2009). Welfare and competition effects of electricity interconnection between ireland and great britain. Energy Policy , 37(11):4679--4688
work page 2009
-
[29]
Meneguzzo, F., Ciriminna, R., Albanese, L., and Pagliaro, M. (2016). The remarkable impact of renewable energy generation in sicily onto electricity price formation in italy. Energy Science & Engineering , 4(3):194--204
work page 2016
-
[30]
National Grid (2013). Interconnectors. http://investors.nationalgrid.com/ /media/Files/N/National-Grid-IR/factsheets/interconnectors130214-v12.pdf. Accessed 21 July 2025
work page 2013
-
[31]
Newbery, D., Strbac, G., and Viehoff, I. (2016). The benefits of integrating european electricity markets. Energy Policy , 94:253--263
work page 2016
-
[32]
Electricity interconnectors factsheet
Ofgem (2014). Electricity interconnectors factsheet. https://www.ofgem.gov.uk/ofgem-publications/87961/electricityinterconnectorsfactsheet.pdf. Accessed 21 July 2025
work page 2014
-
[33]
Pean, E., Pirouti, M., and Qadrdan, M. (2016). Role of the gb-france electricity interconnectors in integration of variable renewable generation. Renewable Energy , 99:307--314
work page 2016
-
[34]
Pinilla, J. and Negr\'in, M. (2021). Non-parametric generalized additive models as a tool for evaluating policy interventions. Mathematics , 9:299
work page 2021
-
[35]
Proedrou, F. (2012). Re-conceptualising the energy and security complex in the eastern mediterranean. Cyprus Review , 24(2):15 – 28. Cited by: 8
work page 2012
-
[36]
Rettig, E., Fischhendler, I., and Schlecht, F. (2023). The meaning of energy islands: Towards a theoretical framework. Renewable and Sustainable Energy Reviews , 187:113732
work page 2023
-
[37]
Ries, J., Gaudard, L., and Romerio, F. (2016). Interconnecting an isolated electricity system to the european market: The case of malta. Utilities Policy , 40:1--14
work page 2016
-
[38]
Roques, F. (2021). The integration of european electricity markets--achievements to date and way forward. In Energy, COVID, and Climate Change, 1st IAEE Online Conference, June 7-9, 2021 . International Association for Energy Economics
work page 2021
-
[39]
Sapio, A. and Spagnolo, N. (2016). Price regimes in an energy island: Tacit collusion vs. cost and network explanations. Energy Economics , 55:157--172
work page 2016
-
[40]
Sapio, A. and Spagnolo, N. (2020). The effect of a new power cable on energy prices volatility spillovers. Energy Policy , 144:111488
work page 2020
-
[41]
Shortall, R. and Kharrazi, A. (2017). Cultural factors of sustainable energy development: A case study of geothermal energy in iceland and japan. Renewable and Sustainable Energy Reviews , 79:101--109
work page 2017
-
[42]
Terna S.p.A. (2016). L'energia che ci unisce: il "ponte dell'energia" tra Sicilia e Calabria . Technical report, Terna S.p.A. Consultato il 2 giugno 2025
work page 2016
-
[43]
Trovato, M. (2016). Ma l’elettrodotto Sorgente-Rizziconi fa risparmiare o no? Consultato il 2 giugno 2025
work page 2016
-
[44]
Tsaousoglou, G., Giraldo, J. S., and Paterakis, N. G. (2022). Market mechanisms for local electricity markets: A review of models, solution concepts and algorithmic techniques. Renewable and Sustainable Energy Reviews , 156:111890
work page 2022
-
[45]
Turvey, R. (2006). Interconnector economics. Energy Policy , 34(13):1457--1472
work page 2006
-
[46]
Warneryd, M. and Karltorp, K. (2022). Microgrid communities: disclosing the path to future system-active communities. Sustainable Futures , 4:100079
work page 2022
-
[47]
Weinhold, R. and Mieth, R. (2021). Power market tool (pomato) for the analysis of zonal electricity markets. SoftwareX , 16:100870
work page 2021
-
[48]
Yang, Y., Xia, S., Huang, P., and Qian, J. (2024). Energy transition: Connotations, mechanisms and effects. Energy Strategy Reviews , 52:101320
work page 2024
discussion (0)
Sign in with ORCID, Apple, or X to comment. Anyone can read and Pith papers without signing in.