Estimating the triaxiality of massive clusters from 2D observables in MillenniumTNG with machine learning
Pith reviewed 2026-05-17 04:25 UTC · model grok-4.3
The pith
A fusion neural network estimates the triaxial shapes and orientations of massive galaxy clusters from 2D images and member data.
A machine-rendered reading of the paper's core claim, the machinery that carries it, and where it could break.
Core claim
The paper demonstrates that a multi-modal network integrating convolutional and graph neural networks can extract three-dimensional triaxiality and orientation information for massive clusters from idealized two-dimensional observables in the MillenniumTNG simulations, yielding an R-squared score of 0.85 for major axis length regression and correctly classifying 71 percent of prolate clusters with line-of-sight elongations, which is a 30 percent improvement compared to spherical models.
What carries the argument
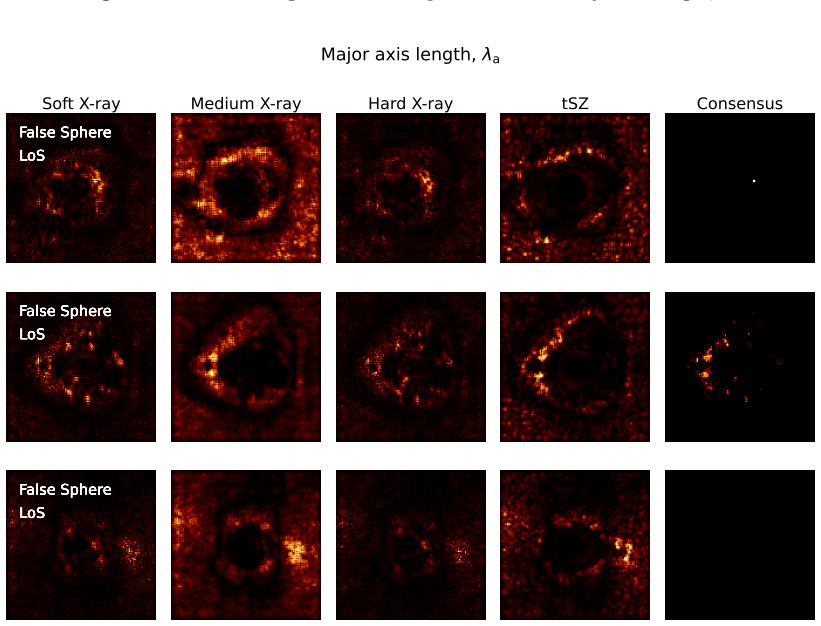
The multi-modal fusion network that uses a convolutional neural network to process multi-wavelength 2D cluster images and a graph neural network to handle mathematical graph representations of cluster member observables.
Load-bearing premise
The idealized 2D images and graph data generated from the simulations accurately represent the measurements obtainable from real galaxy clusters with current instruments.
What would settle it
Running the model on a sample of real observed clusters and checking if the predicted shapes match independent determinations from strong gravitational lensing or multi-wavelength tomography.
Figures


read the original abstract
Properties of massive galaxy clusters, such as mass abundance and concentration, are sensitive to cosmology, making cluster statistics a powerful tool for cosmological studies. However, favoring a more simplified, spherically symmetric model for galaxy clusters can lead to biases in the estimates of cluster properties. In this work, we present a deep-learning approach for estimating the triaxiality and orientations of massive galaxy clusters (those with masses $\gtrsim 10^{14}\,M_\odot h^{-1}$) from 2D observables. We utilize the flagship hydrodynamical volume of the suite of cosmological-hydrodynamical MillenniumTNG (MTNG) simulations as our ground truth. Our model combines the feature extracting power of a convolutional neural network (CNN) and the message passing power of a graph neural network (GNN) in a multi-modal, fusion network. Our model is able to extract 3D geometry information from 2D idealized cluster multi-wavelength images (soft X-ray, medium X-ray, hard X-ray and tSZ effect) and mathematical graph representations of 2D cluster member observables (line-of-sight radial velocities, 2D projected positions and V-band luminosities). Our network improves cluster geometry estimation in MTNG by $30\%$ compared to assuming spherical symmetry. We report an $R^2 = 0.85$ regression score for estimating the major axis length of triaxial clusters and correctly classifying $71\%$ of prolate clusters with elongated orientations along our line-of-sight.
Editorial analysis
A structured set of objections, weighed in public.
Referee Report
Summary. The manuscript presents a multi-modal deep learning model that fuses a convolutional neural network (CNN) operating on idealized 2D multi-wavelength images (soft/medium/hard X-ray and tSZ) with a graph neural network (GNN) on projected galaxy positions, line-of-sight velocities, and V-band luminosities. The model is trained and evaluated on massive clusters (M ≳ 10^14 M_⊙ h^{-1}) from the MillenniumTNG hydrodynamical simulations to infer 3D triaxial shapes and orientations, claiming a 30% improvement over spherical symmetry, an R² = 0.85 for major-axis length regression, and 71% accuracy in classifying prolate clusters aligned with the line of sight.
Significance. If the performance metrics generalize beyond the idealized simulation inputs, the work could reduce systematic biases in cluster mass and concentration estimates that arise from spherical assumptions, thereby strengthening cosmological constraints from cluster abundance and clustering statistics. The multi-modal CNN-GNN fusion and use of the large-volume MTNG suite are clear strengths that enable direct comparison to a spherical baseline without additional free parameters in the improvement metric.
major comments (2)
- Abstract and Methods: The central performance claims (30% improvement, R² = 0.85, 71% classification accuracy) are reported without any description of train/test splits, cross-validation procedure, or error bars on the metrics. This omission prevents verification that the quoted numbers reflect generalization rather than overfitting to the specific MTNG realization.
- Abstract: The idealized 2D images and graph representations contain no modeling of instrumental effects (PSF convolution, noise, foreground subtraction, or selection biases) that would be present in Chandra, XMM-Newton, or eROSITA data. Because the improvement metric is defined relative to spherical symmetry on these clean inputs, it is unclear whether the quoted gains survive realistic observational systematics.
minor comments (2)
- The mass threshold is written as ≳ 10^{14} M_⊙ h^{-1}; consistent use of the same notation throughout the text would improve readability.
- The abstract refers to 'mathematical graph representations' without specifying the exact node and edge features; a brief enumeration in the main text would clarify the GNN input construction.
Simulated Author's Rebuttal
We thank the referee for their constructive and insightful comments, which have helped us identify areas where the manuscript can be clarified and strengthened. We provide point-by-point responses to the major comments below and indicate the revisions we will implement.
read point-by-point responses
-
Referee: Abstract and Methods: The central performance claims (30% improvement, R² = 0.85, 71% classification accuracy) are reported without any description of train/test splits, cross-validation procedure, or error bars on the metrics. This omission prevents verification that the quoted numbers reflect generalization rather than overfitting to the specific MTNG realization.
Authors: We agree that the absence of explicit details on data partitioning and validation in the Abstract (and insufficient emphasis in the main text) makes it difficult to assess generalization. The manuscript Methods section does describe a random split of the MTNG cluster sample into training and test sets with no overlap, but we did not report cross-validation folds or uncertainty estimates on the metrics. In the revised manuscript we will (i) add a concise statement to the Abstract summarizing the splitting procedure and (ii) include error bars on all quoted metrics obtained via bootstrap resampling of the test set. These changes will directly address the concern about overfitting versus generalization. revision: yes
-
Referee: Abstract: The idealized 2D images and graph representations contain no modeling of instrumental effects (PSF convolution, noise, foreground subtraction, or selection biases) that would be present in Chandra, XMM-Newton, or eROSITA data. Because the improvement metric is defined relative to spherical symmetry on these clean inputs, it is unclear whether the quoted gains survive realistic observational systematics.
Authors: The referee is correct that the current results are obtained on idealized, noise-free inputs; this was an intentional first step to quantify the maximum information content extractable from the multi-wavelength and galaxy observables. We do not assert that the precise numerical gains will persist once realistic observational effects are included. In the revised manuscript we will add a dedicated paragraph in the Discussion section that (a) explicitly acknowledges this limitation, (b) discusses the likely directions in which performance may degrade, and (c) outlines planned follow-up work that will incorporate mock observations with PSF, noise, and selection effects. This revision will make the scope and limitations of the present study transparent. revision: partial
Circularity Check
No significant circularity; standard supervised ML on simulation ground truth
full rationale
The paper trains a multi-modal CNN-GNN network on idealized 2D multi-wavelength images and projected member graphs extracted from MTNG hydrodynamical simulations to regress 3D triaxiality parameters and classify orientations. Reported performance (30% improvement over spherical symmetry baseline, R^2=0.85 for major-axis length, 71% prolate LOS classification) is measured against an independent external baseline rather than any fitted input or self-defined quantity. No load-bearing self-citations, uniqueness theorems, or ansatzes are invoked; the derivation is a conventional supervised regression task whose outputs are not equivalent to its inputs by construction. The setup is self-contained against the simulation benchmark.
Axiom & Free-Parameter Ledger
axioms (1)
- domain assumption MillenniumTNG hydrodynamical simulations provide accurate 3D ground-truth triaxiality and orientations for massive clusters.
Lean theorems connected to this paper
-
IndisputableMonolith/Foundation/AlexanderDuality.leanalexander_duality_circle_linking unclear?
unclearRelation between the paper passage and the cited Recognition theorem.
Our model combines the feature extracting power of a convolutional neural network (CNN) and the message passing power of a graph neural network (GNN) in a multi-modal, fusion network... R² = 0.85 regression score for estimating the major axis length
-
IndisputableMonolith/Foundation/RealityFromDistinction.leanreality_from_one_distinction unclear?
unclearRelation between the paper passage and the cited Recognition theorem.
We utilize the flagship hydrodynamical volume of the suite of cosmological-hydrodynamical MillenniumTNG (MTNG) simulations as our ground truth.
What do these tags mean?
- matches
- The paper's claim is directly supported by a theorem in the formal canon.
- supports
- The theorem supports part of the paper's argument, but the paper may add assumptions or extra steps.
- extends
- The paper goes beyond the formal theorem; the theorem is a base layer rather than the whole result.
- uses
- The paper appears to rely on the theorem as machinery.
- contradicts
- The paper's claim conflicts with a theorem or certificate in the canon.
- unclear
- Pith found a possible connection, but the passage is too broad, indirect, or ambiguous to say the theorem truly supports the claim.
Reference graph
Works this paper leans on
-
[1]
Allen, S. W., Evrard, A. E., & Mantz, A. B. 2011, Annual Review of Astronomy and Astrophysics, 49, 409
work page 2011
-
[2]
Allgood, B., Flores, R. A., Primack, J. R., et al. 2006, MNRAS, 367, 1781
work page 2006
-
[3]
Angulo, R. E., Springel, V., White, S. D. M., et al. 2012, MNRAS, 426, 2046
work page 2012
-
[4]
Bahcall, N. A. 1988, Annual Review of Astronomy and Astrophysics, 26, 631
work page 1988
- [5]
- [6]
-
[7]
N., Umetsu, K., Sereno, M., et al
Chiu, I. N., Umetsu, K., Sereno, M., et al. 2018, The Astrophysical Journal, doi:10.3847/1538-4357/aac4a0
-
[8]
Corless, V. L., & King, L. J. 2007, MNRAS, 380, 149 —. 2008, MNRAS, 390, 997 de Andres, D., Cui, W., Ruppin, F., et al. 2022, Nature Astronomy, 6, 1325
work page 2007
-
[9]
M., Hadzhiyska, B., Bose, S., et al
Delgado, A. M., Hadzhiyska, B., Bose, S., et al. 2023, MNRAS, 523, 5899
work page 2023
- [10]
-
[11]
Diemer, B., & Kravtsov, A. V. 2014, ApJ, 789, 1
work page 2014
-
[12]
P., Zhang, Y., Song, J., et al
Dietrich, J. P., Zhang, Y., Song, J., et al. 2014, MNRAS, 443, 1713
work page 2014
-
[13]
Dodelson, S., & Schmidt, F. 2020, Modern Cosmology, doi:10.1016/C2017-0-01943-2
-
[14]
Dubinski, J., & Carlberg, R. G. 1991, The Astrophysical Journal, 378, 496
work page 1991
-
[15]
2001, The Astronomical Journal, 122, 2222
Andernach, H. 2001, The Astronomical Journal, 122, 2222
work page 2001
- [16]
-
[17]
Feroz, F., & Hobson, M. P. 2012, MNRAS, 420, 596
work page 2012
-
[18]
E(n) equivariant graph neural networks, 2022
Foster, A. R., Ji, L., Smith, R. K., & Brickhouse, N. S. 2012, ApJ, 756, 128 Garcia Satorras, V., Hoogeboom, E., & Welling, M. 2021, arXiv e-prints, arXiv:2102.09844
-
[19]
B., Ntampaka, M., Nagai, D., et al
Green, S. B., Ntampaka, M., Nagai, D., et al. 2019, The Astrophysical Journal, 884, 33
work page 2019
- [20]
- [21]
-
[22]
Herbonnet, R., Crawford, A., Avestruz, C., et al. 2022, MNRAS, 513, 2178
work page 2022
-
[23]
M., Mandelbaum, R., Ishak, M., et al
Hirata, C. M., Mandelbaum, R., Ishak, M., et al. 2007, MNRAS, 381, 1197
work page 2007
- [24]
-
[25]
Ho, M., Rau, M. M., Ntampaka, M., et al. 2019, The Astrophysical Journal, 887, 25
work page 2019
- [26]
-
[27]
Jiang, F., & van den Bosch, F. C. 2016, MNRAS, 458, 2848
work page 2016
- [28]
-
[29]
2024, Astronomy & Astrophysics, doi:10.1051/0004-6361/202347399
Kim, J., Sayers, J., Sereno, M., et al. 2024, Astronomy & Astrophysics, doi:10.1051/0004-6361/202347399
-
[30]
Adam: A Method for Stochastic Optimization
Kingma, D. P., & Ba, J. 2017, Adam: A Method for Stochastic Optimization, arXiv:1412.6980
work page internal anchor Pith review Pith/arXiv arXiv 2017
- [31]
-
[32]
Lau, E. T., Hearin, A. P., Nagai, D., & Cappelluti, N. 2021, MNRAS, 500, 1029
work page 2021
- [33]
-
[34]
2004, The Astrophysical Journal, doi:10.1086/380506
Lee, J., & Suto, Y. 2004, The Astrophysical Journal, doi:10.1086/380506
-
[35]
2013, Space Science Reviews, doi:10.1007/s11214-013-9980-y
Limousin, M., Morandi, A., Sereno, M., et al. 2013, Space Science Reviews, doi:10.1007/s11214-013-9980-y
-
[36]
L., Charnock, T., Lemos, P., et al
Makinen, T. L., Charnock, T., Lemos, P., et al. 2022, The Open Journal of Astrophysics, 5, 18
work page 2022
- [37]
-
[38]
Mantz, A. B., Allen, S. W., Morris, R. G., et al. 2016, MNRAS, 463, 3582
work page 2016
-
[39]
Marinacci, F., Vogelsberger, M., Pakmor, R., et al. 2018, MNRAS, 480, 5113
work page 2018
-
[40]
Maughan, B. J. 2007, ApJ, 668, 772 22
work page 2007
-
[41]
Meneghetti, M., Rasia, E., Merten, J., et al. 2010, A&A, 514, A93
work page 2010
- [42]
-
[43]
Murata, R., Nishimichi, T., Takada, M., et al. 2018, ApJ, 854, 120
work page 2018
-
[44]
P., Pillepich, A., Springel, V., et al
Naiman, J. P., Pillepich, A., Springel, V., et al. 2018, MNRAS, 477, 1206
work page 2018
-
[45]
Nelson, D., Pillepich, A., Springel, V., et al. 2018, MNRAS, 475, 624 —. 2019a, MNRAS, 490, 3234
work page 2018
-
[46]
Ntampaka, M., ZuHone, J., Eisenstein, D., et al. 2019, ApJ, 876, 82
work page 2019
-
[47]
Oguri, M., & Blandford, R. D. 2009, MNRAS, 392, 930
work page 2009
-
[48]
Pakmor, R., G´ omez, F. A., Grand, R. J. J., et al. 2017, MNRAS, 469, 3185
work page 2017
- [49]
-
[50]
2008, The Astrophysical Journal, 676, 206
Papovich, C. 2008, The Astrophysical Journal, 676, 206
work page 2008
-
[51]
2019, MNRAS, 490, 3196 Planck Collaboration, Ade, P
Pillepich, A., Nelson, D., Springel, V., et al. 2019, MNRAS, 490, 3196 Planck Collaboration, Ade, P. A. R., Aghanim, N., et al. 2016, A&A, 594, A13
work page 2019
-
[52]
2013, The Astronomical Review, 8, 40
Rasia, E., Meneghetti, M., & Ettori, S. 2013, The Astronomical Review, 8, 40
work page 2013
-
[53]
Rozo, E., Rykoff, E. S., Bartlett, J. G., & Melin, J.-B. 2015, MNRAS, 450, 592
work page 2015
-
[54]
Saro, A., Mohr, J. J., Bazin, G., & Dolag, K. 2013, ApJ, 772, 47
work page 2013
- [55]
-
[56]
2017, Monthly Notices of the Royal Astronomical Society, doi:10.1093/mnras/stx326
Sereno, M., Ettori, S., Meneghetti, M., et al. 2017, Monthly Notices of the Royal Astronomical Society, doi:10.1093/mnras/stx326
- [57]
-
[58]
2018, The Astrophysical Journal Letters, doi:10.3847/2041-8213/aac6d9
Sereno, M., Umetsu, K., Ettori, S., et al. 2018, The Astrophysical Journal Letters, doi:10.3847/2041-8213/aac6d9
-
[59]
Shao, H., Villaescusa-Navarro, F., Villanueva-Domingo, P., et al. 2023, ApJ, 944, 27
work page 2023
-
[60]
2025, The Astrophysical Journal, 985, 212
Soltis, J., Ntampaka, M., Diemer, B., et al. 2025, The Astrophysical Journal, 985, 212
work page 2025
- [61]
-
[62]
Springel, V., Pakmor, R., Zier, O., & Reinecke, M. 2021, MNRAS, 506, 2871
work page 2021
-
[63]
Springel, V., Pakmor, R., Pillepich, A., et al. 2018, MNRAS, 475, 676
work page 2018
-
[64]
Sunyaev, R. A., & Zeldovich, Y. B. 1972, Comments on Astrophysics and Space Physics, 4, 173
work page 1972
-
[65]
Tinker, J. L., Sheldon, E. S., Wechsler, R. H., et al. 2012, The Astrophysical Journal, 745, 16
work page 2012
-
[66]
2018, The Astrophysical Journal, doi:10.3847/1538-4357/aac3d9
Umetsu, K., Sereno, M., Tam, S.-I., et al. 2018, The Astrophysical Journal, doi:10.3847/1538-4357/aac3d9
- [67]
- [68]
- [69]
-
[70]
Weinberger, R., Springel, V., Hernquist, L., et al. 2017, MNRAS, 465, 3291
work page 2017
-
[71]
Willis, J. P., Clerc, N., Bremer, M. N., et al. 2013, Monthly Notices of the Royal Astronomical Society, 430, 134
work page 2013
-
[72]
Wong, K.-W., & Taylor, J. E. 2012, ApJ, 757, 102
work page 2012
-
[73]
Wu, J. F., & Kragh Jespersen, C. 2023, arXiv e-prints, arXiv:2306.12327
-
[74]
McCarthy, I. G. 2020, Monthly Notices of the Royal Astronomical Society, 499, 3445
work page 2020
-
[75]
McCarthy, I. G. 2020, MNRAS, 499, 3445
work page 2020
-
[76]
Yang, X., Mo, H. J., Jing, Y. P., & van den Bosch, F. C. 2005, Monthly Notices of the Royal Astronomical Society, 358, 217
work page 2005
-
[77]
Simulating X-ray Observations with Python
ZuHone, J. A., Biffi, V., Hallman, E. J., et al. 2014, arXiv e-prints, arXiv:1407.1783 23 APPENDIX A.RESULTS FOR 31 MODELS ABLATION STUDY We present the figure showing results from the full ab- lation study, which consisted of 31 models with different combinations of our training variables. B.INDIVIDUAL SALIENCY MAPS The saliency maps in this appendix sho...
work page internal anchor Pith review Pith/arXiv arXiv 2014
discussion (0)
Sign in with ORCID, Apple, or X to comment. Anyone can read and Pith papers without signing in.