Expansion kinematics of young clusters. III. The kiloparsec sample
Pith reviewed 2026-05-10 17:16 UTC · model grok-4.3
The pith
Most young star clusters formed with significant spatial and kinematic substructure instead of as dense monolithic objects.
A machine-rendered reading of the paper's core claim, the machinery that carries it, and where it could break.
Core claim
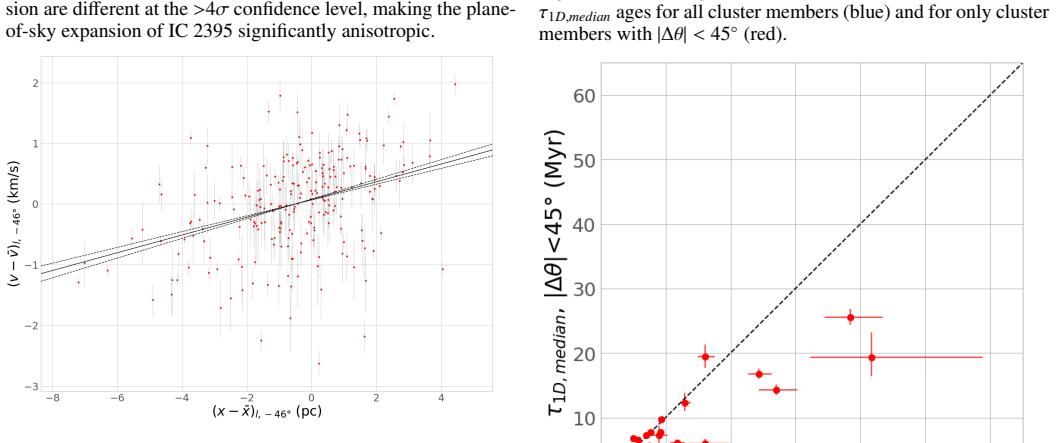
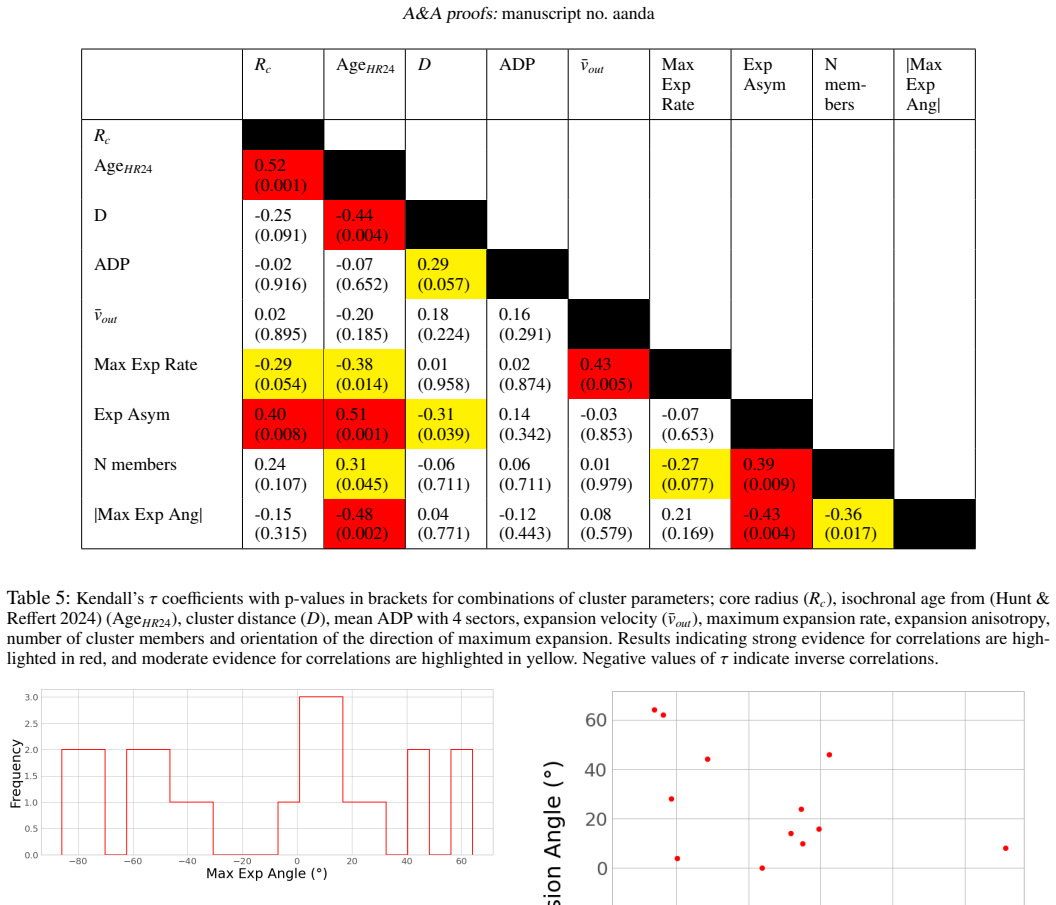
The high degree of spatial structure and significant expansion anisotropy imply that the majority of these young clusters have formed with significant spatial and kinematic substructure and not as dense, monolithic clusters. Most clusters exhibit plane-of-sky expansion that is often anisotropic even at ages greater than 30 Myr, with older clusters tending to align maximum expansion directions closer to the Galactic plane. Kinematic ages from expansion timescales agree with isochronal ages for clusters younger than 10 Myr but are significantly younger for many older systems.
What carries the argument
Plane-of-sky expansion measurements from Gaia DR3 astrometry combined with radial velocities, quantified via Q-Parameter for spatial structure and Angular Dispersion Parameter for anisotropy.
If this is right
- Hierarchical structure can persist in cluster outskirts for more than 10 Myr while centers smooth out through dynamical interactions.
- Directions of maximum expansion in older clusters align more closely with the Galactic plane.
- Kinematic ages from traceback and expansion timescales match isochronal ages only for clusters younger than 10 Myr.
- Many clusters with isochronal ages above 10 Myr show significantly younger kinematic ages, consistent with a prolonged embedded phase.
Where Pith is reading between the lines
- If substructure is the norm, models of star formation should prioritize hierarchical fragmentation over monolithic collapse scenarios.
- Discrepancies between kinematic and isochronal ages may point to systematic underestimation of early cluster lifetimes in standard stellar evolution tracks.
- Extending these measurements to more distant clusters could test whether the same substructure patterns hold at larger scales.
Load-bearing premise
The observed plane-of-sky expansion signatures and structural measures primarily trace initial formation conditions rather than later dynamical evolution, Galactic tides, or biases in membership selection and age estimation.
What would settle it
Detection of isotropic expansion or uniform structure across the full sample of clusters older than 10 Myr would undermine the inference of widespread initial substructure.
Figures


read the original abstract
We combine Gaia DR3 5-parameter astrometry with calibrated radial velocities for 23 nearby (<1 kpc) young (<60 Myr) clusters, with membership lists from Cantat-Gaudin et al. (2020). We characterise the plane-of-sky structure of the clusters using Q-Parameter and Angular Dispersion Parameter (ADP) methods. We measure plane-of-sky expansion using several methods. We determine plane-of-sky orientations along which expansion is maximised. We also estimate expansion timescales and traceback ages and compare to isochronal ages. We then look for correlations between cluster properties and discuss sample-wide trends. We find that most young clusters are more smoothly structured in their centers where the rate of dynamical interactions is highest, while hierarchical structure can survive in the sparse outskirts for >10 Myr. We also find that the majority of nearby young clusters exhibit clear signatures of expansion in the plane-of-sky, which in many cases is significantly anisotropic, even at ages >30 Myr. We find evidence that older clusters tend to have directions of maximum expansion oriented closer to parallel with the Galactic plane. The high degree of spatial structure and significant expansion anisotropy imply that the majority of these young clusters have formed with significant spatial and kinematic substructure and not as dense, monolithic clusters. Kinematic ages estimated from expansion timescales and on-sky traceback are generally in good agreement with estimates inferred from stellar evolution models for clusters <10 Myr old. However, many clusters with older isochronal ages appear to have significantly younger kinematic ages. We discuss potential reasons for this discrepancy, including a prolonged embedded and/or gravitationally bound phase in the early stages of the clusters.
Editorial analysis
A structured set of objections, weighed in public.
Referee Report
Summary. The manuscript analyzes the plane-of-sky structure and expansion kinematics of 23 young clusters (<60 Myr, <1 kpc) using Gaia DR3 5-parameter astrometry combined with calibrated radial velocities and membership lists from Cantat-Gaudin et al. (2020). It characterizes spatial structure via the Q-parameter and Angular Dispersion Parameter (ADP), measures plane-of-sky expansion with multiple methods, determines orientations of maximum expansion, estimates expansion timescales and traceback ages, and compares these to isochronal ages. Key results include smoother central structure with retained hierarchical structure in outskirts, clear anisotropic expansion in most clusters (persisting >30 Myr), a tendency for older clusters to have maximum expansion aligned parallel to the Galactic plane, generally good agreement between kinematic and isochronal ages for clusters <10 Myr but younger kinematic ages for older clusters, and the inference that these features indicate formation with significant spatial and kinematic substructure rather than as dense monolithic clusters.
Significance. If the attribution of observed anisotropy and structure to primordial conditions holds after accounting for dynamical evolution, this work would offer valuable empirical support for hierarchical formation models of star clusters over monolithic collapse scenarios. The reliance on publicly available Gaia DR3 data and external membership catalogs is a strength, promoting reproducibility and allowing direct tests by the community. The reported age discrepancies and structural trends provide concrete observables for future N-body simulations of cluster evolution in the Galactic potential.
major comments (2)
- [Abstract and Discussion] Abstract (final paragraph) and Discussion: The load-bearing claim that 'the high degree of spatial structure and significant expansion anisotropy imply that the majority of these young clusters have formed with significant spatial and kinematic substructure and not as dense, monolithic clusters' is not fully supported. The paper reports that older clusters (>30 Myr) show directions of maximum expansion preferentially aligned parallel to the Galactic plane, a known signature of tidal torques and differential rotation. Without explicit comparison to N-body models of initially monolithic clusters evolved under the Milky Way potential or quantitative subtraction of expected tidal velocity fields from the measured expansions, the anisotropy cannot be unambiguously attributed to initial conditions rather than post-formation processing.
- [Results] Results section: The abstract and summary describe clear trends in expansion anisotropy and structure but provide no quantitative statistics (e.g., fractions of clusters with significant anisotropy, correlation coefficients, or p-values), error bars on expansion rates or ADP/Q values, or details on how systematics in membership selection and age estimation were handled. This weakens assessment of whether the data robustly support the sample-wide conclusions.
minor comments (2)
- [Methods] Clarify the precise implementation details of the Q-parameter and ADP methods, including any parameter choices, radial weighting, or calibrations against simulations, to ensure reproducibility.
- [Figures and Tables] Add error bars or uncertainty estimates to all reported expansion timescales, traceback ages, and orientation angles in tables and figures; ensure figure legends explicitly define symbols and distinguish between different measurement methods.
Simulated Author's Rebuttal
We thank the referee for their constructive and detailed report. We address each major comment below, revising the manuscript where the points identify areas for improvement while maintaining the core observational results.
read point-by-point responses
-
Referee: [Abstract and Discussion] Abstract (final paragraph) and Discussion: The load-bearing claim that 'the high degree of spatial structure and significant expansion anisotropy imply that the majority of these young clusters have formed with significant spatial and kinematic substructure and not as dense, monolithic clusters' is not fully supported. The paper reports that older clusters (>30 Myr) show directions of maximum expansion preferentially aligned parallel to the Galactic plane, a known signature of tidal torques and differential rotation. Without explicit comparison to N-body models of initially monolithic clusters evolved under the Milky Way potential or quantitative subtraction of expected tidal velocity fields from the measured expansions, the anisotropy cannot be unambiguously attributed to initial conditions rather than post-formation processing.
Authors: We agree that the attribution of anisotropy to primordial conditions would be strengthened by direct N-body comparisons, which are not performed here. In the revised manuscript we have tempered the language in the abstract and discussion to state that the observations are 'consistent with' formation in a substructured state rather than implying it definitively. We have added a dedicated paragraph noting the Galactic-plane alignment in older clusters as a possible tidal signature and explicitly stating that future simulations are needed to separate initial conditions from post-formation evolution. We retain the claim as an interpretation because the anisotropy appears across the full age range (including clusters <10 Myr where tidal processing is limited) and is accompanied by surviving hierarchical structure in the outskirts, features not obviously produced by tides alone. revision: partial
-
Referee: [Results] Results section: The abstract and summary describe clear trends in expansion anisotropy and structure but provide no quantitative statistics (e.g., fractions of clusters with significant anisotropy, correlation coefficients, or p-values), error bars on expansion rates or ADP/Q values, or details on how systematics in membership selection and age estimation were handled. This weakens assessment of whether the data robustly support the sample-wide conclusions.
Authors: We accept that the presentation of results can be made more quantitative. The revised manuscript now includes: (i) error bars on all reported expansion rates, Q-parameters, and ADP values derived from bootstrap resampling and membership probability weighting; (ii) the fraction of clusters showing statistically significant anisotropy (expansion rate ratio >2 with combined uncertainty <1); (iii) Spearman rank correlation coefficients and p-values for trends between anisotropy, structure parameters, and cluster age; and (iv) an expanded methods subsection detailing how uncertainties from the Cantat-Gaudin et al. (2020) membership lists and isochronal age errors are propagated into the kinematic age comparisons. revision: yes
- Direct quantitative comparison to N-body simulations of initially monolithic clusters evolved in the Milky Way potential, which lies outside the scope of this observational study.
Circularity Check
No significant circularity detected; derivation relies on independent data processing
full rationale
The paper computes structural parameters (Q-parameter, ADP) and plane-of-sky expansion metrics directly from Gaia DR3 astrometry combined with external membership lists (Cantat-Gaudin et al. 2020). Expansion timescales, traceback ages, and comparisons to isochronal ages are calculated from observed positions/velocities without fitting a parameter to a data subset and then re-using it as a 'prediction.' The central inference about primordial substructure is an interpretive conclusion drawn from the measured trends (including age-dependent alignment with the Galactic plane), not a mathematical identity or self-referential definition. Any self-citations to prior work by the same authors are not load-bearing for the core results, as the present analysis stands on public data and standard methods. No step reduces by construction to its own inputs.
Axiom & Free-Parameter Ledger
axioms (2)
- domain assumption Gaia DR3 5-parameter astrometry and calibrated radial velocities accurately represent the positions, proper motions, and velocities of stars in the selected clusters
- domain assumption Membership lists from Cantat-Gaudin et al. (2020) correctly identify cluster members without significant contamination or incompleteness
Forward citations
Cited by 1 Pith paper
-
Dynamical Cluster Assembly Framework (D-CAF): The Link Between Star Cluster Formation and Expansion Rates
D-CAF simulations show that ongoing gas collapse during star formation shortens stellar crossing times, rendering gas expulsion more adiabatic and thereby regulating the survival and expansion rates of young stellar systems.
Reference graph
Works this paper leans on
-
[1]
Armstrong, J. J. & Tan, J. C. 2024, A&A, 692, A166 Armstrong, J. J., Tan, J. C., Wright, N. J., et al. 2025, MNRAS, 543, 2349 Armstrong, J. J., Wright, N. J., Je ff ries, R. D., & Jackson, R. J. 2020, MNRAS, 494, 4794 Armstrong, J. J., Wright, N. J., Jeff ries, R. D., Jackson, R. J., & Cantat-Gaudin, T. 2022, MNRAS, 517, 5704 Arnold, B. & Wright, N. J. 20...
-
[2]
Then the best-fitting linear gradient (by least squares) for each is plotted in the same colour. In the legend is given the expan- sion timescale corresponding to each gradient, the lowest (for the maximum expansion rate) in bold. The lower row seems to be the case that applies for many of the clusters in the sample analysed in this paper, where the Trace...
work page 1977
discussion (0)
Sign in with ORCID, Apple, or X to comment. Anyone can read and Pith papers without signing in.