ShadeBench: A Benchmark Dataset for Building Shade Simulation in Sustainable Society
Pith reviewed 2026-05-21 06:56 UTC · model grok-4.3
The pith
ShadeBench supplies a multimodal dataset of urban scenes with simulated shade maps, satellite imagery, and 3D building models to support shade analysis tasks.
A machine-rendered reading of the paper's core claim, the machinery that carries it, and where it could break.
Core claim
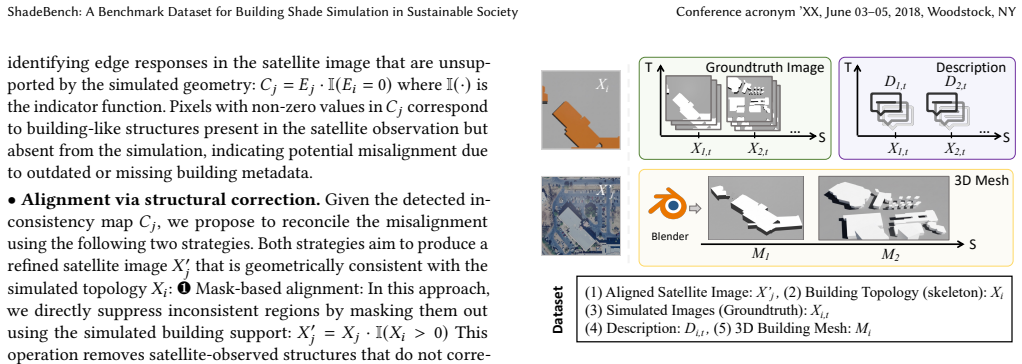
ShadeBench is a comprehensive multimodal dataset and benchmark containing geographically diverse urban scenes with temporally varying simulated shade maps and textual descriptions, together with aligned satellite imagery, building skeleton representations, and 3D building meshes; it supports downstream tasks of shade generation, shade segmentation, and 3D building reconstruction while providing standardized evaluation protocols and baseline methods.
What carries the argument
ShadeBench dataset, a collection that aligns simulated shade maps with satellite imagery and 3D building data to enable joint evaluation of shade-related vision tasks.
Load-bearing premise
Computer-generated shade maps accurately reflect the real fine-scale shade cast by actual buildings on pedestrians without any direct physical measurements to check the simulations.
What would settle it
Collect on-site shade and temperature readings at multiple times of day in several cities covered by the dataset and measure how closely they match the provided simulated shade maps.
Figures


read the original abstract
Urban heat exposure is becoming an increasingly critical challenge due to the intensifying urban heat island effect. Fine-grained shade patterns, especially those induced by urban buildings, strongly influence pedestrians' thermal exposure and outdoor activity planning. However, accurately modeling and analyzing urban shade at scale remains difficult because of the lack of large-scale datasets and systematic evaluation frameworks. To address this challenge, we present ShadeBench, a comprehensive dataset and benchmark for urban shade understanding. ShadeBench contains geographically diverse urban scenes with temporally varying simulated shade maps and textual descriptions, together with aligned satellite imagery, building skeleton representations, and 3D building meshes. Built upon this multimodal dataset, ShadeBench supports a range of downstream tasks, including shade generation, shade segmentation, and 3D building reconstruction. We further establish standardized evaluation protocols and baseline methods for these tasks. By enabling scalable and fine-grained shade analysis, ShadeBench provides a foundation for data-driven urban climate research and supports future studies in heat-resilient urban planning and decision-making. The code and dataset are publicly available at https://darl-genai.github.io/shadebench/.
Editorial analysis
A structured set of objections, weighed in public.
Referee Report
Summary. The paper presents ShadeBench, a multimodal dataset and benchmark for urban shade understanding consisting of geographically diverse urban scenes with temporally varying simulated shade maps, textual descriptions, aligned satellite imagery, building skeleton representations, and 3D building meshes. It supports downstream tasks including shade generation, shade segmentation, and 3D building reconstruction, along with standardized evaluation protocols and baseline methods. The code and dataset are released publicly.
Significance. If the simulated shade maps prove accurate, the dataset could provide a useful foundation for scalable, data-driven analysis of urban heat exposure and heat-resilient planning. The public release of code and data, together with support for multiple aligned modalities and tasks, strengthens its potential utility in computer vision and urban climate applications.
major comments (2)
- [Abstract and Dataset Construction] The abstract and dataset description assert that the simulated shade maps accurately represent fine-grained shade patterns induced by buildings for pedestrian thermal exposure analysis, yet no details are provided on the simulation method (ray-tracing, radiosity, or otherwise), its parameters, or any post-simulation validation against physical measurements such as pyranometer readings, time-lapse imagery, or on-site shade surveys at matching locations and timestamps. This is load-bearing for the central claim that ShadeBench supports reliable downstream tasks in urban thermal analysis.
- [Evaluation Protocols and Baselines] The soundness of the supported tasks (shade generation, segmentation, 3D reconstruction) depends on the fidelity of the shade maps; without reported error analysis, quantitative comparison to ground truth, or sensitivity tests for shadow boundaries and penumbra effects, systematic biases could propagate into all benchmark results and baselines.
minor comments (2)
- [Dataset Description] Clarify the geographic coverage, temporal sampling density, and alignment procedure between shade maps, satellite imagery, and 3D meshes to aid reproducibility.
- [Discussion or Conclusion] Add explicit discussion of limitations, including any assumptions in the simulation (e.g., material reflectance, atmospheric conditions) and plans for future real-world validation.
Simulated Author's Rebuttal
We are grateful to the referee for their constructive comments, which have helped us identify areas where the manuscript can be improved. We provide point-by-point responses to the major comments below.
read point-by-point responses
-
Referee: [Abstract and Dataset Construction] The abstract and dataset description assert that the simulated shade maps accurately represent fine-grained shade patterns induced by buildings for pedestrian thermal exposure analysis, yet no details are provided on the simulation method (ray-tracing, radiosity, or otherwise), its parameters, or any post-simulation validation against physical measurements such as pyranometer readings, time-lapse imagery, or on-site shade surveys at matching locations and timestamps. This is load-bearing for the central claim that ShadeBench supports reliable downstream tasks in urban thermal analysis.
Authors: We agree with the referee that additional details on the shade simulation method and its validation are necessary to support the dataset's use in urban thermal analysis. In the revised manuscript, we will expand the 'Dataset Construction' section to describe the simulation method in detail, including the use of a custom ray-tracing engine based on building 3D meshes and solar position calculations derived from timestamps. We will also specify key parameters such as the number of rays per pixel and assumed surface albedos. Regarding validation, we will include a discussion of the simulation's fidelity by referencing established literature on urban shadow modeling and provide qualitative comparisons with satellite-derived shade indicators where available. We will revise the abstract to more precisely state that the shade maps are generated via simulation to enable large-scale analysis, rather than claiming direct physical accuracy. This addresses the load-bearing concern by clarifying the dataset's scope. revision: yes
-
Referee: [Evaluation Protocols and Baselines] The soundness of the supported tasks (shade generation, segmentation, 3D reconstruction) depends on the fidelity of the shade maps; without reported error analysis, quantitative comparison to ground truth, or sensitivity tests for shadow boundaries and penumbra effects, systematic biases could propagate into all benchmark results and baselines.
Authors: We acknowledge this important point. The current version of the manuscript focuses on establishing the benchmark tasks and baseline performances but does not include a dedicated error analysis for the shade maps themselves. In the revision, we will add an 'Analysis of Shade Map Fidelity' subsection under Evaluation Protocols. This will include quantitative comparisons of simulated shade boundaries against manually annotated subsets and sensitivity analysis varying parameters like building height uncertainty and solar angle discretization. We believe these additions will mitigate concerns about potential biases propagating into the benchmark results. revision: yes
Circularity Check
No circularity: dataset creation is self-contained
full rationale
The paper's core contribution is the introduction of ShadeBench, a new multimodal dataset containing simulated shade maps, satellite imagery, building skeletons, 3D meshes, and textual descriptions for downstream tasks like shade generation and segmentation. No derivation chain, equations, fitted parameters, or predictions are claimed. The abstract and description focus on dataset construction and benchmarking protocols without reducing any result to prior self-citations or inputs by construction. This is a standard dataset paper with independent content.
Axiom & Free-Parameter Ledger
axioms (1)
- domain assumption Simulated shade maps accurately model real-world building-induced shade patterns and their effect on thermal exposure
Lean theorems connected to this paper
-
IndisputableMonolith/Foundation/RealityFromDistinction.leanreality_from_one_distinction unclear?
unclearRelation between the paper passage and the cited Recognition theorem.
We perform shade simulation using Blender... SPA-informed Solar Irradiance Map... NOAA Solar Position Algorithm
-
IndisputableMonolith/Cost/FunctionalEquation.leanwashburn_uniqueness_aczel unclear?
unclearRelation between the paper passage and the cited Recognition theorem.
x_gt = x_shade - x_sk - I(x_shade ≤ α)
What do these tags mean?
- matches
- The paper's claim is directly supported by a theorem in the formal canon.
- supports
- The theorem supports part of the paper's argument, but the paper may add assumptions or extra steps.
- extends
- The paper goes beyond the formal theorem; the theorem is a base layer rather than the whole result.
- uses
- The paper appears to rely on the theorem as machinery.
- contradicts
- The paper's claim conflicts with a theorem or certificate in the canon.
- unclear
- Pith found a possible connection, but the passage is too broad, indirect, or ambiguous to say the theorem truly supports the claim.
Reference graph
Works this paper leans on
-
[1]
Rameen Abdal, Yipeng Qin, and Peter Wonka. 2019. Image2stylegan: How to embed images into the stylegan latent space?. InProceedings of the IEEE/CVF international conference on computer vision. 4432–4441
work page 2019
-
[2]
Waleed Abdalati, H Jay Zwally, Robert Bindschadler, Bea Csatho, Sinead Louise Farrell, Helen Amanda Fricker, David Harding, Ronald Kwok, Michael Lefsky, Thorsten Markus, et al. 2010. The ICESat-2 laser altimetry mission.Proc. IEEE 98, 5 (2010), 735–751
work page 2010
-
[3]
Ehsan Ahmadian, Behzad Sodagar, Chris Bingham, Amira Elnokaly, and Glen Mills. 2021. Effect of urban built form and density on building energy performance in temperate climates.Energy and Buildings236 (2021), 110762
work page 2021
-
[4]
Samaneh Azadi, Matthew Fisher, Vladimir G Kim, Zhaowen Wang, Eli Shechtman, and Trevor Darrell. 2018. Multi-content gan for few-shot font style transfer. In Proceedings of the IEEE conference on computer vision and pattern recognition. 7564–7573
work page 2018
-
[5]
Sara Beheshtifar and Romins Abdollahi. 2023. Simulation of Shading in Urban Neighborhoods Using GIS (Case study: Sanandaj, Adab neighborhood).Journal of Civil and Environmental Engineering52, 109 (2023), 49–58
work page 2023
-
[6]
Jeroen Bertels, Tom Eelbode, Maxim Berman, Dirk Vandermeulen, Frederik Maes, Raf Bisschops, and Matthew B Blaschko. 2019. Optimizing the dice score and jaccard index for medical image segmentation: Theory and practice. InMedical Image Computing and Computer Assisted Intervention–MICCAI 2019: 22nd Inter- national Conference, Shenzhen, China, October 13–17,...
work page 2019
-
[7]
Andrew Brock, Jeff Donahue, and Karen Simonyan. 2018. Large scale GAN training for high fidelity natural image synthesis.arXiv preprint arXiv:1809.11096 (2018)
work page internal anchor Pith review Pith/arXiv arXiv 2018
-
[8]
Isaac Buo, Valentina Sagris, Jaak Jaagus, and Ariane Middel. 2023. High-resolution thermal exposure and shade maps for cool corridor planning.Sustainable Cities and Society93 (2023), 104499
work page 2023
-
[9]
Florinel-Alin Croitoru, Vlad Hondru, Radu Tudor Ionescu, and Mubarak Shah
-
[10]
Diffusion models in vision: A survey.IEEE Transactions on Pattern Analysis and Machine Intelligence45, 9 (2023), 10850–10869
work page 2023
-
[11]
Longchao Da, Rohan Chhibba, Rushabh Jaiswal, Ariane Middel, and Hua Wei
-
[12]
InProceedings of the 33rd ACM International Conference on Information and Knowledge Management
Shaded Route Planning Using Active Segmentation and Identification of Satellite Images. InProceedings of the 33rd ACM International Conference on Information and Knowledge Management. 5205–5209
- [13]
-
[14]
Prafulla Dhariwal and Alexander Nichol. 2021. Diffusion models beat gans on image synthesis.Advances in neural information processing systems34 (2021), 8780–8794. ShadeBench: A Benchmark Dataset for Building Shade Simulation in Sustainable Society Conference acronym ’XX, June 03–05, 2018, Woodstock, NY
work page 2021
-
[15]
Yuhao Du, Yuncheng Jiang, Shuangyi Tan, Xusheng Wu, Qi Dou, Zhen Li, Guan- bin Li, and Xiang Wan. 2023. ArSDM: colonoscopy images synthesis with adap- tive refinement semantic diffusion models. InInternational conference on medical image computing and computer-assisted intervention. Springer, 339–349
work page 2023
- [16]
-
[17]
Michael Gschwandtner, Roland Kwitt, Andreas Uhl, and Wolfgang Pree. 2011. BlenSor: Blender sensor simulation toolbox. InAdvances in Visual Computing: 7th International Symposium, ISVC 2011, Las Vegas, NV, USA, September 26-28,
work page 2011
- [18]
-
[19]
Fei Guo, Ruonan Guo, Hongchi Zhang, Jing Dong, and Jun Zhao. 2023. A canopy shading-based approach to heat exposure risk mitigation in small squares.Urban Climate49 (2023), 101495
work page 2023
-
[20]
Harsh G Kamath, Manmeet Singh, Neetiraj Malviya, Alberto Martilli, Liu He, Daniel Aliaga, Cenlin He, Fei Chen, Lori A Magruder, Zong-Liang Yang, et al
-
[21]
GLObal Building heights for Urban Studies (UT-GLOBUS) for city-and street-scale urban simulations: Development and first applications.Scientific Data11, 1 (2024), 886
work page 2024
-
[22]
Alexander Kirillov, Eric Mintun, Nikhila Ravi, Hanzi Mao, Chloe Rolland, Laura Gustafson, Tete Xiao, Spencer Whitehead, Alexander C Berg, Wan-Yen Lo, et al
-
[23]
InProceedings of the IEEE/CVF international conference on computer vision
Segment anything. InProceedings of the IEEE/CVF international conference on computer vision. 4015–4026
-
[24]
Xuecao Li, Yuyu Zhou, Peng Gong, Karen C Seto, and Nicholas Clinton. 2020. Developing a method to estimate building height from Sentinel-1 data.Remote Sensing of Environment240 (2020), 111705
work page 2020
-
[25]
Fredrik Lindberg, Björn Holmer, and Sofia Thorsson. 2008. SOLWEIG 1.0– Modelling spatial variations of 3D radiant fluxes and mean radiant temperature in complex urban settings.International journal of biometeorology52 (2008), 697–713
work page 2008
-
[26]
K Ma. 2018. Parasol Navigation: Optimizing walking routes to keep you in the sun or shade.Parasol Navigation: Optimizing walking routes to keep you in the sun or shade(2018)
work page 2018
-
[27]
Johnas Omanwa Maranga, Justine John Nnko, and Shengwu Xiong. 2025. Learned active contours via transformer-based deep convolutional neural network using canny edge detection algorithm.Signal, Image and Video Processing19, 3 (2025), 222
work page 2025
-
[28]
Gerald A Meehl and Claudia Tebaldi. 2004. More intense, more frequent, and longer lasting heat waves in the 21st century.Science305, 5686 (2004), 994–997
work page 2004
-
[29]
Vicky Mudeng, Minseok Kim, and Se-woon Choe. 2022. Prospects of structural similarity index for medical image analysis.Applied Sciences12, 8 (2022), 3754
work page 2022
-
[30]
NIEHS. 2022. Heat and Health Impacts of Climate Change. https://www.niehs.nih. gov/research/programs/climatechange/health_impacts/heat Accessed: February 1, 2025
work page 2022
-
[31]
Yujin Park, Qunshan Zhao, Jean-Michel Guldmann, and Elizabeth A Wentz. 2023. Quantifying the cumulative cooling effects of 3D building and tree shade with high resolution thermal imagery in a hot arid urban climate.Landscape and Urban Planning240 (2023), 104874
work page 2023
- [32]
-
[33]
Nikhila Ravi, Valentin Gabeur, Yuan-Ting Hu, Ronghang Hu, Chaitanya Ryali, Tengyu Ma, Haitham Khedr, Roman Rädle, Chloe Rolland, Laura Gustafson, Eric Mintun, Junting Pan, Kalyan Vasudev Alwala, Nicolas Carion, Chao-Yuan Wu, Ross Girshick, Piotr Dollár, and Christoph Feichtenhofer. 2024. SAM 2: Segment Anything in Images and Videos.arXiv preprint arXiv:24...
work page internal anchor Pith review Pith/arXiv arXiv 2024
-
[34]
Ibrahim Reda and Afshin Andreas. 2004. Solar position algorithm for solar radiation applications.Solar energy76, 5 (2004), 577–589
work page 2004
-
[35]
Hannah Ritchie. 2024. How many people die from extreme temperatures, and how this could change in the future: Part two.Our World in Data (2024). https://ourworldindata.org/part-two-how-many-people-die-from- extreme-temperatures-and-how-could-this-change-in-the-future
work page 2024
-
[36]
Robin Rombach, Andreas Blattmann, Dominik Lorenz, Patrick Esser, and Björn Ommer. 2022. High-resolution image synthesis with latent diffusion models. In Proceedings of the IEEE/CVF conference on computer vision and pattern recognition. 10684–10695
work page 2022
-
[37]
Fabian D Schneider, António Ferraz, Steven Hancock, Laura I Duncanson, Ralph O Dubayah, Ryan P Pavlick, and David S Schimel. 2020. Towards mapping the diversity of canopy structure from space with GEDI.Environmental Research Letters15, 11 (2020), 115006
work page 2020
-
[38]
Qi Zhao Shanshan Li. 2021. World’s largest study of global climate related mortality links 5 million deaths a year to abnormal temperatures. (2021)
work page 2021
- [39]
-
[40]
Floris Van Beers, Arvid Lindström, Emmanuel Okafor, and Marco Wiering. 2019. Deep neural networks with intersection over union loss for binary image seg- mentation. InProceedings of the 8th international conference on pattern recognition applications and methods. SciTePress, 438–445
work page 2019
-
[41]
Stefan Wess, Klaus-Dieter Althoff, and Guido Derwand. 1994. Using k-d trees to improve the retrieval step in case-based reasoning. InTopics in Case-Based Rea- soning: First European Workshop, EWCBR-93 Kaiserslautern, Germany, November 1–5, 1993 Selected Papers 1. Springer, 167–181
work page 1994
-
[42]
Jiansheng Wu, Si Li, Nan Shen, Yuhao Zhao, and Hongyi Cui. 2020. Construction of cooling corridors with multiscenarios on urban scale: A case study of Shenzhen. Sustainability12, 15 (2020), 5903
work page 2020
-
[43]
Tong Wu, Liang Pan, Junzhe Zhang, Tai Wang, Ziwei Liu, and Dahua Lin. [n. d.]. Supplementary Material: Density-aware Chamfer Distance as a Comprehensive Metric for Point Cloud Completion. ([n. d.])
-
[44]
Ling Yang, Zhilong Zhang, Yang Song, Shenda Hong, Runsheng Xu, Yue Zhao, Wentao Zhang, Bin Cui, and Ming-Hsuan Yang. 2023. Diffusion models: A comprehensive survey of methods and applications.ACM computing surveys56, 4 (2023), 1–39
work page 2023
-
[45]
Lvmin Zhang, Anyi Rao, and Maneesh Agrawala. 2023. Adding conditional con- trol to text-to-image diffusion models. InProceedings of the IEEE/CVF international conference on computer vision. 3836–3847
work page 2023
-
[46]
Shihao Zhao, Dongdong Chen, Yen-Chun Chen, Jianmin Bao, Shaozhe Hao, Lu Yuan, and Kwan-Yee K Wong. 2024. Uni-controlnet: All-in-one control to text-to- image diffusion models.Advances in Neural Information Processing Systems36 (2024)
work page 2024
-
[47]
Theodore Zhao, Yu Gu, Jianwei Yang, Naoto Usuyama, Ho Hin Lee, Sid Kiblawi, Tristan Naumann, Jianfeng Gao, Angela Crabtree, Jacob Abel, et al . 2024. A foundation model for joint segmentation, detection and recognition of biomedical objects across nine modalities.Nature methods(2024), 1–11. Conference acronym ’XX, June 03–05, 2018, Woodstock, NY Longchao ...
work page 2024
discussion (0)
Sign in with ORCID, Apple, or X to comment. Anyone can read and Pith papers without signing in.