The Varieties of Schelling Model Experience
Pith reviewed 2026-05-21 22:06 UTC · model grok-4.3
The pith
Survey of Schelling model variants shows they reduce to three phase diagram classes.
A machine-rendered reading of the paper's core claim, the machinery that carries it, and where it could break.
Core claim
Among 54 rule variants, the macroscopic outcomes organize into three phase diagram classes distinguished by the number of phase transitions. This scheme is robust across segregation measures. The statistical and dynamic drivers of the transitions are clarified by examining vision, movement criteria, vacancies, initial state, and rivalry. The original step-function satisfaction rule is pathological at high thresholds, causing coordination failures as satisfactory sites become rare.
What carries the argument
Phase diagram classification by number of transitions, which groups the variants and exposes the parameter-driven mechanisms behind segregation changes.
If this is right
- Variants differing in movement criteria and vacancy levels produce similar patterns within the same class.
- The roles of vision and rivalry determine whether transitions occur at all.
- High thresholds in the original rule reliably produce coordination failures rather than segregation.
- Percolation-inspired measures confirm the same three classes as sociological ones.
Where Pith is reading between the lines
- Similar reductions in apparent model variety may occur in other agent-based social simulations when phase diagrams are mapped.
- Testing the classification on models with network structure or preference heterogeneity would check if three classes remain sufficient.
- Real-world segregation data could be mapped to these classes to identify which dynamical regime applies.
Load-bearing premise
The 54 rule variants and the sampled ranges of vision, vacancy density, and initial conditions capture all possible macroscopic behaviors in Schelling-like models.
What would settle it
Discovery of a new phase diagram class with four or more transitions when additional rule variants are tested or when parameters are extended beyond the current ranges.
Figures


read the original abstract
The Schelling model is a prototype for agent-based modeling in social systems. We produce a comprehensive analysis of Schelling model rule variants by classifying the space of macroscopic outcomes using phase diagrams. Among 54 rule variants, only 3 phase diagram classes are found, characterized by the number of phase transitions. This classification scheme is found to be robust to the use of sociological and percolation-inspired measures of segregation. The statistical and dynamic drivers of these transitions are elucidated by analyzing the roles of vision, movement criteria, vacancies, the initial state, and rivalry. Schelling's original step function dictating satisfaction is found to be pathological at high thresholds, producing coordination failures as satisfactory sites become increasingly rare. This comprehensive classification gives new insight into the drivers of transitions in the Schelling model and creates a basis for studying more complex Schelling-like models.
Editorial analysis
A structured set of objections, weighed in public.
Referee Report
Summary. The paper conducts an extensive simulation study of 54 rule variants of the Schelling segregation model. It classifies the resulting phase diagrams into three classes distinguished solely by the number of phase transitions (0, 1, or 2+). The classification is reported to be robust when switching between sociological and percolation-inspired segregation order parameters. The work further examines how vision radius, vacancy density, movement criteria, initial conditions, and rivalry influence the transitions, and identifies Schelling's original step-function satisfaction rule as pathological at high thresholds due to coordination failures.
Significance. If the three-class taxonomy is reproducible, the manuscript supplies a useful organizing framework for the large family of Schelling-like models. By systematically varying rules and parameters and by contrasting two families of order parameters, it isolates which microscopic ingredients control the appearance and multiplicity of macroscopic transitions. The explicit demonstration that the original Schelling satisfaction function becomes pathological at high thresholds is a concrete, falsifiable observation that can guide model selection in future agent-based social simulations.
major comments (2)
- [Measures] Measures section: the protocol used to count phase transitions (inflection-point detection, threshold crossing, or derivative criterion on the segregation order parameter) is not stated with sufficient precision. Because lattice models typically exhibit crossovers rather than sharp transitions, the integer class assignment (0, 1, or 2+) can shift with modest changes in system size L or equilibration time; the abstract claims robustness only to the choice of order parameter, not to these numerical details.
- [Methods] Methods: a complete table or supplementary list enumerating the exact rule definitions, vision radii, vacancy densities, satisfaction thresholds, and initial-condition protocols for all 54 variants is absent. Without this information the claimed exhaustive coverage of the rule space cannot be verified or reproduced, directly affecting the central assertion that only three phase-diagram classes exist.
minor comments (2)
- [Figures] Figure captions should explicitly state the system size L, number of independent runs, and burn-in time used to generate each phase diagram.
- [Notation] Notation for the two families of segregation measures (sociological vs. percolation) should be introduced once in a dedicated subsection rather than scattered across the text.
Simulated Author's Rebuttal
We thank the referee for their careful reading and constructive comments on our manuscript. We address each major point below and have revised the manuscript to improve clarity and reproducibility.
read point-by-point responses
-
Referee: [Measures] Measures section: the protocol used to count phase transitions (inflection-point detection, threshold crossing, or derivative criterion on the segregation order parameter) is not stated with sufficient precision. Because lattice models typically exhibit crossovers rather than sharp transitions, the integer class assignment (0, 1, or 2+) can shift with modest changes in system size L or equilibration time; the abstract claims robustness only to the choice of order parameter, not to these numerical details.
Authors: We agree that a more precise description of the phase-transition detection protocol is needed. In the revised manuscript we have added an explicit subsection to the Methods that specifies the exact procedure: transitions are identified by locating inflection points in the order-parameter curves (computed via finite differences) together with a secondary check that the absolute slope exceeds 0.05 per unit change in the control parameter. We have also performed and now report additional finite-size and equilibration-time scans (L = 50, 100, 200 and equilibration up to 10^5 Monte Carlo steps) confirming that the integer class labels remain unchanged under these variations. The abstract will be updated to note robustness with respect to both order-parameter family and the numerical detection details. revision: yes
-
Referee: [Methods] Methods: a complete table or supplementary list enumerating the exact rule definitions, vision radii, vacancy densities, satisfaction thresholds, and initial-condition protocols for all 54 variants is absent. Without this information the claimed exhaustive coverage of the rule space cannot be verified or reproduced, directly affecting the central assertion that only three phase-diagram classes exist.
Authors: We accept that the original manuscript did not supply a single, machine-readable enumeration of all 54 variants. We have therefore added a new supplementary table (Table S1) that lists, for every variant, the precise satisfaction function (step or linear), vision radius, vacancy fraction, threshold value, movement criterion, and initial-condition protocol. The table is accompanied by a short description of the parameter ranges explored. With this addition, together with the public release of the simulation scripts, the exhaustive sampling of rule space and the resulting three-class taxonomy can be directly verified and reproduced. revision: yes
Circularity Check
No circularity: classification derived from direct simulation of 54 explicit rule variants
full rationale
The paper performs an exhaustive computational survey of 54 hand-specified rule variants, generates phase diagrams for each via Monte Carlo simulation, and counts observed transitions using two independent order-parameter families (sociological and percolation). No central quantity is obtained by fitting a parameter to data and then relabeling the fit as a prediction; no derivation step reduces to a self-citation chain; the three-class taxonomy is an empirical summary of the simulation output rather than a tautological re-expression of the input rules. The work is therefore self-contained against external benchmarks.
Axiom & Free-Parameter Ledger
free parameters (3)
- vision radius
- vacancy density
- satisfaction threshold
axioms (2)
- domain assumption Agents move asynchronously to a random satisfactory empty site when dissatisfied.
- standard math The grid is toroidal or has periodic boundaries.
Lean theorems connected to this paper
-
IndisputableMonolith/Foundation/Cost/FunctionalEquation.leanwashburn_uniqueness_aczel unclear?
unclearRelation between the paper passage and the cited Recognition theorem.
Among 54 rule variants, only 3 phase diagram classes are found, characterized by the number of phase transitions... robust to the use of sociological and percolation-inspired measures of segregation.
-
IndisputableMonolith/Foundation/ArithmeticFromLogic.leanLogicNat recovery and embed_strictMono unclear?
unclearRelation between the paper passage and the cited Recognition theorem.
The statistical and dynamic drivers of these transitions are elucidated by analyzing the roles of vision, movement criteria, vacancies, the initial state, and rivalry.
What do these tags mean?
- matches
- The paper's claim is directly supported by a theorem in the formal canon.
- supports
- The theorem supports part of the paper's argument, but the paper may add assumptions or extra steps.
- extends
- The paper goes beyond the formal theorem; the theorem is a base layer rather than the whole result.
- uses
- The paper appears to rely on the theorem as machinery.
- contradicts
- The paper's claim conflicts with a theorem or certificate in the canon.
- unclear
- Pith found a possible connection, but the passage is too broad, indirect, or ambiguous to say the theorem truly supports the claim.
Reference graph
Works this paper leans on
-
[1]
Location Space and Agents A total population ofNagents are exhaustively di- vided into two groups, reds (N r) and blues (N b). These agents are distributed onto a non-periodic square grid where the lattice side lengths extend from 0 toLinx andy. Agents compete for vacancies, with only one agent allowed per site. The occupation density is thus given byρ: ρ...
-
[2]
Agent Properties Agents have a location in the 2D lattice (x, y), a type (red or blue), and a homophily threshold (th). Each agent’s neighborhood is centered on themselves, including all sites within a Euclidean distancer(in lattice units). An agent will count the number of agents of the same (ns) and opposite (no) type within its neighborhood and determi...
-
[3]
Extending Schelling’s Model The simulations are initialized with a symmetric (Nr = Nb) random distribution of N agents on a non-periodic square lattice of sizeL= 100; where each agent’s neigh- borhood is of radiusr= 10. In each time step, a random agent is selected and probed for satisfaction. For satisfied agents, they are left unperturbed, and a new ste...
-
[4]
Prospecting Vision When searching, agents randomly select a prospect site within some search radius. Schelling’s early model em- ployed Nearest-Neighbor (NN) search (s=0), prioritizing proximity by prospecting the closest sites before search- ing farther away. Conversely, much of modern Schelling research employs an entirely random search (s=2) with no pr...
-
[5]
A smallerrresults in a more dis- cretized range of possibleq, with larger spacing between values
Neighborhood radius To study the role of the neighborhood radius, a phase diagram was generated that variedrfrom 1 to 20 as illustrated in Figure 9. A smallerrresults in a more dis- cretized range of possibleq, with larger spacing between values. Additionally, a smallerr, at fixedLandρ, decreases the average number of agents in a neighborhood⟨n⟩.This resu...
-
[6]
minimizes correlations inqbetween subsequent prospects, provides more seeds and amplifies the destabilizing effect of seeds relocation. All simulations run with Rivalry on,L= 100 andr= √ 2. calization in the search process typically results in a high degree of correlation between subsequent prospects ho- mophily quotient. Resulting in a delayed transition...
work page 1956
-
[7]
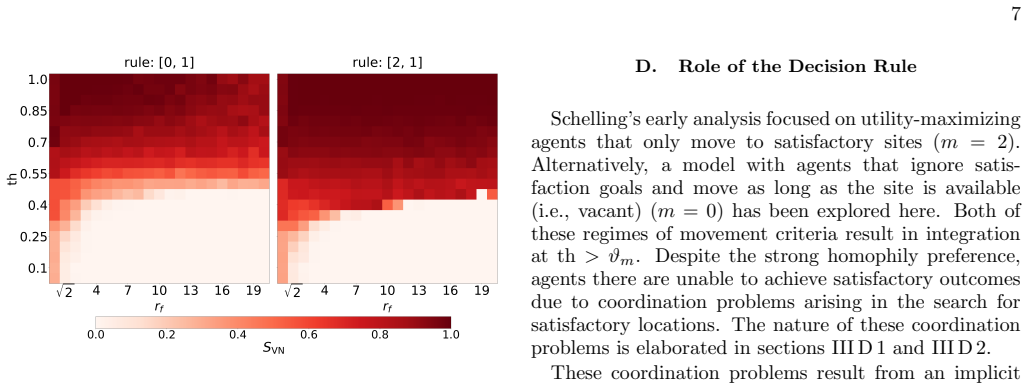
Restless Rascals When agents ignore satisfaction goals and move as long as the site is available (i.e., vacant) at high thresholds, most agents are unsatisfied and thus relocate. How- ever since these agents ignore satisfaction goals, the sys- tem shuffles through random initial states each with q∼0.5±σ q and agents are thus equally unlikely to be satisfi...
-
[8]
Petrified Purists Under the step utility function (3), agents who relocate with preference for satisfaction (m=2) are restricted to relocating to available sites withq≥th. At high thresh- olds, neighborhoods that deviate meaningfully from the ensemble average ofq= 0.5 become exceedingly rare when neighborhoods are of moderate size (see Figure 7). The few ...
-
[9]
Multi-agent occupation Enabling multi-agent occupancy affects the upper transition for agents with preference for satisfaction (m=2). When a haven is available, these agents prefer- entially pile into this site, often generating more havens in the process. As a result, segregation is now possible at higher occupation densities and thresholds than in the s...
-
[10]
Percolation-Inspired Segregation Measures Schelling emphasized that clustering measures are re- lated to—but distinct from—measures of neighborhood homogeneity. Consequently, some analyses have incorpo- rated segregation measures inspired by percolation the- ory. These study the geometry and statistics of clus- ters, where two agents belong to the same cl...
-
[11]
Finite Limit:1< ℓ p <∞ The finite limit onℓ p was set toL 2 −1. Under this con- straint, no prefiltering of prospects takes place and agents must inspect each site for satisfaction of movement crite- ria. For improvement seeking agents, a large upper limit on prospecting did not change segregation outcomes de- spite agents prospecting closer to this limit...
-
[12]
Lower Limit:ℓ p = 1 When agents are limited to prospecting a single site, in- efficient search algorithms that require multiple prospects fail to identify viable relocation options. This results in integration at moderate thresholds, despite the presence of dissatisfied agents. a. NN Search For the NN search algorithm, at moderate occupa- tion densities t...
-
[13]
Expected neighborhood occupation In a neighborhood ofM=πr 2 sites (in the large r limit) the number of same agents is calculated as: ns = MX i Ji (E5) WhereJ i is a Bernoulli random variable: Ji = ( 1,if siteicontains an agent of the same type, 0,otherwise. (E6) With probabilities: p(Ji = 1) = ρ 2;p(J i = 0) = 1− ρ 2 (E7) The expected site occupation of s...
-
[14]
Variance and covariance in neighborhood occupation Var{ns}= MX i Var{Ji}+ MX i M−1X k̸=i Cov{Ji, Jk}(E13) The variance and covariance of the Bernoulli random variable are: Var{Ji}= ρ 2 1− ρ 2 (E14) Cov{Ji, Jk}=⟨J iJk⟩ − ⟨Ji⟩⟨Jk⟩(E15) Where: ⟨JiJk⟩= X JiJkp(Ji, Jk) (E16) the probability of selecting two sites in a neighborhood and finding them both to be o...
-
[15]
Putting it all back together Due to the symmetry of the population distribution and independent sampling of the population E4 simplifies to: Var{q}= (a 2 +b 2) Var{ns}(E22) Substituting in equations E11, E12 and E13 where: (a2 +b 2) = 1 2(M ρ)2 (E23) Var{ns} ≃M ρ 2 1− ρ 2 (E24) This yields a variance that scales like by⟨n⟩ −1, as seen in Figure 8, with a ...
-
[16]
Card, Design-based research in empirical microeco- nomics, American Economic Review112, 1773 (2022)
D. Card, Design-based research in empirical microeco- nomics, American Economic Review112, 1773 (2022)
work page 2022
-
[17]
P. Ball, The physical modelling of society: a historical perspective, Physica A: Statistical Mechanics and its Ap- plications314, 1 (2002), horizons in Complex Systems
work page 2002
-
[18]
Barthelemy, The statistical physics of cities, Nature Reviews Physics1, 406 (2019)
M. Barthelemy, The statistical physics of cities, Nature Reviews Physics1, 406 (2019)
work page 2019
- [19]
-
[20]
M. Perc, J. J. Jordan, D. G. Rand, Z. Wang, S. Boc- caletti, and A. Szolnoki, Statistical physics of human co- operation, Physics Reports687, 1 (2017)
work page 2017
-
[21]
P. E. Smaldino and R. McElreath, The natural selec- tion of bad science, Royal Society open science3, 160384 (2016)
work page 2016
-
[22]
W. B. Arthur, Foundations of complexity economics, Na- ture Reviews Physics3, 136 (2021)
work page 2021
- [23]
-
[24]
Gabaix, A behavioral new keynesian model, American Economic Review110, 2271 (2020)
X. Gabaix, A behavioral new keynesian model, American Economic Review110, 2271 (2020)
work page 2020
-
[25]
T. C. Schelling, Models of segregation, The American Economic Review59, 488 (1969)
work page 1969
-
[26]
T. C. Schelling, Dynamic models of segregation, Journal of Mathematical Sociology1, 143 (1971)
work page 1971
-
[27]
T. C. Schelling,Micromotives And Macrobehavior(WW Norton, 2006)
work page 2006
-
[28]
Y. Bai, Z. Huang, X. Zhang, J. Lu, X. Niu, Z. He, C. Zhu, M. Xiao, Q. Song, X. Wei, C. Wang, Z. Cui, Y. C. Jing Dou, F. Pei, H. Zai, T. S. Wei Wang, P. An, J. Zhang, J. Dong, Y. Li, J. Shi, H. Jin, P. Chen, Y. Sun, Y. Li, H. Chen, Z. Wei, H. Zhao, and Q. Chen, Initial- izing film homogeneity to retard phase segregation for stable perovskite solar cells, S...
work page 2022
-
[29]
D. Vinkovic and A. Kirman, A physical analogue of the schelling model, PNAS51, 19261 (2006)
work page 2006
- [30]
-
[31]
S. Cannon, J. J. Daymude, C. G¨ okmen, D. Randall, and A. W. Richa, A Local Stochastic Algorithm for Sep- aration in Heterogeneous Self-Organizing Particle Sys- tems, inApproximation, Randomization, and Combi- natorial Optimization. Algorithms and Techniques (AP- PROX/RANDOM 2019), Leibniz International Proceed- ings in Informatics (LIPIcs), Vol. 145 (Sch...
work page 2019
-
[32]
Z. Zhao and D. Randall, A heterogeneous schelling model for wealth disparity and its effect on segregation, in Proceedings of the 2nd ACM Conference on Equity and Access in Algorithms, Mechanisms, and Optimization, EAAMO ’22 (Association for Computing Machinery, 2022)
work page 2022
-
[33]
B. Reh, F. Aller, and K. Mombaur, A new continu- ous model for segregation implemented and analyzed on swarm robots, inSwarm Intelligence(Springer Interna- tional Publishing, Cham, 2016) pp. 28–39
work page 2016
-
[34]
M. v. H. Ruta Ubareviciene and T. Tammary, Fifty years after the schelling’s models of segregation: Bibliometric analysis of the legacy of schelling and the future direc- tions of segregation research, Cities174, 104838 (2024)
work page 2024
-
[35]
E. Cuevas, An agent-based model to evaluate the covid- 19 transmission risks in facilities, Computers in Biology and Medicine121, 103827 (2020)
work page 2020
-
[36]
W. A. V. Clark and M. Fossett, Understanding the social context of the schelling segregation model, Proceedings of the National Academy of Sciences105, 4109 (2008), https://www.pnas.org/doi/pdf/10.1073/pnas.0708155105
-
[37]
D. Stauffer, Social applications of two-dimensional ising models, American Journal of Physics76, 470 (2007)
work page 2007
-
[38]
L. Gauvin, J.-P. Nadal, and J. Vannimenus, Schelling segregation in an open city: A kinetically constrained blume-emery-griffiths spin-1 system, Phys. Rev. E81, 066120 (2010)
work page 2010
-
[39]
C. C. Luca Dall’Asta and M. Marsili, Statistical physics of the schelling model of segregation, Journal of Statisti- cal Mechanics: Theory and Experiment51, 19261 (2008)
work page 2008
-
[40]
S. Grauwin, E. Bertin, R. Lemoy, and P. Jensen, Compe- tition between collective and individual dynamics, PNAS 106, 20622–20626 (2009)
work page 2009
-
[41]
A. J. Laurie and N. K. Jaggi, Role of ’vision’ in neigh- bourhood racial segregation: A variant of the schelling segregation model, Urban Studies40, 2687 (2003)
work page 2003
-
[42]
M. Fossett and D. R. Dietrich, Effects of city size, shape, and form, and neighborhood size and shape in agent- based models of residential segregation: are schelling- style preference effects robust?, Environment and Plan- ning B: Planning and Design36, 149 (2009)
work page 2009
-
[43]
D. Gambetta, G. Mauro, and L. Pappalardo, Mobility consraints in segregation models, Scientific Reports13, 12087 (2023). 18
work page 2023
-
[44]
Granovetter, Threshold models of collective behavior, American Journal of Sociology83, 1420 (1978)
M. Granovetter, Threshold models of collective behavior, American Journal of Sociology83, 1420 (1978)
work page 1978
-
[45]
Y. Gandica, F. Gargiulo, and T. Carletti, Can topology reshape segregation patterns?, Chaos, Solitons and Frac- tals90, 46 (2016)
work page 2016
-
[46]
I. Benenson and E. Hatna, Minority–majority relations in the schelling model of residential dynamics., Geographi- cal Analysis43, 287 (2011)
work page 2011
-
[47]
R. Juste, C. Clementine, L. T. Marion, L. N. Florent, and R. Romain, Space matters: Extending sensitivity analy- sis to initial spatial conditions in geosimulation models., Journal of Artificial Societies and Social Simulation22, 10.18564/jasss.3964 (2018)
-
[48]
H. A. Simon, Rational choice and the structure of the environment., Psychological review63, 129 (1956)
work page 1956
-
[49]
Bialek,Biophysics: searching for principles(Prince- ton University Press, 2012) Chap
W. Bialek,Biophysics: searching for principles(Prince- ton University Press, 2012) Chap. 4
work page 2012
-
[50]
A. Mas-Colell, M. D. Whinston, J. R. Green,et al.,Mi- croeconomic theory, Vol. 1 (Oxford university press New York, 1995) Chap. 2
work page 1995
-
[51]
S. Dietrich and A. Aharony,Introduction to Percolation Theory(Taylor and Francis, 1992)
work page 1992
-
[52]
Bell, A probability model for the measurement of ecological segregation, Social Forces32, 357 (1954)
W. Bell, A probability model for the measurement of ecological segregation, Social Forces32, 357 (1954)
work page 1954
-
[53]
J. Hoshen and R. Kopelman, Percolation and cluster distribution. i. cluster multiple labeling technique and critical concentration algorithm, Physical Review B14, 34286 (1976)
work page 1976
-
[54]
T. Rogers and A. J. McKane, A unified framework for schelling’s model of segregation, Journal of Statistical Mechanics: Thoery and Experiment11, P07006 (2011)
work page 2011
-
[55]
E. E. Bruch, How population structure shapes neighbor- hood segregation, American Journal of Sociology119, 1221 (2014)
work page 2014
-
[56]
R. L. A. Joshua M. Epstein,Growing Artificial Societies (Brookings Institution Press, 1996)
work page 1996
-
[57]
Mark,New Methods for Measuring and Analyzing Seg- regation(Springer, 2017) pp
F. Mark,New Methods for Measuring and Analyzing Seg- regation(Springer, 2017) pp. 239–241
work page 2017
-
[58]
D. Stauffer and S. Solomon, Ising, schelling and self- organising segregation, The European Physical Journal B57, 473 (2007)
work page 2007
-
[59]
P. E. Smaldino, A. Lukaszewski, C. von Rueden, and M. Gurven, Niche diversity can explain cross-cultural differences in personality structure, Nature Human Be- haviour3, 1276 (2019)
work page 2019
discussion (0)
Sign in with ORCID, Apple, or X to comment. Anyone can read and Pith papers without signing in.