New method for characterization of magnetic nanoparticles by scanning magnetic microscopy
Pith reviewed 2026-05-24 21:55 UTC · model grok-4.3
The pith
Scanning magnetic microscopy on tens-of-microgram samples measures iron oxide nanoparticle magnetization with errors of 0.18 Am2/kg in saturation and 0.6 Am2/kg in remanence.
A machine-rendered reading of the paper's core claim, the machinery that carries it, and where it could break.
Core claim
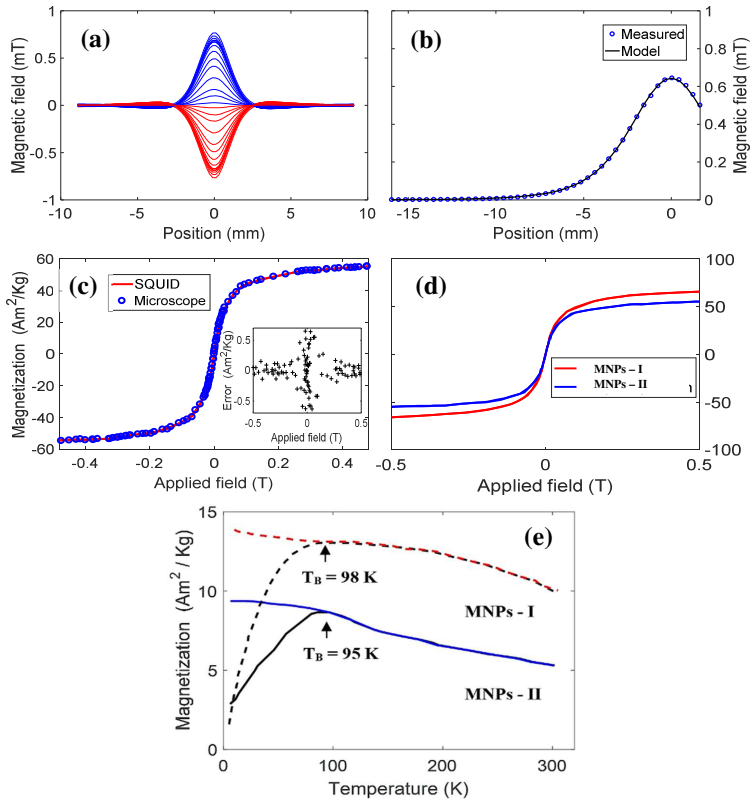
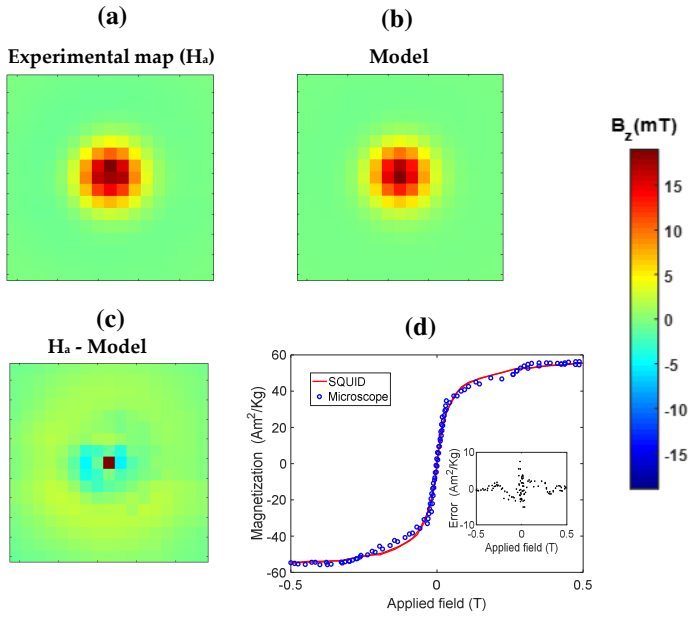
Scanning magnetic microscopy applied to a deposited sample of mass on the order of tens of micrograms produces magnetization curves for iron oxide nanoparticles whose saturation and remanent magnetization values agree with standard magnetometer results to within 0.18 Am2/kg and 0.6 Am2/kg respectively; the average particle sizes inferred from those curves are consistent with transmission electron microscopy determinations.
What carries the argument
Scanning magnetic microscopy signal obtained from a small deposited sample, converted directly into a magnetization curve without additional geometric corrections.
If this is right
- The method applies to bulk materials, microstructures, and nanostructures alike.
- Full hysteresis loops can be recorded, enabling more accurate overall nanoparticle size estimation.
- Size distributions derived from the curves agree with those obtained by transmission electron microscopy.
- The technique provides an alternative to commercial magnetometers when sample mass is limited to tens of micrograms.
Where Pith is reading between the lines
- The method could be used on rare or costly nanoparticle batches where preparing larger specimens is impractical.
- Combining the magnetic scan with simultaneous optical or topographic imaging on the same deposited spot would allow direct correlation of magnetic response with local morphology.
- Extending the scan to arrays of individually deposited micro-droplets might enable high-throughput screening of synthesis conditions.
- The approach might be adapted to measure temperature-dependent magnetization on the same small sample by adding a temperature stage.
- pacs
- msc
- keywords
- feed_headline
Load-bearing premise
The measured scanning magnetic microscopy signal from the deposited microgram-scale sample corresponds quantitatively to the nanoparticles' intrinsic magnetization.
What would settle it
Repeating the SMM measurement on the identical microgram sample while deliberately varying probe-to-sample distance or substrate material and checking whether the extracted saturation magnetization remains within the reported 0.18 Am2/kg error bound.
Figures
read the original abstract
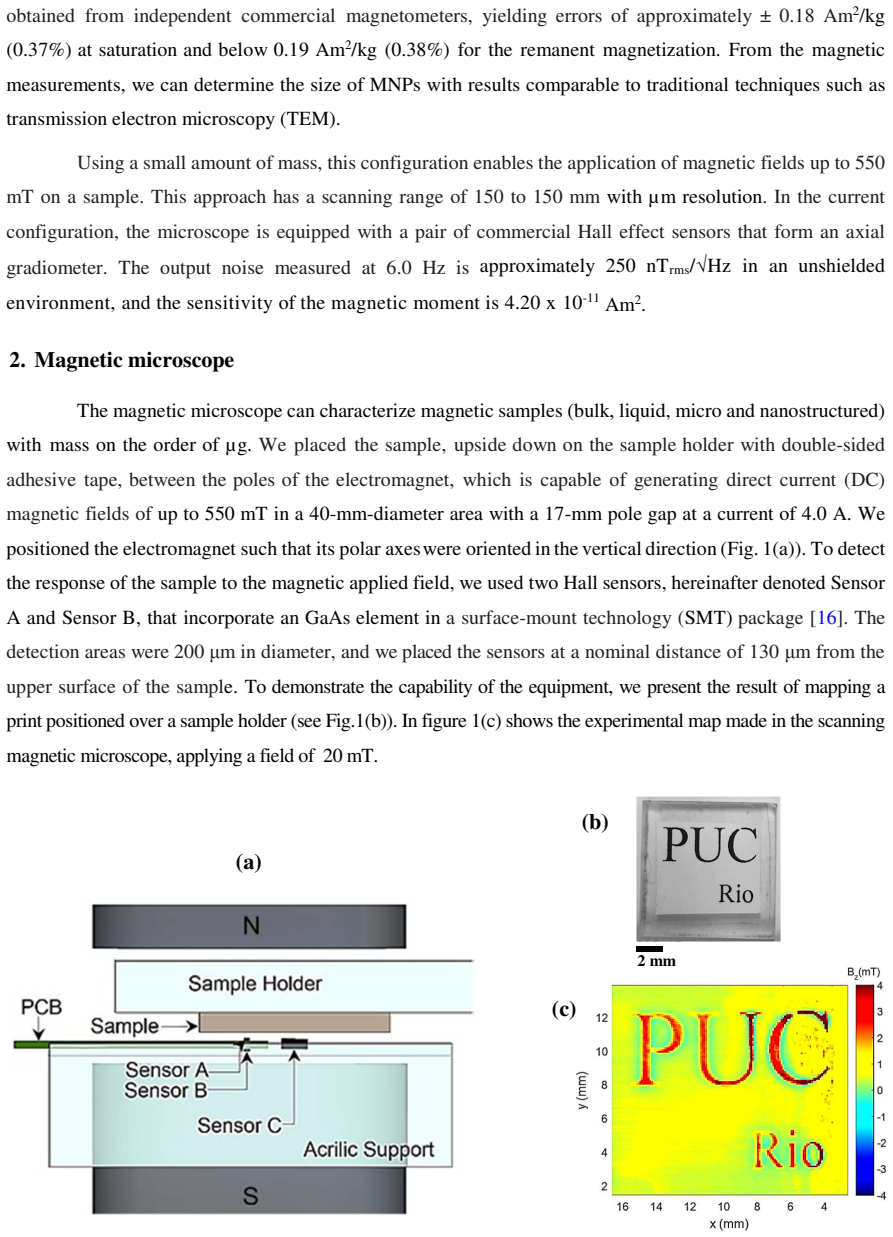
In this paper, we present a new method for the magnetic characterization of bulk materials, microstructures, and nanostructures. We investigated the magnetic and morphological properties of two colloidal dispersions of iron oxide (Fe3O4) magnetic nanoparticles (MNPs), synthesized by chemical precipitation (co-precipitation) and pulsed laser ablation (PLA) in liquid, by scanning magnetic microscopy (SMM) applied to a small sample with mass on the order of tens of {\mu}g. We evaluated the performance of this technique by comparing magnetization curves and measurements obtained with commercial magnetometers, considered standard. The errors obtained for the saturation and remanent magnetization were approximately 0.18 Am2/kg and 0.6 Am2/kg, respectively. The average size distribution of the NPs estimated from the magnetization curve measurements is consistent with the results obtained by traditional transmission electron microscopy (TEM). The technique can be extended to measure and analyze magnetization curves (hysteresis loops), thus enabling an even more accurate estimation of overall NP sizes.
Editorial analysis
A structured set of objections, weighed in public.
Referee Report
Summary. The manuscript presents a new method for magnetic characterization of bulk, micro-, and nanostructures using scanning magnetic microscopy (SMM) applied to small deposited samples (~tens of μg) of two Fe3O4 nanoparticle colloids (synthesized by co-precipitation and pulsed laser ablation). Magnetization curves obtained via SMM are compared to those from commercial magnetometers, yielding reported errors of ~0.18 Am²/kg for saturation magnetization and ~0.6 Am²/kg for remanent magnetization; nanoparticle size distributions extracted from the curves are stated to be consistent with TEM results. The technique is proposed for extension to full hysteresis-loop analysis.
Significance. If the SMM-to-magnetization conversion can be shown to introduce only the quoted errors after accounting for geometry and distance effects, the approach would enable quantitative magnetic measurements on sample masses far below those required by standard VSM/SQUID instruments, which is potentially valuable for limited-quantity nanostructures. The direct numerical comparison to independent commercial data (rather than self-referential fitting) is a positive feature.
major comments (2)
- [Abstract] Abstract: The headline error magnitudes (0.18 Am²/kg saturation, 0.6 Am²/kg remanent) and the TEM-consistency claim presuppose that the SMM voltage map on a deposited sample yields the intrinsic M(H) curve after only a global scaling factor. No equation, calibration curve, or error-propagation analysis is supplied to bound the systematic contributions from probe-sample distance, substrate stray fields, or finite scan-area integration; a 10–20 μm distance variation would rescale the extracted moment by an amount comparable to the quoted errors.
- [Abstract / Methods] The central validation rests on numerical agreement with commercial magnetometer data, yet the manuscript provides neither the raw SMM maps, the explicit form of the SMM-to-magnetization conversion factor, nor any experimental determination of the geometric prefactors. Without these, the load-bearing assumption that geometric corrections are negligible cannot be evaluated.
minor comments (1)
- [Abstract] The abstract states numerical error values and TEM consistency but does not reference any accompanying figures, tables, or supplementary data that would allow the reader to inspect the underlying magnetization curves or size-distribution histograms.
Simulated Author's Rebuttal
We thank the referee for their thorough review and valuable comments on our manuscript. We have carefully considered the major comments and will revise the manuscript to provide the requested details on the SMM-to-magnetization conversion and validation data. Below we respond point by point.
read point-by-point responses
-
Referee: [Abstract] Abstract: The headline error magnitudes (0.18 Am²/kg saturation, 0.6 Am²/kg remanent) and the TEM-consistency claim presuppose that the SMM voltage map on a deposited sample yields the intrinsic M(H) curve after only a global scaling factor. No equation, calibration curve, or error-propagation analysis is supplied to bound the systematic contributions from probe-sample distance, substrate stray fields, or finite scan-area integration; a 10–20 μm distance variation would rescale the extracted moment by an amount comparable to the quoted errors.
Authors: We agree with the referee that additional details are needed to support the claims in the abstract. The full manuscript describes the conversion procedure in the Methods section, but we will revise the abstract and add an explicit equation for the SMM-to-magnetization conversion, along with a calibration curve and error-propagation analysis in a new subsection. This will demonstrate how the systematic effects from distance variation and other factors are accounted for in the reported errors. revision: yes
-
Referee: [Abstract / Methods] The central validation rests on numerical agreement with commercial magnetometer data, yet the manuscript provides neither the raw SMM maps, the explicit form of the SMM-to-magnetization conversion factor, nor any experimental determination of the geometric prefactors. Without these, the load-bearing assumption that geometric corrections are negligible cannot be evaluated.
Authors: We acknowledge that the explicit conversion factor and raw data presentation could be improved for clarity. In the revised version, we will provide the explicit mathematical form of the conversion factor, describe the experimental calibration used to determine the geometric prefactors, and include representative raw SMM voltage maps (with the processed magnetization curves) in the supplementary material. This will enable independent evaluation of the geometric corrections. revision: yes
Circularity Check
No significant circularity; validation uses independent external benchmarks
full rationale
The paper presents a new SMM-based method for MNPs and evaluates performance via direct comparison of magnetization curves to commercial magnetometers (VSM/SQUID), reporting specific errors (0.18 Am2/kg sat., 0.6 Am2/kg rem.) and TEM consistency for size distribution. No load-bearing step reduces a claimed result to a fitted parameter, self-citation, or input by construction; the mapping from SMM voltage to M(H) is treated as a calibrated measurement whose accuracy is checked against separate instruments rather than derived tautologically from the same data. The derivation chain is therefore self-contained against external references.
Axiom & Free-Parameter Ledger
free parameters (1)
- SMM-to-magnetization conversion factor
axioms (1)
- domain assumption The magnetic moment of the nanoparticle ensemble produces a detectable stray field that scales linearly with sample magnetization under the probe geometry used.
Reference graph
Works this paper leans on
-
[1]
Dou, J.; Zhang, Q.; Ma, M.; Gu. Fast fabrication of epoxy-functionalized magnetic polymer core-shell microspheres using glycidyl methacrylate as monomer via photo-initiated miniemulsion polymerization. J. J. Magn. Magn. Mater. , 2012 , 324 , 3078-3082. doi: 10.1016/j.jmmm.2012.05.005
-
[2]
Boon, M. S.; Saw, W.P. S.; Mariatti, M. Magnetic, d ielectric and thermal stability of Ni–Zn ferrite-epo xy composite thin films for electronic applications. J. Magn. Magn. Mater., 2012 , 324, 755-776. doi: 10.1016/j.jmmm.2011.09.009
-
[3]
Measuring magnetic anisotropy with a rotatable ac electromagnet
Wang, R.; Nie, S.; Zhao, J.; Ji, Y. Measuring magnetic anisotropy with a rotatable ac electromagnet. Measument , 2016 , 79, 15- 19. doi: 10.1016/j.measurement.2015.10.032
-
[4]
Yeh, Y.; Jin, J.; Li, C.; Lue, J. T. The electric an d magnetic properties of Co and Fe films percept fr om the Technique TEM Magnetic DLS Co-precipitation 12 nm 9 nm 106 nm Laser ablation 4 nm 4 nm 86 nm 15 coexistence of ferromagnetic and microstrip resonan ce for a T-type microstrip. Measument , 2009 , 42, 290-297. doi: 10.1016/j.measurement.2008.06.012
-
[5]
Noh, S. H.; Na, W.; Jang, J. T.; Lee, J. H.; Lee, E. J.; Moon, S. H.; Lim, Y.; Shin, J. S.; Cheon, J. Nanoscale Magnetism Control via Surface and Exchange Anisotropy for Opt imized Ferrimagnetic Hysteresis. Nano Lett., 2012 , 12, 3716–3721. doi: 10.1021/nl301499u
-
[6]
Magnetic nanoparticles in cancer d iagnosis, drug delivery and treatment
Wu, M; Huang, S. Magnetic nanoparticles in cancer d iagnosis, drug delivery and treatment. Molecular and Clinical Oncology , 2017 , 7, 738-746. doi: 10.3892/mco.2017.1399
-
[7]
Y.; Bishop, M.; Zheng, B.; Ferguson, R
Yu, E. Y.; Bishop, M.; Zheng, B.; Ferguson, R. M.; Kha ndhar, A. P.; Kemp, S. J.; Krishnan, K. M.; Goodwi ll, P. W.; Conolly, S. M. Magnetic Particle Imaging: A Nov el in Vivo Imaging Platform for Cancer Detection. Nano Lett. , 2017 , 17, 1648-1654. doi: 10.1021/acs.nanolett.6b04865
-
[8]
Arsalani, S.; Guidelli, E. J.; Silveira, M. A.; Sal mon, C. E.G.; Araujo, J. F.D.F.; Bruno, A. C.; Baff a, O. Magnetic Fe3O4 Nanoparticles Coated by Natural Rubber Latex as MRI Contrast Agent. J. Magn. Magn. Mater. , 2019 , 475, 458-464. doi: 10.1016/j.jmmm.2018.11.132
-
[9]
Arsalani, S.; Guidelli, E. J.; Silveira, M. A.; Araujo, J. F.D.F.; Bruno, A. C.; Baffa, O. Green Synthesis and Surface Modification of Iron Oxide Nanoparticles with Enhan ced Magnetization Using Natural Rubber Latex. ACS Sustainable Chem.Eng. , 2018 , 11, 13756-13765. doi: 10.1021/acssuschemeng.8b01689
-
[10]
Pottker, W. E.; Ono, R.; Cobos, M. A.; Hernando, A.; Araujo, J. F. D. F.; Bruno, A. C.; Lourenço, S. A.; Longo, E.; La Porta, F. A. Influence of order-disorder effects on the magnetic and optical properties of NiFe2O4 nanoparticles. Ceram. Int. , 2018 , 44, 17290-17297. doi: 10.1016/j.ceramint.2018.06.190
-
[11]
Courtney-Davies, L.; Zhu, Z.; Ciobanu, C. L.; Wade, B. P.; Cook, N. J.; Ehrig, K.; Cabral, A. R.; Kenne dy, A. Matrix-Matched Iron-Oxide Laser Ablation ICP-MS U–P b Geochronology Using Mixed Solution Standards. Minerals , 2016 , 6, 1-17. doi: 10.3390/min6030085
-
[12]
L.; Tavárez, S.; González-Sánchez, Z
Martínez-Rodriguez, N. L.; Tavárez, S.; González-Sánchez, Z. I.; In vitrotoxicity assessment of zinc and nickel ferrite nanoparticles in humanerythrocytes and peripheral blood mononuclear cell. Toxicology in Vitro , 2019 , 57, 54-61. doi: 10.1016/j.tiv.2019.02.011
-
[13]
F.D.F; Pereira, J.M.B.; Bruno, A
Araujo, J. F.D.F; Pereira, J.M.B.; Bruno, A. C. Ass embling a magnetometer for measuring the magnetic properties of iron oxide microparticles in the clas sroom laboratory. Am. J. Phys., 2019 , 87, 471-475. doi: 10.1119/1.5100944
-
[14]
Araujo, J. F.D.F.; Costa, M. C.; Louro, S. R.W.; Br uno, A.C.; A portable Hall magnetometer probe for characterization of magnetic iron oxide nanoparticl es. J. Magn. Magn. Mater. 2017 , 426, 159–162. doi: 10.1016/j.jmmm.2016.11.083
-
[15]
Araujo, J. F. D. F.; Bruno, A.C.; Louro, S. R. W. V ersatile magnetometer assembly for characterizing m agnetic properties of nanoparticles. Rev. Sci. Instrum., 2015 , 85, 105103-7. doi: 10.1063/1.4931989
-
[16]
Pereira, J. M. B.; Pacheco, C. J.; Arenas, M. P.; Araujo, J. F. D. F.; Pereira, G. R.; Bruno, A. C. Novel scanning dc- susceptometer for characterization of heat-resistant steels with different states of aging. J. Magn. Magn. Mater., 2017 , 442, 311–318. doi: 10.1016/j.jmmm.2017.07.004
-
[17]
Araujo, J. F. D. F.; Vieira, D. R. P.; Osorio, F.; Pöttker, W. E.; Porta, F. A.; Presa, P.; Perez, G.; Bruno, A. C. Versatile Hall magnetometer with variable sensitivity assembl y for characterization of the magnetic properties o f nanoparticles. J. Magn. Magn. Mater. 2019 , 489, 165431–165431. doi: 10.1016/j.jmmm.2019.165431
-
[18]
Chara cterization of magnetic nanoparticles by a modular Hall magnetometer
Araujo, J.F.D.F.; Bruno, A.C.; Carvalho, H.R. Chara cterization of magnetic nanoparticles by a modular Hall magnetometer. J. Magn. Magn. Mater. 2010 , 322, 2806–2809. doi: 10.1016/j.jmmm.2010.04.034
-
[19]
Araujo, J. F. D. F.; Pereira, J. M. B. A practical and automated Hall magnetometer for characterizatio n of magnetic materials. Mod. Inst. 2010 , 4, 43-53. doi: 10.4236/mi.2015.44005
-
[20]
Del Rosso, T.; Louro, S. R. W.; Deepak, F. L.; Roma ni, E. C.; Zaman, Q.; Pandoli; Cremona, M.; Freire Junior, F. L.; De Buele, P.; De St. Pierre, T.; Aucelio, R. Q. ; Mariotto, G.; Gemini-Piperni, S.; Ribeiro, A. R.; Landi, S. M.; Magalhães, A. Biocompatible Au@Carbynoid/Pluronic-F 127 nanocomposites synthesized by pulsed laser ablation assisted CO 2 rec...
-
[21]
Thibeau, R.J.; Brown, C. W.; Heidersbach, R. H. Raman Spectra of Possible Corrosion Products of Iron. Applied Spectroscopy, 1978 , 32, 532–535. doi:10.1366/000370278774330739
-
[22]
Faria, D. L. A.; Silva, S. V.; Oliveira, M. T. Raman microspectroscopy of some iron oxides and oxyhydroxides J. Raman Spectrosc , 1997 , 28, 873–878. doi: 10.1002/(SICI)1097-4555(199711)28:11<873::AID-JRS177>3.0.CO;2-B
-
[23]
Hyperfine Interactions , 1998 , 112, 59–65
Oh, S.J., Cook, D.C., Townsend, H.E., Characterization of iron-oxides commonly formed as corrosion products on steel . Hyperfine Interactions , 1998 , 112, 59–65. doi: 10.1023/A:10110763085
-
[24]
Legodi, M. A.; de Waal, D. The preparation of magnetite, goethite, hematite and maghemite of pigment quality from mill scale iron waste. Dyes and Pigments , 2007 , 74, 161–168. doi:10.1016/j.dyepig.2006.01.038
-
[25]
Hanesch, M. Raman spectroscopy of iron oxides and ( oxy) hydroxides at low power laser and possible applications in environmental magnetic studies. Geophysical Journal International , 2009 , 177, 941–948. doi: 10.1111/j.1365-246X.2009.04122.x 16
-
[26]
Shebanova, O. N.; Lazor, P. Raman spectroscopic stu dy of magnetite (FeFe2O4): a new assignment for the vibrational spectrum. Journal of Solid State Chemistry, 2003 , 174, 424–430. doi: 10.1016/S0022-4596(03)00294-9
-
[27]
Cullity, B. D.; Graham, C. D. Introduction to Magnetic Materials (IEEE Press, NJ, 2009), p. 391
work page 2009
-
[28]
Dunlop, D. J.; Özdemir, Ö. Rock Magnetism (Cambridge University Press, UK, 1997), p. 51
work page 1997
-
[29]
Two-color surface plasmon resonance nanos izer for gold nanoparticles, Opt
Zaman, Q.; Souza, J.; Pandoli, O.; Costa, K.; Dmitri ev, V.; Fulvio, D.; Cremona, M.; Aucelio, R.; Fonte s, G.; Del Rosso, T. Two-color surface plasmon resonance nanos izer for gold nanoparticles, Opt. Express, 2019 , 27, 3200-
work page 2019
-
[30]
doi: 10.1364/OE.27.003200
discussion (0)
Sign in with ORCID, Apple, or X to comment. Anyone can read and Pith papers without signing in.