Modeling Fluorescence Correlation Spectroscopy through an aberrating sphere
Pith reviewed 2026-05-24 20:43 UTC · model grok-4.3
The pith
A diffracting dielectric sphere in the optical path modifies the confocal focal volume and changes FCS correlation curves.
A machine-rendered reading of the paper's core claim, the machinery that carries it, and where it could break.
Core claim
Using a bottom-up approach, the presence of a diffracting dielectric bead within the optical path affects the fluorescence excitation and detection properties, thereby changing the outcome of an FCS measurement.
What carries the argument
Bottom-up diffraction calculation of the optical effects produced by a single dielectric sphere placed in the beam path.
If this is right
- FCS data taken under aberrating conditions will yield incorrect diffusion coefficients and concentrations unless the bead-induced distortion is included.
- The point-spread function deviates from the ideal Gaussian shape, so standard fitting routines that assume a Gaussian volume become invalid.
- Quantitative FCS in cells or tissue requires a correction step derived from the same diffraction model to recover accurate molecular parameters.
Where Pith is reading between the lines
- The same bottom-up method could be tested on multiple beads or irregular scatterers to see whether the single-sphere approximation remains useful.
- The model implies that FCS calibration beads themselves could be used to measure and subtract sample-induced aberrations in real time.
- Similar diffraction calculations might improve quantitative analysis in other confocal techniques such as FRAP or single-molecule tracking when optical inhomogeneities are present.
Load-bearing premise
The dominant aberration can be represented by a single dielectric sphere whose full optical effect is captured by the chosen diffraction calculation.
What would settle it
Place a known dielectric bead at a controlled position in the optical path of a confocal FCS setup, record the correlation curve, and compare it directly to the curve predicted by the model; systematic mismatch in amplitude or decay time would falsify the claim.
Figures


read the original abstract
Fluorescence Correlation Spectroscopy (FCS) is a powerful single-molecule technique which allows for measuring motion (diffusion, flow), concentration, and molecular interaction kinetics of fluorescent molecules from picomolar to micromolar concentrations. It has found manifold applications in the physical and life sciences. Many biological/biophysical applications use FCS for measuring the motion and concentration of fluorescently labeled biomolecules in living cells and tissue. However, a correct quantitative evaluation of FCS experiments relies on the accurate knowledge of the fluorescence excitation and detection properties of the used confocal microscope. Using a bottom-up approach, we theoretically study how these properties are affected by the presence of a diffracting dielectric bead within the optical path, and how this changes the outcome of a FCS measurement. This will be important for all applications of FCS under optically non-ideal aberrating conditions.
Editorial analysis
A structured set of objections, weighed in public.
Referee Report
Summary. The manuscript develops a bottom-up diffraction-based model to compute how a single dielectric sphere placed in the optical path alters the excitation and detection point-spread functions of a confocal microscope, and thereby modifies the autocorrelation function and extracted parameters in a fluorescence correlation spectroscopy (FCS) experiment.
Significance. If the numerical implementation is correct and the single-sphere idealization is shown to be representative, the work supplies a concrete computational route for predicting FCS bias under controlled aberrating conditions; this is a useful step toward quantitative FCS in tissue, where similar refractive-index mismatches occur.
major comments (2)
- [Theory section / Eq. defining transmitted field] §3 (or equivalent theory section), Eq. (X) defining the transmitted field after the sphere: the claim that the model is 'bottom-up' and free of fitted parameters is not demonstrated; the refractive index, radius, and axial position of the bead appear to be chosen inputs rather than derived, so the predicted FCS distortion is conditional on those choices.
- [Results / FCS curve comparison] Results section, comparison of aberrated vs. unaberrated FCS curves: the reported change in apparent diffusion coefficient or concentration is shown only for one bead size and position; without a parameter sweep or experimental validation against a known aberrator, it is unclear whether the magnitude of the effect is robust or an artifact of the chosen geometry.
minor comments (2)
- [Methods / Notation] Notation for the electric-field integrals and the subsequent intensity averaging is introduced without a compact reference table; readers must hunt through the text to recover the definitions of E_exc and E_det.
- [Figure captions] Figure captions do not state the numerical aperture, wavelength, or bead refractive index used in each panel; these parameters are essential for reproducibility.
Simulated Author's Rebuttal
We thank the referee for the constructive comments on our manuscript. We respond point-by-point to the major comments below.
read point-by-point responses
-
Referee: [Theory section / Eq. defining transmitted field] §3 (or equivalent theory section), Eq. (X) defining the transmitted field after the sphere: the claim that the model is 'bottom-up' and free of fitted parameters is not demonstrated; the refractive index, radius, and axial position of the bead appear to be chosen inputs rather than derived, so the predicted FCS distortion is conditional on those choices.
Authors: The bottom-up character of the model lies in computing the transmitted field directly from the solution of Maxwell's equations via Mie scattering theory, with no empirical adjustments or fitted parameters entering the field calculation or the subsequent FCS autocorrelation. The refractive index, radius, and axial position are physical inputs that define the specific aberrating geometry under consideration, exactly as the objective NA, wavelength, or pinhole diameter are inputs. The predicted distortion is therefore conditional on those choices by design; the model exists to quantify that dependence. We will add clarifying text in the theory section to make this explicit. revision: partial
-
Referee: [Results / FCS curve comparison] Results section, comparison of aberrated vs. unaberrated FCS curves: the reported change in apparent diffusion coefficient or concentration is shown only for one bead size and position; without a parameter sweep or experimental validation against a known aberrator, it is unclear whether the magnitude of the effect is robust or an artifact of the chosen geometry.
Authors: We agree that a single geometry leaves open the possibility of an artifact. In the revised manuscript we will add calculations for a range of bead radii and axial positions to show that the reported changes in apparent diffusion coefficient and concentration are systematic. Because the work is a theoretical modeling study, experimental validation against a physical aberrator lies outside its present scope, although the numerical implementation is constructed to be directly testable with controlled bead experiments. revision: yes
Circularity Check
No significant circularity in derivation chain
full rationale
The paper describes a bottom-up theoretical modeling approach for FCS measurements affected by a diffracting dielectric bead, relying on diffraction calculations to derive excitation and detection properties. No equations or steps in the provided abstract or description reduce predictions to fitted inputs, self-citations, or definitional equivalences by construction. The central claim rests on independent physical modeling of aberrations rather than renaming known results or smuggling ansatzes via prior self-work, making the derivation self-contained against external benchmarks.
Axiom & Free-Parameter Ledger
Reference graph
Works this paper leans on
-
[1]
Fluorescence correlation spectroscopy. I. Conceptual basis and theory,
E. L. Elson and D. Magde, “Fluorescence correlation spectroscopy. I. Conceptual basis and theory,” Biopolymers 13, 1–27 (1974)
work page 1974
-
[2]
Fluorescence correlation spectroscopy. II. An experimental realiza- tion,
D. Magde, E. L. Elson, and W. W. Webb, “Fluorescence correlation spectroscopy. II. An experimental realiza- tion,” Biopolymers 13, 29–61 (1974)
work page 1974
-
[3]
Fluorescence correlation spectroscopy. III. Uniform translation and laminar flow,
D. Magde, W. W. Webb, and E. L. Elson, “Fluorescence correlation spectroscopy. III. Uniform translation and laminar flow,” Biopolymers 17, 361–376 (1978)
work page 1978
-
[4]
D. Magde, E. Elson, and W. W. Webb, “Thermodynamic fluctuations in a reacting system – measurement by fluorescence correlation spectroscopy,” Phys. Rev. Lett. 29, 705 (1972)
work page 1972
-
[5]
J. Widengren and P. Schwille, “Characterization of photoinduced isomerization and back-isomerization of the cyanine dye cy5 by fluorescence correlation spectroscopy,” J. Phys. Chem. A 104, 6416–6428 (2000)
work page 2000
-
[6]
Electromagnetic diffraction in optical systems-i. an integral representation of the image field,
E. Wolf, “Electromagnetic diffraction in optical systems-i. an integral representation of the image field,” Proc. R. Soc. Lond. A 253, 349–357 (1959)
work page 1959
-
[7]
B. Richards and E. Wolf, “Electromagnetic diffraction in optical systems, ii. structure of the image field in an aplanatic system,” Proc. R. Soc. Lond. A 253, 358–379 (1959)
work page 1959
-
[8]
Modeling Fluorescence Correlation Spectroscopy through an aberrating sphere
A. H. Al-Mohy and N. J. Higham, “Computing the action of the matrix exponential, with an application to exponential integrators,” SIAM J. Sci. Comput. 33, 488–511 (2011). arXiv:1907.06907v1 [physics.optics] 16 Jul 2019
work page internal anchor Pith review Pith/arXiv arXiv 2011
-
[9]
Confocal fluorescence correlation spectroscopy through a sparse layer of scattering objects,
A. Sarkar, J. Gallagher, I. Wang, G. Cappello, J. Enderlein, A. Delon, and J. Derouard, “Confocal fluorescence correlation spectroscopy through a sparse layer of scattering objects,” Optics Express 27, 19382–19397 (2019)
work page 2019
-
[10]
J. Wenger, D. G ´erard, H. Aouani, and H. Rigneault, “Disposable microscope objective lenses for fluorescence correlation spectroscopy using latex microspheres,” Analytical Chemistry 80, 6800–6804 (2008)
work page 2008
-
[11]
Three-dimensional subwave- length confinement of light with dielectric microspheres,
A. Devilez, N. Bonod, J. Wenger, D. G´erard, B. Stout, H. Rigneault, and E. Popov, “Three-dimensional subwave- length confinement of light with dielectric microspheres,” Optics Express17, 2089–2094 (2009)
work page 2089
-
[12]
D. G ´erard, A. Devilez, H. Aouani, B. Stout, N. Bonod, J. Wenger, E. Popov, and H. Rigneault, “Efficient exci- tation and collection of single-molecule fluorescence close to a dielectric microsphere,” JOSA B 26, 1473–1478 (2009)
work page 2009
-
[13]
Fluorescence correlation spectroscopy in living cells,
S. A. Kim, K. G. Heinze, and P. Schwille, “Fluorescence correlation spectroscopy in living cells,” Nature Methods 4, 963 (2007)
work page 2007
-
[14]
M. Dolega, M. Delarue, F. Ingremeau, J. Prost, A. Delon, and G. Cappello, “Cell-like pressure sensors reveal increase of mechanical stress towards the core of multicellular spheroids under compression,” Nature Communi- cations 8, 14056 (2017)
work page 2017
-
[15]
Introduction Fluorescence Correlation Spectroscopy was invented by Magde, Elson and Webb in the early seventies of the last century [1, 2]. It is based on confocal laser scanning microscope equipped with a high-sensitive detector and measures the temporal fluorescence intensity fluctuation which are excited in and detected from the tiny detection volume of ...
-
[16]
Theory 2.1. F ocusing a laser beam through a spherical bead We start by considering the focusing of a linearly polarized laser beam through an ideal lens. Up to an overall constant, the electric field around the focal region (focus positionr0) is described by the following plane wave superposition [6, 7]: E f (r) = ∫∫ Ω dΩ√cos χ A(χ) (ˆep cos ψ− ˆes sin ψ)...
-
[17]
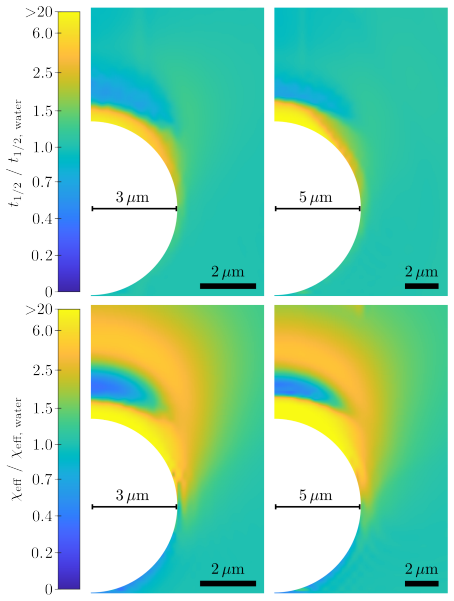
Numerical results We calculate autocorrelation functions g(t) as described in the previous section for glass beads (refractive index n = 1.52) embedded in water ( n = 1.33), a wavelength of λ = 654 nm, and a numerical aperture of the objective of 1.2. If one uses −ℓ≤ m≤ ℓ in the VSH-expansion, both the computation time and the required memory increase app...
-
[18]
Discussion and Conclusion We have presented a rigorous theoretical framework (based on Mie scattering theory) for the calculation of the light intensity distribution of a laser focused though a dielectric bead, and calculated autocorrelation curves for molecules diffusing through such a focus. We find an ex- treme sensitivity of both diffusion time and eff...
work page 2067
discussion (0)
Sign in with ORCID, Apple, or X to comment. Anyone can read and Pith papers without signing in.