Alternative Intersection Designs with Connected and Automated Vehicle
Pith reviewed 2026-05-24 18:14 UTC · model grok-4.3
The pith
Redesigning a conventional diamond interchange as a diverging diamond raises throughput far more than adding connected and automated vehicles.
A machine-rendered reading of the paper's core claim, the machinery that carries it, and where it could break.
Core claim
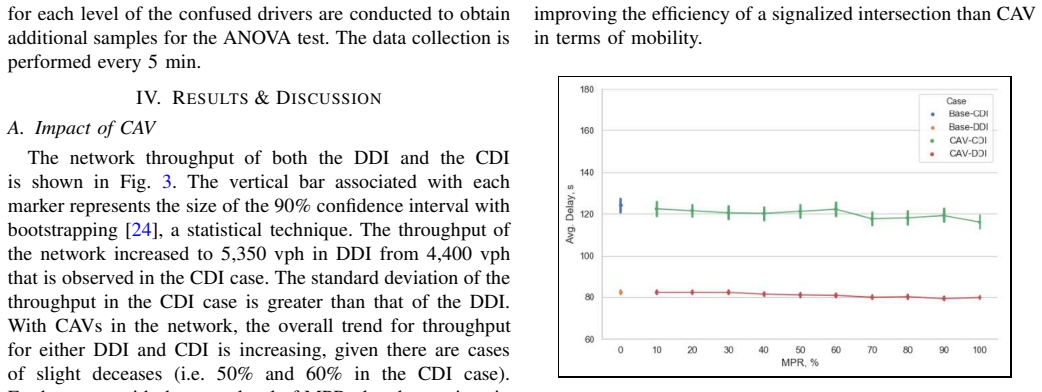
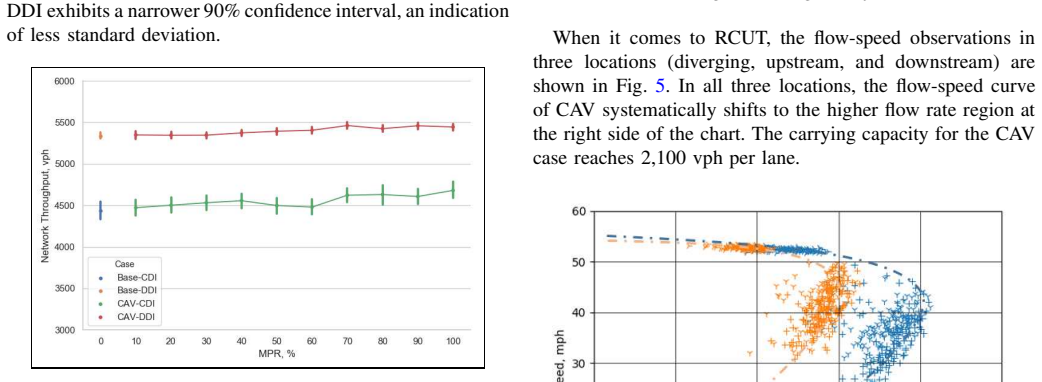
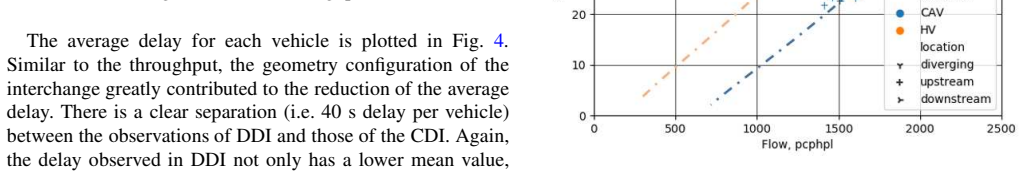
Converting an existing conventional diamond interchange to a diverging diamond interchange improves the throughput of a CDI by 950 vehicles per hour, a near 20% improvement; whereas with full penetration of CAV, the throughput of a CDI is increased only by 300 vehicles per hour. A similar trend is observed in the average delay per vehicle as well. The negative impacts of driver's confusion are of statistical significance according to the ANOVA test.
What carries the argument
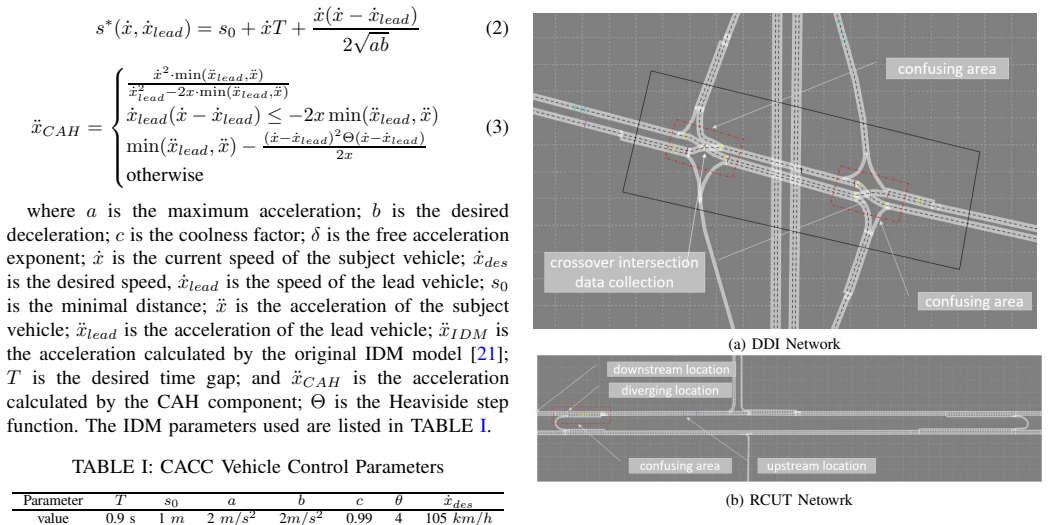
Microscopic traffic simulation that applies the diverging diamond interchange and restricted crossing U-turn layouts to a baseline conventional diamond interchange while varying connected and automated vehicle penetration rates.
If this is right
- The diverging diamond layout produces larger capacity gains than connected and automated vehicle technology alone.
- Driver confusion at alternative intersections reduces performance by a measurable amount.
- Combining layout changes with vehicle automation yields additive benefits, but the geometry change accounts for most of the improvement.
- The same ranking of interventions holds for delay as for throughput.
Where Pith is reading between the lines
- Agencies could achieve quicker capacity relief by prioritizing geometric redesigns over waiting for high automation adoption.
- The relative size of the two effects could help rank which existing interchanges should be converted first.
- Real-world driver adaptation data collected after an actual conversion would test whether the modeled confusion penalty shrinks over time.
Load-bearing premise
The simulation model correctly captures how connected and automated vehicles actually drive and how human drivers react to unfamiliar intersection layouts.
What would settle it
A before-and-after field measurement of hourly vehicle throughput and average delay at an actual interchange before and after conversion to diverging diamond geometry, with and without automated vehicles present.
Figures
read the original abstract
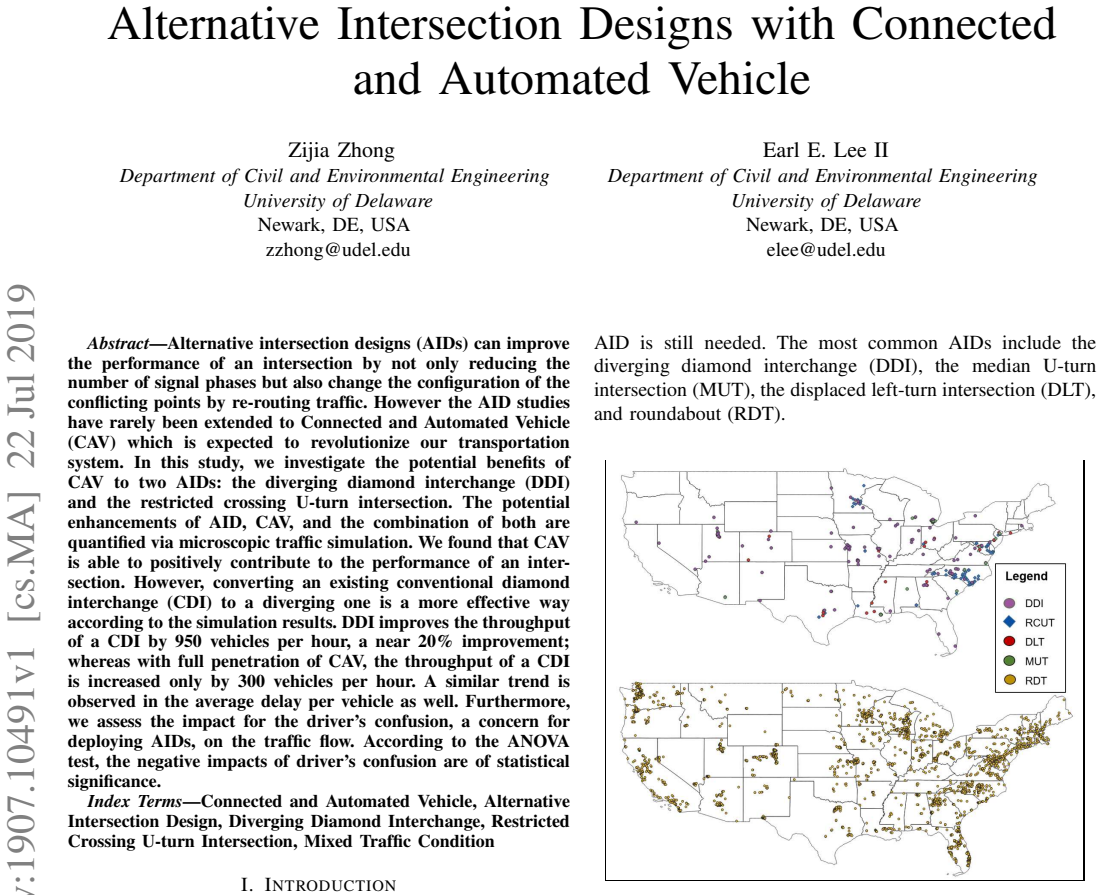
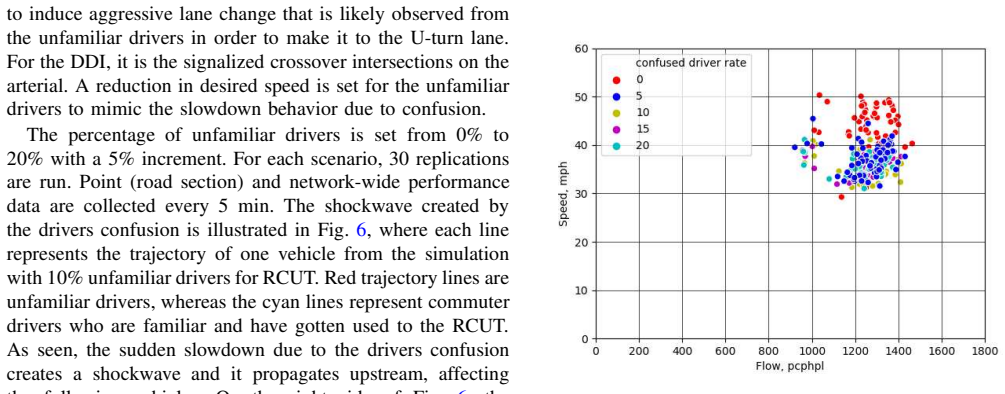
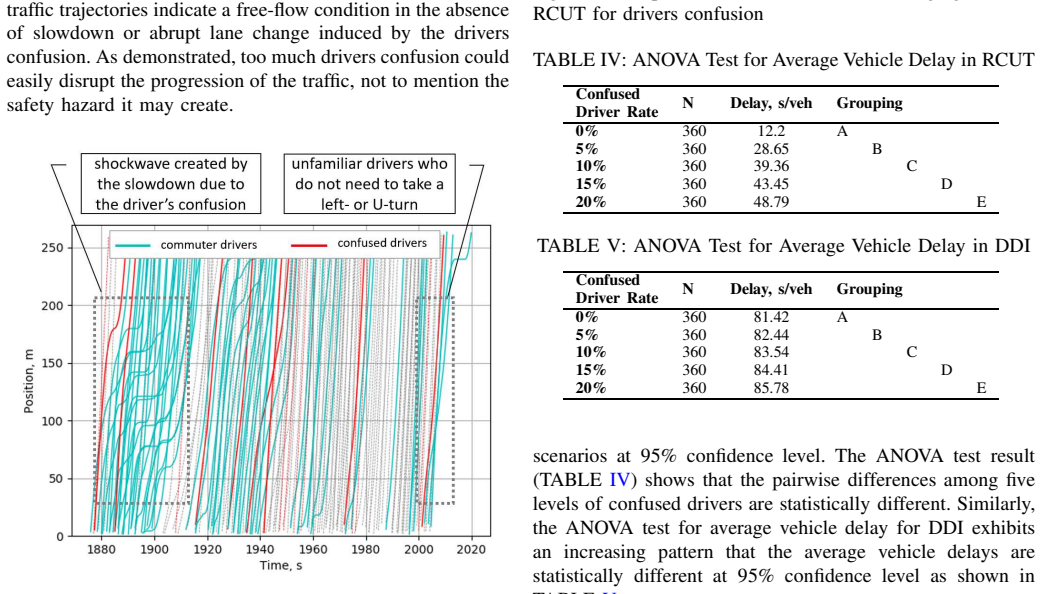
Alternative intersection designs (AIDs) can improve the performance of an intersection by not only reducing the number of signal phases but also change the configuration of the conflicting points by re-routing traffic. However the AID studies have rarely been extended to Connected and Automated Vehicle (CAV) which is expected to revolutionize our transportation system. In this study, we investigate the potential benefits of CAV to two AIDs: the diverging diamond interchange (DDI) and the restricted crossing U-turn intersection. The potential enhancements of AID, CAV, and the combination of both are quantified via microscopic traffic simulation. We found that CAV is able to positively contribute to the performance of an intersection. However, converting an existing conventional diamond interchange (CDI) to a diverging one is a more effective way according to the simulation results. DDI improves the throughput of a CDI by 950 vehicles per hour, a near 20% improvement; whereas with full penetration of CAV, the throughput of a CDI is increased only by 300 vehicles per hour. A similar trend is observed in the average delay per vehicle as well. Furthermore, we assess the impact for the driver's confusion, a concern for deploying AIDs, on the traffic flow. According to the ANOVA test, the negative impacts of driver's confusion are of statistical significance.
Editorial analysis
A structured set of objections, weighed in public.
Referee Report
Summary. The manuscript uses microscopic traffic simulation to compare alternative intersection designs (diverging diamond interchange DDI and restricted crossing U-turn RCUT) against a conventional diamond interchange (CDI), both with and without connected and automated vehicles (CAV). It claims that converting CDI to DDI raises throughput by 950 vehicles per hour (nearly 20%), outperforming the 300 vph gain from full CAV penetration on the original CDI; similar trends hold for average delay. ANOVA indicates that driver confusion has statistically significant negative effects on flow.
Significance. If the simulation model is shown to be realistic, the results would suggest that geometric redesign of interchanges can deliver substantially larger capacity gains than CAV adoption alone, with direct implications for prioritizing infrastructure changes versus technology deployment in transportation planning.
major comments (2)
- [Abstract] Abstract: The central quantitative claim (DDI improves CDI throughput by 950 vph while full CAV penetration improves it by only 300 vph) rests entirely on the microscopic simulation outputs, yet the manuscript supplies no description of the CAV behavioral parameters (headway, reaction time, lane-changing logic at 100% penetration), their sources, calibration procedure, or validation against field data; without these the 950-vs-300 differential cannot be assessed for robustness.
- [Results section (ANOVA)] Results section (ANOVA on driver confusion): Statistical significance is asserted but no effect sizes, F-statistics, degrees of freedom, or sensitivity checks to the confusion parameters are reported; this leaves the practical magnitude of the negative impact unquantified and weakens the claim that confusion is a deployability concern for AIDs.
minor comments (2)
- [Abstract] Abstract: 'assess the impact for the driver's confusion' contains a preposition error and should read 'of the driver's confusion'.
- [Throughout] Throughout: Throughput and delay results are given as point values with no error bars, standard deviations, or indication of the number of simulation replications, reducing interpretability of variability.
Simulated Author's Rebuttal
We thank the referee for the constructive feedback on the simulation methodology and statistical reporting. We address each major comment below and will revise the manuscript to enhance transparency and completeness.
read point-by-point responses
-
Referee: [Abstract] The central quantitative claim (DDI improves CDI throughput by 950 vph while full CAV penetration improves it by only 300 vph) rests entirely on the microscopic simulation outputs, yet the manuscript supplies no description of the CAV behavioral parameters (headway, reaction time, lane-changing logic at 100% penetration), their sources, calibration procedure, or validation against field data; without these the 950-vs-300 differential cannot be assessed for robustness.
Authors: We agree that a dedicated description of the CAV parameters is required for assessing robustness. In the revised manuscript we will add a new subsection in the Methods section specifying the headway, reaction time, and lane-changing parameters used at 100% penetration (based on the Wiedemann model in VISSIM with reduced headways drawn from prior CAV literature). Calibration followed standard procedures from the VISSIM manual adjusted per established studies; we will cite the exact sources. Full field validation for 100% CAV is not possible given the current lack of real-world data at that penetration level, and we will explicitly note this limitation while emphasizing that the 950-vs-300 comparison is intended as a relative simulation-based indicator rather than an absolute prediction. revision: yes
-
Referee: [Results section (ANOVA)] Statistical significance is asserted but no effect sizes, F-statistics, degrees of freedom, or sensitivity checks to the confusion parameters are reported; this leaves the practical magnitude of the negative impact unquantified and weakens the claim that confusion is a deployability concern for AIDs.
Authors: We concur that the ANOVA reporting is incomplete. The revised Results section will report the full ANOVA table including F-statistics, degrees of freedom, p-values, and effect sizes (partial eta-squared). We will also add a sensitivity analysis varying the confusion parameter values and report the resulting changes in throughput to quantify practical significance. These additions will directly support the deployability discussion. revision: yes
Circularity Check
No circularity: throughput and delay results are direct simulation outputs
full rationale
The paper reports throughput gains (DDI +950 vph, CAV +300 vph) and delay metrics obtained from VISSIM microscopic simulations under varying geometries and CAV penetration levels. These quantities are generated by running the simulator on input traffic demands and vehicle behavior parameters; they are not obtained by solving equations whose right-hand sides contain the same quantities, nor by fitting parameters to a subset of the reported results and then re-presenting the fit as a prediction. The ANOVA on driver confusion is likewise a post-simulation statistical test on the generated delay and throughput samples. No self-citation chain, uniqueness theorem, or ansatz is invoked to justify the central comparison. The derivation chain is therefore self-contained against external simulation benchmarks.
Axiom & Free-Parameter Ledger
free parameters (2)
- CAV penetration levels =
100%
- Driver confusion parameters
axioms (1)
- domain assumption Microscopic simulation sufficiently captures comparative traffic dynamics for the chosen intersections and vehicle mixes.
Reference graph
Works this paper leans on
-
[1]
Performance analysi s of parallel flow intersection and displaced left-turn intersection des igns,
A. Dhatrak, P . Edara, and J. Bared, “Performance analysi s of parallel flow intersection and displaced left-turn intersection des igns,” Trans- portation Research Record: Journal of the Transportation R esearch Board, no. 2171, pp. 33–43, 2010
work page 2010
-
[2]
A lternative Intersections and Interchange
Institue for Transportation Research and Education, “A lternative Intersections and Interchange.” [Online]. Available: https://www.google. com/maps/d/u/0/viewer?mid=1MMZKi0RdQqjZjtBxmSTznUVnurY
-
[3]
V ehicl e-infrastructure integration (VII) initiative benefit-cost analysis versio n 2.3 (draft),
V olpe National Transportation Systems Center, “V ehicl e-infrastructure integration (VII) initiative benefit-cost analysis versio n 2.3 (draft),” 2008
work page 2008
-
[4]
Should the diverging diamond interchang e always be considered a diamond interchange form?
G. Chlewicki, “Should the diverging diamond interchang e always be considered a diamond interchange form?” Transportation Research Record, vol. 2223, no. 1, pp. 88–95, 2011
work page 2011
-
[5]
Development of a s ignal optimization model for diverging diamond interchange,
X. Y ang, G.-L. Chang, and S. Rahwanji, “Development of a s ignal optimization model for diverging diamond interchange,” Journal of Transportation Engineering, vol. 140, no. 5, p. 4014010, 2014
work page 2014
-
[6]
Alterna- tive intersections/interchanges: informational report ( AIIR),
W. Hughes, R. Jagannathan, D. Sengupta, and J. E. Hummer, “Alterna- tive intersections/interchanges: informational report ( AIIR),” Tech. Rep., 2010
work page 2010
-
[7]
Evaluation of Grand River Ave nue (M-5/M-102) Safety Improvement Project Before and After St udy,
M. Scheuer and K. L. Kunde, “Evaluation of Grand River Ave nue (M-5/M-102) Safety Improvement Project Before and After St udy,” Michigan Department of Transportation, Lansing , 1996
work page 1996
-
[8]
The Operational and Safety Aspects of the Michigan Design for Divided Highways,
S. Castronovo, P . W. Dorothy, M. C. Scheuer, T. L. Maleck, and Others, “The Operational and Safety Aspects of the Michigan Design for Divided Highways,” V olume I, Michigan State University College of Engineering, 1995
work page 1995
-
[9]
Z. Zhong, L. Joyoung, and L. Zhao, “Evaluations of Manage d Lane Strategies for Arterial Deployment of Cooperative Adaptiv e Cruise Control,” in 96th Transportation Research Board Annual Meeting , Washington DC, USA, 2017
work page 2017
-
[10]
S. Le Vine, X. Liu, F. Zheng, and J. Polak, “Automated car s: Queue discharge at signalized intersections with Assured-Clear -Distance- Ahead’driving strategies,” Transportation Research Part C: Emerging Technologies, vol. 62, pp. 35–54, 2016
work page 2016
-
[11]
K. Y ang, S. I. Guler, and M. Menendez, “Isolated interse ction control for various levels of vehicle technology: Conventional, co nnected, and automated vehicles,” Transportation Research Part C: Emerging Tech- nologies, vol. 72, pp. 109–129, 2016
work page 2016
-
[12]
J. Autey, T. Sayed, and M. El Esawey, “Operational perfo rmance comparison of four unconventional intersection designs us ing micro- simulation,” Journal of Advanced Transportation , vol. 47, no. 5, pp. 536–552, 2013
work page 2013
-
[13]
Upstream signalized c rossover inter- section: optimization and performance issues,
T. Sayed, P . Storer, and G. Wong, “Upstream signalized c rossover inter- section: optimization and performance issues,” Transportation Research Record: Journal of the Transportation Research Board , no. 1961, pp. 44–54, 2006
work page 1961
-
[14]
Di- verging diamond interchange performance evaluation (I-44 and Route 13),
V . Chilukuri, S. Siromaskul, M. Trueblood, T. Ryan, and Others, “Di- verging diamond interchange performance evaluation (I-44 and Route 13),” Missouri. Dept. of Transportation, Tech. Rep., 2011
work page 2011
-
[15]
Travel time comparisons between seven unconventional arterial intersection designs,
J. Reid and J. Hummer, “Travel time comparisons between seven unconventional arterial intersection designs,” Transportation Research Record: Journal of the Transportation Research Board , no. 1751, pp. 56–66, 2001
work page 2001
-
[16]
FHW A tech brief: D rivers’ evaluation of the diverging diamond interchange,
J. Bared, T. Granda, and A. Zineddin, “FHW A tech brief: D rivers’ evaluation of the diverging diamond interchange,” W ashington DC: Turner-Fairbank Highway Research Center . Tech Brief. FHWA-HRT-07- 048, 2007
work page 2007
-
[17]
B. Claros, “Transportation safety modeling and evalua tion: alternative geometric designs, enforcement, and airfield applications ,” 2017
work page 2017
-
[18]
Enhanced intel ligent driver model to access the impact of driving strategies on traffic ca pac- ity,
A. Kesting, M. Treiber, and D. Helbing, “Enhanced intel ligent driver model to access the impact of driving strategies on traffic ca pac- ity,” Philosophical Transactions of the Royal Society A: Mathema ti- cal,Physical and Engineering Sciences , vol. 368, no. 1928, pp. 4585– 4605, 2010
work page 1928
-
[19]
Simulation des Straenverkehrsflusses,
R. Wiedemann, “Simulation des Straenverkehrsflusses, ” Ph.D. disserta- tion, Karlsruhe, 1974
work page 1974
-
[20]
Modelling of rti-elements on multi-lane roads,
——, “Modelling of rti-elements on multi-lane roads,” i n Drive Confer- ence (1991: Brussels, Belgium) , vol. 2, 1991
work page 1991
-
[21]
Congested Tra ffic States in Empirical Observations and Microscopic Simulations,
M. Treiber, A. Hennecke, and D. Helbing, “Congested Tra ffic States in Empirical Observations and Microscopic Simulations,” pp. 1805–1824, 2000
work page 2000
-
[22]
Sr 72/sr 1 diverging diamond interchange,
“Sr 72/sr 1 diverging diamond interchange,” https://www.deldot.gov/ information/projects/SR72-SR1/index.shtml, accessed: 2019-05-01
work page 2019
-
[23]
A policy on geometric desig n of highways and streets,
M. W. Hancock and B. Wright, “A policy on geometric desig n of highways and streets,” 2013
work page 2013
-
[24]
Advanced statistics: boo tstrapping confidence intervals for statistics with difficult distribu tions,
J. S. Haukoos and R. J. Lewis, “Advanced statistics: boo tstrapping confidence intervals for statistics with difficult distribu tions,” Academic emergency medicine, vol. 12, no. 4, pp. 360–365, 2005
work page 2005
-
[25]
Pairwise comparisons for one-way anova,
“Pairwise comparisons for one-way anova,” https://support.minitab. com/en-us/minitab/18/help-and-how-to/modeling-stati stics/anova/ how-to/one-way-anova/interpret-the-results/ all-statistics-and-graphs/ pairwise-comparisons/, accessed: 2018-09-30
work page 2018
discussion (0)
Sign in with ORCID, Apple, or X to comment. Anyone can read and Pith papers without signing in.