Decision Making in Drug Development via Inference on Power
Pith reviewed 2026-05-24 14:17 UTC · model grok-4.3
The pith
Go/No-Go decisions in drug development should use inference on power instead of point estimates from power or probability of success calculations.
A machine-rendered reading of the paper's core claim, the machinery that carries it, and where it could break.
Core claim
We use p-value functions to frame both the probability of success calculation and the typical power calculation as merely producing two different point estimates of power. We demonstrate that Go/No-Go decisions based on either point estimate of power do not adequately quantify and control the risk involved, and instead we argue for Go/No-Go decisions that utilize inference on power for better risk management and decision making.
What carries the argument
p-value functions that represent both classical power calculations and probability of success calculations as point estimates of power
If this is right
- Go/No-Go decisions based on point estimates of power fail to quantify and control risk adequately.
- Inference on power using the full p-value function supplies better risk management for drug development decisions.
- Probability of success calculations are equivalent to one specific point estimate of power under this framing.
- Replacing point estimates with inference on power changes how uncertainty around the treatment effect is handled in practice.
Where Pith is reading between the lines
- The same p-value function approach could be tested in non-drug contexts such as clinical trial design outside pharmaceutical settings.
- Simulation studies could directly compare error rates of point-estimate decisions versus inference-based decisions on synthetic trial data.
- Regulatory bodies might evaluate whether requiring inference on power alters the balance between false positives and false negatives in approval decisions.
Load-bearing premise
P-value functions provide a valid and neutral way to represent both classical power and Bayesian assurance calculations as point estimates without introducing additional assumptions that affect the risk assessment.
What would settle it
A reanalysis of historical drug development programs in which Go/No-Go decisions based on point estimates of power are compared to decisions based on the full p-value function for power, measuring whether the latter yields measurably different risk profiles such as altered rates of program termination or success.
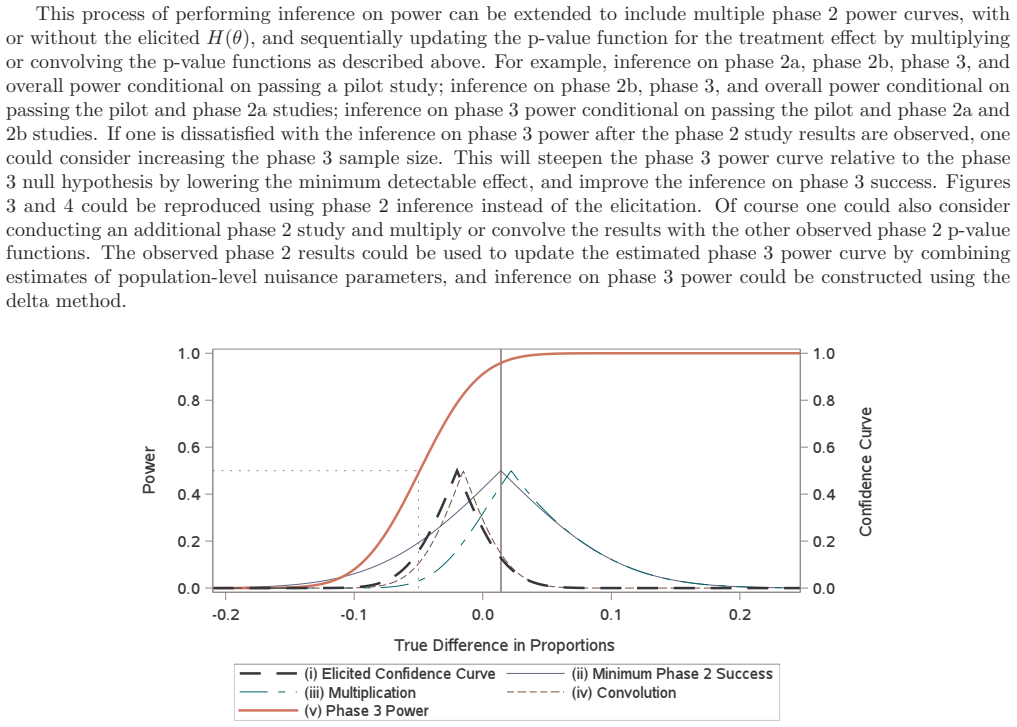
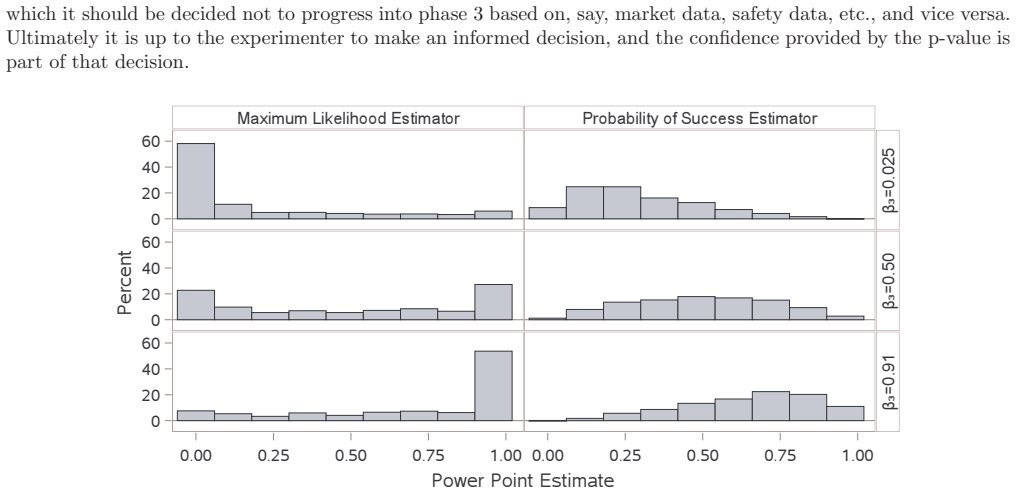
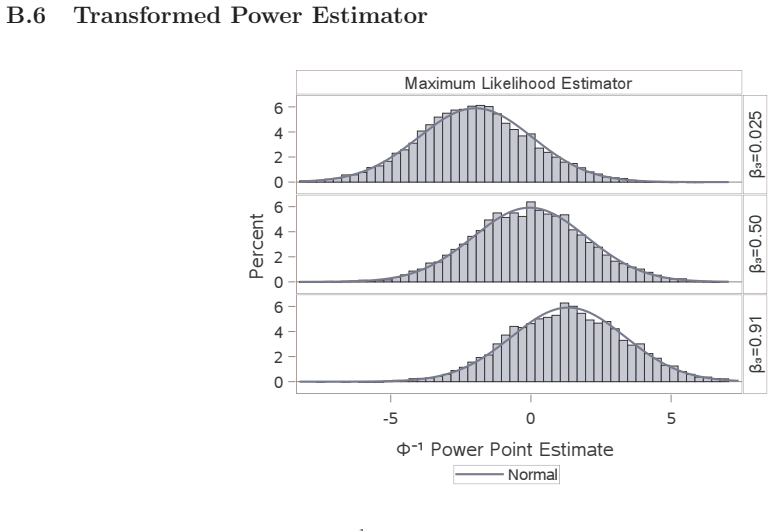
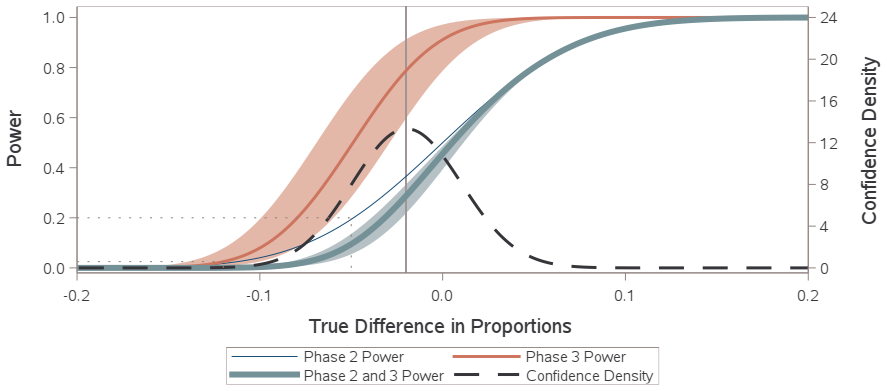
Figures


read the original abstract
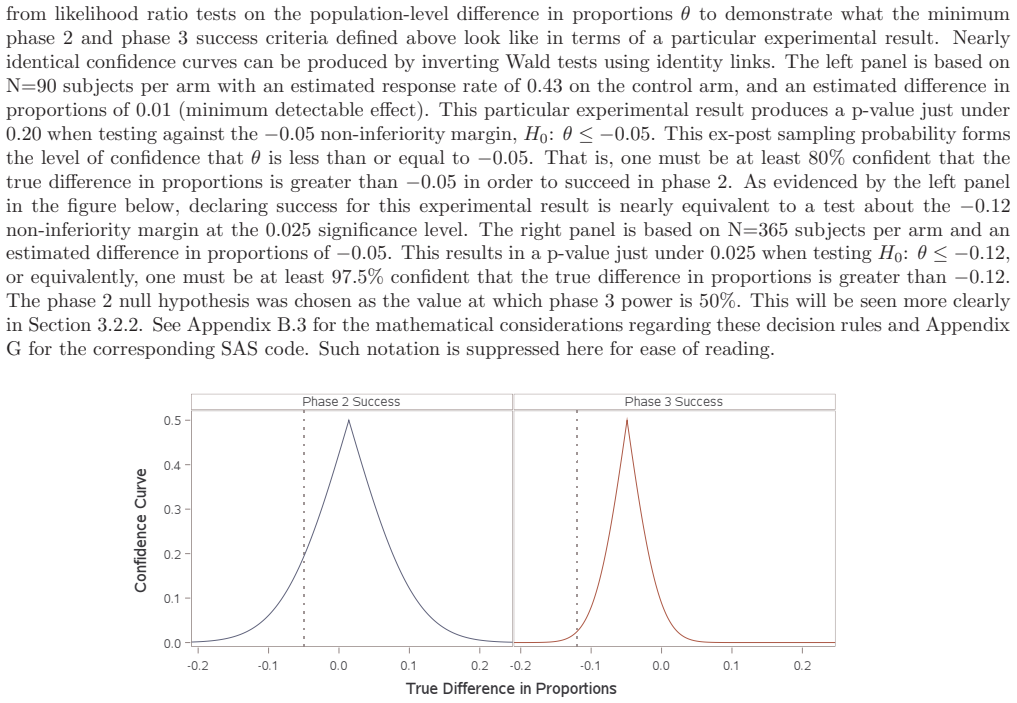
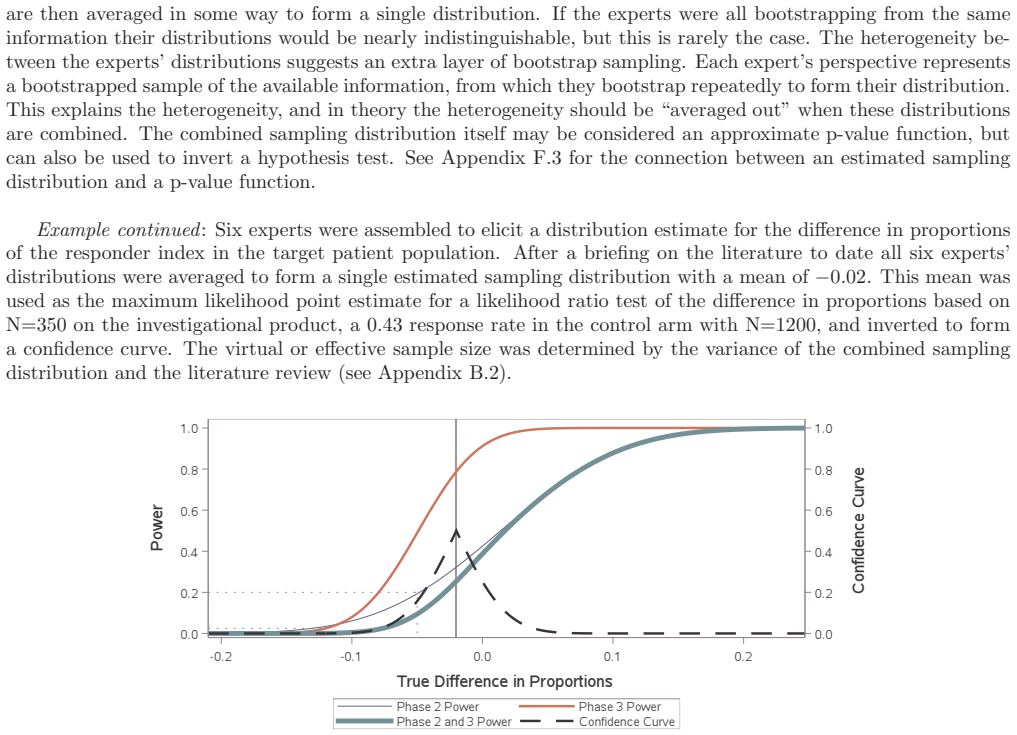
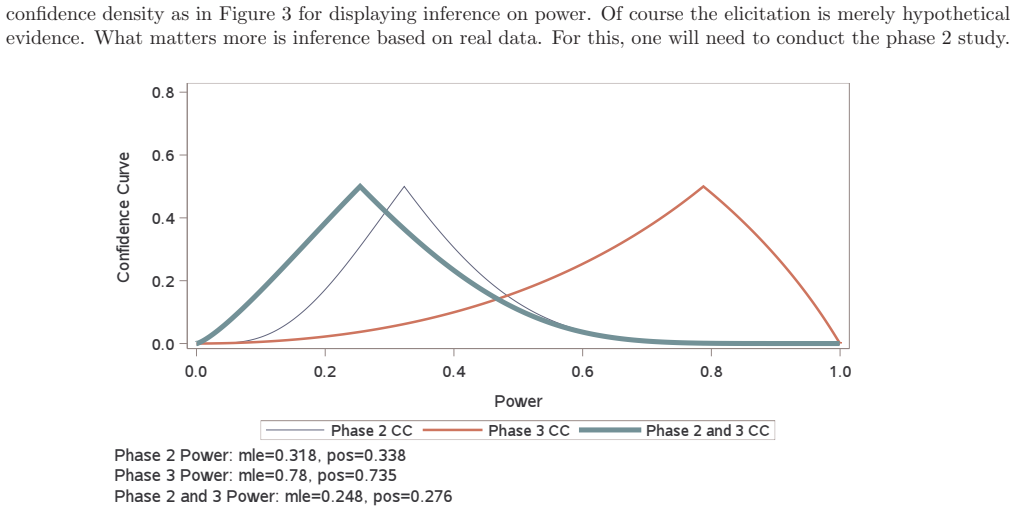
A typical power calculation is performed by replacing unknown population-level quantities in the power function with what is observed in external studies. Many authors and practitioners view this as an assumed value of power and offer the Bayesian quantity probability of success or assurance as an alternative. The claim is by averaging over a prior or posterior distribution, probability of success transcends power by capturing the uncertainty around the unknown true treatment effect and any other population-level parameters. We use p-value functions to frame both the probability of success calculation and the typical power calculation as merely producing two different point estimates of power. We demonstrate that Go/No-Go decisions based on either point estimate of power do not adequately quantify and control the risk involved, and instead we argue for Go/No-Go decisions that utilize inference on power for better risk management and decision making.
Editorial analysis
A structured set of objections, weighed in public.
Referee Report
Summary. The paper claims that standard power calculations (plug-in estimates for unknown parameters) and Bayesian probability of success/assurance calculations are both merely different point estimates of power when viewed through p-value functions. It argues that Go/No-Go decisions based on either point estimate fail to quantify and control risk adequately, and proposes instead using inference on power for improved risk management in drug development.
Significance. If the p-value function framing is shown to be neutral and the inference approach demonstrably improves risk control over point estimates, the work could influence decision frameworks in clinical development by emphasizing uncertainty quantification beyond single numbers. The unification of frequentist and Bayesian power concepts via p-value functions offers a potentially useful perspective if the technical mapping holds without hidden assumptions.
major comments (2)
- [Abstract; Section 2 (p-value function construction)] The central unification in the abstract and early sections treats both plug-in power and assurance as recoverable point evaluations of the same p-value function for power; however, the manuscript must explicitly define this function (including how the sampling distribution maps to power values) and verify that the construction is invariant to choice of test statistic and nuisance-parameter handling, as any dependence would undermine the subsequent claim that point-estimate decisions fail to control risk while inference succeeds.
- [Section 4 (decision examples)] The demonstration that Go/No-Go decisions based on point estimates of power do not control risk (abstract) requires a concrete counter-example or simulation study showing a scenario where the point-estimate rule accepts a program whose true risk exceeds a pre-specified threshold while the inference-on-power rule correctly rejects; without such a load-bearing example tied to the p-value function, the risk-management advantage remains unproven.
minor comments (1)
- [Section 2] Notation for the p-value function should be introduced with a single consistent symbol and distinguished from the usual p-value function for the treatment effect.
Simulated Author's Rebuttal
We thank the referee for the detailed and constructive comments. We address each major comment below, indicating where revisions will be made to the manuscript.
read point-by-point responses
-
Referee: [Abstract; Section 2 (p-value function construction)] The central unification in the abstract and early sections treats both plug-in power and assurance as recoverable point evaluations of the same p-value function for power; however, the manuscript must explicitly define this function (including how the sampling distribution maps to power values) and verify that the construction is invariant to choice of test statistic and nuisance-parameter handling, as any dependence would undermine the subsequent claim that point-estimate decisions fail to control risk while inference succeeds.
Authors: We agree that an explicit definition of the p-value function and a check on invariance are required to support the unification. Section 2 constructs the function by mapping the observed test statistic to the corresponding power value via the sampling distribution under the alternative (i.e., power equals the probability that the test statistic exceeds the critical value when the parameter equals the value implied by the observed statistic). To address the referee's concern, we will add an explicit statement of this mapping and a short verification subsection confirming invariance to standard choices of test statistic and nuisance-parameter handling within the normal-mean and binomial settings used in the paper. These clarifications will be incorporated in the revision. revision: yes
-
Referee: [Section 4 (decision examples)] The demonstration that Go/No-Go decisions based on point estimates of power do not control risk (abstract) requires a concrete counter-example or simulation study showing a scenario where the point-estimate rule accepts a program whose true risk exceeds a pre-specified threshold while the inference-on-power rule correctly rejects; without such a load-bearing example tied to the p-value function, the risk-management advantage remains unproven.
Authors: We accept that a concrete counter-example or simulation is needed to make the risk-control claim load-bearing. We will add a simulation study to Section 4 that generates data under a true effect size distribution, applies both point-estimate rules (plug-in and assurance) and the inference-on-power rule derived from the p-value function, and shows a case in which the point-estimate rules accept the program while the true risk (computed from the full power distribution) exceeds the threshold and the inference rule rejects. The example will be explicitly linked to the p-value function construction. revision: yes
Circularity Check
No circularity detected; reframing of power and assurance via p-value functions is interpretive and does not reduce to self-definition or fitted inputs by construction.
full rationale
The paper's central move is to use p-value functions as a device for viewing both plug-in power and assurance/PoS as point estimates of the same underlying quantity, then to advocate inference on that quantity for decision-making. This is presented as a conceptual unification rather than a derivation in which one quantity is defined in terms of the other via the authors' own equations or a fitted parameter renamed as a prediction. No load-bearing self-citation, uniqueness theorem, or ansatz imported from prior work by the same authors appears in the abstract or described chain. The argument remains self-contained against external benchmarks of power and assurance calculations; the p-value function serves as an external representational tool, not a tautological re-expression of the paper's inputs. Therefore the derivation does not collapse by construction.
Axiom & Free-Parameter Ledger
Reference graph
Works this paper leans on
-
[1]
Ballentine, L. E. (1970). The statistical interpretation of quantum mechanics. Reviews of Modern Physics\/ 42\/ (4), 358
work page 1970
-
[2]
Birnbaum, A. (1961). Confidence curves: An omnibus technique for estimation and testing statistical hypotheses. Journal of the American Statistical Association\/ 56\/ (294), 246--249
work page 1961
- [3]
-
[4]
Casella, G. and R. L. Berger (2002). Statistical inference , Volume 2. Duxbury Pacific Grove, CA
work page 2002
-
[5]
Chuang-Stein, C. (2006). Sample size and the probability of a successful trial. Pharmaceutical Statistics: The Journal of Applied Statistics in the Pharmaceutical Industry\/ 5\/ (4), 305--309
work page 2006
- [6]
-
[7]
Efron, B. (1986). Why isn't everyone a bayesian? The American Statistician\/ 40\/ (1), 1--5
work page 1986
-
[8]
Efron, B. (1998). Ra fisher in the 21st century. Statistical Science\/ , 95--114
work page 1998
-
[9]
Guidance on expert knowledge elicitation in food and feed safety risk assessment
EFSA (2014). Guidance on expert knowledge elicitation in food and feed safety risk assessment. European Food Safety Authority Journal\/ 12\/ (6), 3734
work page 2014
-
[10]
Fraser, D. A. (2011). Is bayes posterior just quick and dirty confidence? Statistical Science\/ 26\/ (3), 299--316
work page 2011
-
[11]
Frewer, P., P. Mitchell, C. Watkins, and J. Matcham (2016). Decision-making in early clinical drug development. Pharmaceutical statistics\/ 15\/ (3), 255--263
work page 2016
-
[12]
Good, I. J. (1965). The estimation of probabilities: an essay on modern bayesian methods . The MIT Press, Cambridge, Massachusetts
work page 1965
-
[13]
Good, I. J. (1966). The estimation of probabilities. J. Inst. Maths Applics\/ 2 , 364--383
work page 1966
-
[14]
Johnson, G. S. (2021). Tolerance and prediction intervals for non-normal models. Researchgate.net\/
work page 2021
-
[15]
King, M. (2009). Evaluating probability of success in oncology clinical trials. In Biopharmaceutical Applied Statistics Symposium
work page 2009
-
[16]
Kirby, S. and C. Chuang-Stein (2017). A comparison of five approaches to decision-making for a first clinical trial of efficacy. Pharmaceutical statistics\/ 16\/ (1), 37--44
work page 2017
-
[17]
Lalonde, R., K. Kowalski, M. Hutmacher, W. Ewy, D. Nichols, P. Milligan, B. Corrigan, P. Lockwood, S. Marshall, L. Benincosa, et al. (2007). Model-based drug development. Clinical Pharmacology & Therapeutics\/ 82\/ (1), 21--32
work page 2007
-
[18]
Lehmann, E. L. (1993). The fisher, neyman-pearson theories of testing hypotheses: one theory or two? Journal of the American statistical Association\/ 88\/ (424), 1242--1249
work page 1993
-
[19]
Oakley, J. and A. O’Hagan (2010). Shelf: The sheffield elicitation framework (version 2.0). school of mathematics and statistics, university of sheffield
work page 2010
-
[20]
O'Hagan, A., J. W. Stevens, and M. J. Campbell (2005). Assurance in clinical trial design. Pharmaceutical Statistics: The Journal of Applied Statistics in the Pharmaceutical Industry\/ 4\/ (3), 187--201
work page 2005
-
[21]
Perezgonzalez, J. D. (2015). Fisher, neyman-pearson or nhst? a tutorial for teaching data testing. Frontiers in Psychology\/ 6 , 223
work page 2015
-
[22]
Rufibach, K., H. U. Burger, and M. Abt (2016). Bayesian predictive power: choice of prior and some recommendations for its use as probability of success in drug development. Pharmaceutical statistics\/ 15\/ (5), 438--446
work page 2016
-
[23]
Saville, B. R., J. T. Connor, G. D. Ayers, and J. Alvarez (2014). The utility of bayesian predictive probabilities for interim monitoring of clinical trials. Clinical Trials\/ 11\/ (4), 485--493
work page 2014
-
[24]
Schr \"o dinger, E. and J. D. Trimmer (1980). The present situation in quantum mechanics: a translation of schr \"o dinger’s ‘cat paradox’ paper. Proceedings of the American Philosophical Society\/ 124\/ (5), 323--338
work page 1980
-
[25]
Schweder, T. and N. L. Hjort (2016). Confidence, likelihood, probability , Volume 41. Cambridge University Press
work page 2016
-
[26]
Shen, J., R. Y. Liu, and M.-g. Xie (2018). Prediction with confidence—a general framework for predictive inference. Journal of Statistical Planning and Inference\/ 195 , 126--140
work page 2018
-
[27]
Singh, K., M. Xie, W. E. Strawderman, et al. (2007). Confidence distribution (cd)--distribution estimator of a parameter. In Complex datasets and inverse problems , pp.\ 132--150. Institute of Mathematical Statistics
work page 2007
-
[28]
Spiegelhalter, D. J., K. R. Abrams, and J. P. Myles (2004). Bayesian approaches to clinical trials and health-care evaluation , Volume 13. John Wiley & Sons
work page 2004
-
[29]
Temple, J. R. and J. R. Robertson (2021). Conditional assurance: the answer to the questions that should be asked within drug development. Pharmaceutical Statistics\/ , 1--10
work page 2021
- [30]
-
[31]
Trzaskoma, B. and A. Sashegyi (2007). Predictive probability of success and the assessment of futility in large outcomes trials. Journal of biopharmaceutical statistics\/ 17\/ (1), 45--63
work page 2007
-
[32]
Wasserstein, R. L., N. A. Lazar, et al. (2016). The asa’s statement on p-values: context, process, and purpose. The American Statistician\/ 70\/ (2), 129--133
work page 2016
-
[33]
Wilks, S. S. (1938). The large-sample distribution of the likelihood ratio for testing composite hypotheses. The annals of mathematical statistics\/ 9\/ (1), 60--62
work page 1938
-
[34]
Xie, M., R. Y. Liu, C. Damaraju, W. H. Olson, et al. (2013). Incorporating external information in analyses of clinical trials with binary outcomes. The Annals of Applied Statistics\/ 7\/ (1), 342--368
work page 2013
-
[35]
Xie, M., K. Singh, and W. E. Strawderman (2011). Confidence distributions and a unifying framework for meta-analysis. Journal of the American Statistical Association\/ 106\/ (493), 320--333
work page 2011
-
[36]
Xie, M.-g. and K. Singh (2013). Confidence distribution, the frequentist distribution estimator of a parameter: A review. International Statistical Review\/ 81\/ (1), 3--39
work page 2013
discussion (0)
Sign in with ORCID, Apple, or X to comment. Anyone can read and Pith papers without signing in.