Quantifying Lifetime Productivity Changes: A Longitudinal Study of 320,000 Late-Career Scientists
Pith reviewed 2026-05-24 04:55 UTC · model grok-4.3
The pith
Half of global top-performing scientists remain top performers across their entire careers.
A machine-rendered reading of the paper's core claim, the machinery that carries it, and where it could break.
Core claim
The global science system is highly immobile: half of global top performers continue their careers as top performers and one-third of global bottom performers as bottom performers. Jumpers-Up and Droppers-Down are extremely rare in science. The chances of moving radically up or down in productivity classes are marginal (1% or less). Our regression analyses show that productivity classes are highly path dependent: there is a single most important predictor of being a top performer, which is being a top performer at an earlier career stage.
What carries the argument
Decile-based productivity classes built from raw Scopus publication counts, followed longitudinally across early-, mid-, and late-career stages for scientists with at least 25 years of output.
If this is right
- Prior membership in the top productivity decile is the dominant predictor of remaining in that decile decades later.
- Bottom-decile scientists show comparable persistence, with roughly one-third staying in the lowest class.
- Radical rank changes between productivity classes occur at rates of 1 percent or lower across the sample.
- Productivity class at any stage strongly forecasts class at later stages in regression models.
Where Pith is reading between the lines
- Sustained high output appears tied to early establishment rather than later acceleration.
- Policies that allocate resources based on early output may compound existing rank differences over time.
- Examining what enables the small fraction of movers to change classes could reveal mechanisms that the aggregate persistence masks.
Load-bearing premise
Decile classes from raw publication counts give a stable, comparable measure of output across disciplines, countries, and career stages without major coverage or normalization biases.
What would settle it
A follow-up analysis of the same scientists using field-normalized impact measures or an independent database that finds more than a few percent moving from bottom to top decile or top to bottom decile between career stages.
Figures


read the original abstract
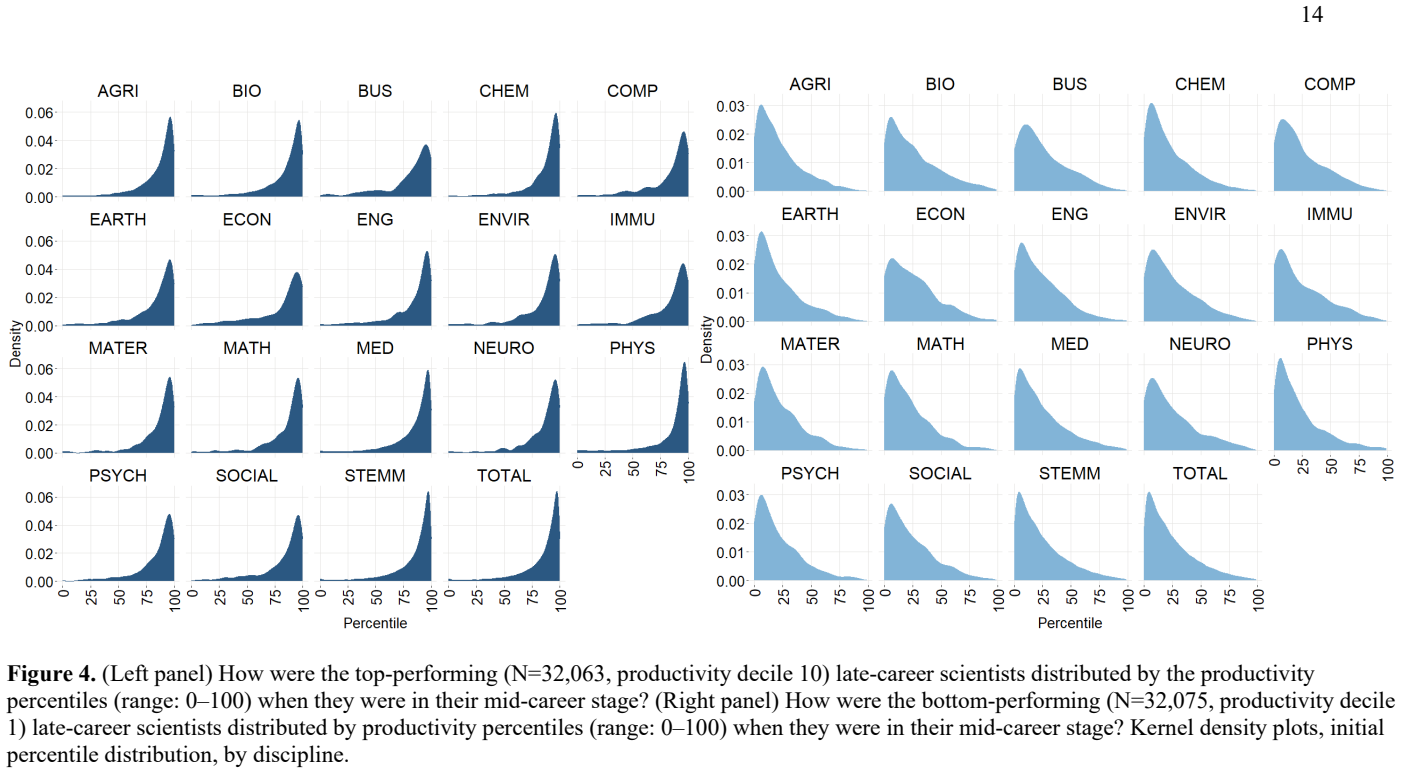
The present study focuses on persistence in research productivity over the course of an individual's entire scientific career. We track 'late-career' scientists - scientists with at least 25 years of publishing experience (N=320,564) - in 16 STEMM (science, technology, engineering, mathematics, and medicine) and social science disciplines from 38 OECD countries for up to five decades. Our OECD sample includes 79.42% of late-career scientists globally. We examine the details of their mobility patterns as early-career, mid-career, and late-career scientists between decile-based productivity classes, from the bottom 10% to top 10% of the productivity distribution. Methodologically, we turn a large-scale bibliometric dataset (Scopus raw data) into a comprehensive, longitudinal data source for research on careers in science. The global science system is highly immobile: half of global top performers continue their careers as top performers and one-third of global bottom performers as bottom performers. Jumpers-Up and Droppers-Down are extremely rare in science. The chances of moving radically up or down in productivity classes are marginal (1% or less). Our regression analyses show that productivity classes are highly path dependent: there is a single most important predictor of being a top performer, which is being a top performer at an earlier career stage.
Editorial analysis
A structured set of objections, weighed in public.
Referee Report
Summary. The manuscript analyzes persistence in research productivity over entire careers using a sample of 320,564 late-career scientists with at least 25 years of experience from Scopus data across 16 disciplines and 38 countries. It reports high immobility in decile-based productivity classes, with approximately 50% of top performers remaining in the top decile and 33% of bottom performers staying in the bottom, and very low rates of radical mobility (1% or less). Regression analyses indicate strong path dependence, with prior top performer status being the strongest predictor of later top performance.
Significance. If the mobility estimates prove robust, the large-scale longitudinal evidence would substantially advance understanding of cumulative advantage and path dependence in scientific careers, with direct relevance to evaluation policies and funding allocation.
major comments (2)
- [Abstract; data construction] Abstract and data/methods sections: Productivity classes are constructed from decile bins on raw (unnormalized) publication counts pooled across 16 disciplines. Without field-specific or career-stage normalization (e.g., per-discipline deciles or fractional counting), disciplines with higher average output rates will disproportionately occupy top deciles, so the reported transition probabilities (50% top stay top; <1% radical jumps) may partly capture field norms rather than individual changes. This directly affects the central immobility and path-dependence claims.
- [Regression analyses] Regression results section: The models treat the same unnormalized decile classes as both predictors and outcomes. Absent robustness checks using alternative metrics (field-year normalized counts, h-index, or citation-based measures), the finding that 'being a top performer at an earlier career stage' is the single most important predictor risks being an artifact of the measurement choice.
minor comments (2)
- [Methods] Clarify the exact productivity metric (total publications? fractional? including or excluding certain document types) and any handling of co-authorship in the methods section.
- [Results tables] Report cell counts, standard errors, and any sensitivity to the 25-year threshold in the transition matrices and regression tables.
Simulated Author's Rebuttal
We thank the referee for the constructive comments, which raise important methodological considerations regarding our measurement of productivity. We address each major comment in turn and indicate the revisions we will undertake.
read point-by-point responses
-
Referee: [Abstract; data construction] Abstract and data/methods sections: Productivity classes are constructed from decile bins on raw (unnormalized) publication counts pooled across 16 disciplines. Without field-specific or career-stage normalization (e.g., per-discipline deciles or fractional counting), disciplines with higher average output rates will disproportionately occupy top deciles, so the reported transition probabilities (50% top stay top; <1% radical jumps) may partly capture field norms rather than individual changes. This directly affects the central immobility and path-dependence claims.
Authors: We acknowledge that the use of raw, unnormalized publication counts pooled across disciplines means that field-specific differences in average output rates could influence decile membership. Our primary aim was to document absolute productivity persistence at the level of the global science system rather than relative standing within fields. To address the concern directly, we will add a set of robustness analyses that recompute deciles within each discipline-year and report the resulting transition matrices and regression results. We will also include a discussion of how the choice of raw versus normalized measures affects interpretation of immobility. revision: yes
-
Referee: [Regression analyses] Regression results section: The models treat the same unnormalized decile classes as both predictors and outcomes. Absent robustness checks using alternative metrics (field-year normalized counts, h-index, or citation-based measures), the finding that 'being a top performer at an earlier career stage' is the single most important predictor risks being an artifact of the measurement choice.
Authors: The regressions rely on the same raw decile classification for both the lagged predictor and the outcome. We will expand the regression section with supplementary models that substitute field-year normalized counts, as well as available citation-based and h-index metrics, to test whether the dominance of prior top-performer status persists under alternative operationalizations. These checks will be reported in a new appendix with a summary in the main text. revision: yes
Circularity Check
No circularity: empirical transitions and regressions on external bibliographic data
full rationale
The paper defines decile productivity classes directly from raw Scopus publication counts for the sampled scientists, then reports observed transition frequencies across career stages and regression coefficients with prior class as a predictor. These quantities are computed outputs from the external dataset rather than quantities defined in terms of themselves or forced by author-fitted parameters. No self-citation chain is invoked to establish uniqueness or to substitute for the mobility statistics. The analysis remains self-contained against the Scopus source without reducing any central claim to a definitional loop.
Axiom & Free-Parameter Ledger
free parameters (2)
- productivity metric
- 25-year threshold
axioms (2)
- domain assumption Scopus provides sufficiently complete and unbiased coverage of publications by late-career scientists in the 16 disciplines across 38 OECD countries.
- domain assumption Decile ranks constructed at different career stages are comparable without additional normalization for discipline, collaboration size, or career length.
Reference graph
Works this paper leans on
-
[1]
Abramo, G., D’Angelo, C. A., & Caprasecca, A. (2009). The contribution of star scientists to overall sex differences in research productivity. Scientometrics, 81(1), 137–156. Abramo, G., D’Angelo, C. A., & Soldatenkova, A. (2017). An investigation on the skewness patterns and fractal nature of research productivity distributions at field and discipline le...
-
[2]
Dusdal, J., & Powell, J. J. W. (2021). Benefits, motivations, and challenges of international collaborative research: A sociology of science case study. Science and Public Policy, 48(1), 235–245. Fox, M. F. (1983). Publication productivity among scientists: A critical review. Social Studies of Science, 13(2), 285–305. Fox, M. F., & Mohapatra, S. (2007). S...
work page 2021
-
[3]
Heckman, J. J., & Moktan, S. (2018). Publishing and promotion in economics. The tyranny of the Top Five. NBER Working Paper 25093. Hermanowicz, J. (2012). The sociology of academic careers: Problems and prospects. In J. C. Smart & M. B. Paulsen (Eds.), Higher education: Handbook of theory and research (pp. 207–248). Springer. Horta, H., & Santos, J. M. (2...
work page 2018
-
[4]
Kwiek, M. (2016). The European research elite: A cross-national study of highly productive academics across 11 European systems. Higher Education, 71(3), 379–397 Kwiek, M. (2018). High research productivity in vertically undifferentiated higher education systems: Who are the top performers? Scientometrics, 115(1), 415–462. Kwiek, M. (2021). What large-sca...
work page 2016
-
[5]
Kwiek, M., & Roszka, W. (2024b). Are scientists changing their research productivity classes when they move up the academic ladder? Innovative Higher Education, Online first, 1–40. https://doi.org/10.1007/s10755-024-09735-3. Kwiek, M., & Szymula, Ł. (2024). Quantifying attrition in science: A cohort-based, longitudinal study of scientists in 38 OECD count...
-
[6]
35 Lindahl, J. (2018). Predicting research excellence at the individual level: The importance of publication rate, top journal publications, and top 10% publications in the case of early career mathematicians. Journal of Informetrics, 12(2), 518–533. Liu, L., Jones, B.F., Uzzi, B., & Wang, D.. (2023). Data, measurement and empirical methods in the science...
-
[7]
Preston, A. E. (2004). Leaving science. Occupational exit from scientific careers. Russell Sage Foundation. Priem, J., Piwowar, H., & Orr, R. (2022). OpenAlex: A fully-open index of scholarly works, authors, venues, institutions, and concepts. ArXiv. https://arxiv.org/abs/2205.01833 Rørstad, K., & Aksnes, D. W. (2015). Publication rate expressed by age, g...
work page internal anchor Pith review Pith/arXiv arXiv doi:10.1371/journal.pone.0294562 2004
-
[8]
Way, S. F., Morgan, A. C., Clauset, A., & Larremore, D. B. (2017). The misleading narrative of the canonical faculty productivity trajectory. Proceedings of the National Academy of Sciences, 114(44), E9216–E9223. 10.1073/pnas.1702121114 Weingart, P. (2004). Impact of bibliometrics upon the science system: inadvertent consequences? In H. F. Moed, W. Glänze...
-
[9]
37 5.54 6.83 8.58 11.11 15.72 89.39 STEMM 0.00 1.06 2.34 3.43 4.54 5.78 7.36 9.20 12.18 17.81 221.27 TOTAL 0.00 1.06 2.34 3.29 4.37 5.54 6.83 8.58 11.11 15.72 89.39 40 Journal prestige–normalized (exponential) approach to individual research productivity If a linear function was used, the value of an article that is published in the journal in the 99th jo...
work page 2023
discussion (0)
Sign in with ORCID, Apple, or X to comment. Anyone can read and Pith papers without signing in.