REVIEW 3 major objections 5 minor 18 references
Application of Machine Learning Models for Carbon Monoxide and Nitrogen Oxides Emission Prediction in Gas Turbines
T0 review · 3 major / 5 minor · reviewed 2026-08-10 · deepseek-v4-flash
Pith's one-line read This paper claims that K-nearest neighbors predicts CO and NOx emissions from a steady-state gas-turbine dataset more accurately than seven alternative models, making it the strongest candidate for integration into a Predictive Emission…
desk verdict A competent industrial case study whose own Table 1 contradicts its headline claim that KNN consistently beats everything. read the letter →
The pith
A machine-rendered reading of the paper's core claim, the machinery that carries it, and where it could break.
The reading
What carries the argument
The argument is carried by a side-by-side evaluation protocol: all models train on the same 113,675-row steady-state dataset, each with tailored preprocessing (standardization for most models, raw features for trees and XGBoost, a sliding window for LSTM) and hyperparameters tuned to minimize validation MSE, and are then ranked by normalized MSE, RMSE, MAE, and MAPE on the test set. Within that protocol the decisive mechanism is KNN's distance-weighted averaging over its four closest operational neighbors: it predicts an emission value by finding past operating points similar to the current one, rather than fitting a global formula, which suits the complex, non-linear emission patterns the paper finds in the data.
What would settle it
Run all eight models on the same 113,675 rows with several random and chronological train/test splits, keeping the stated preprocessing and hyperparameters: if the NOx MAPE distributions of KNN and GRU overlap substantially across splits, the paper's superiority claim is not stable.
Extended reading notes
Core claim
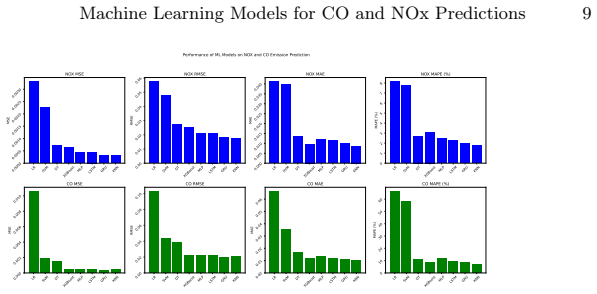
On its own terms, the paper's discovery is that the K-nearest neighbors regressor, using four distance-weighted neighbors, posts the best overall accuracy on this dataset: the lowest MSE, RMSE, MAE, and MAPE for NOx (0.00030, 0.01741, 0.00864, and 1.76%) and the lowest MAE and MAPE for CO (0.01020 and 6.91%). One nuance in the table is that GRU has the lowest CO MSE and RMSE, so KNN's claim to the top rests mainly on NOx plus the CO error metrics that penalize typical rather than large errors. The authors read the pattern as consistent superiority and conclude KNN is highly suitable for integration into a Predictive Emission Monitoring System, with GRU, LSTM, and XGBoost also performing well and linear models, especially linear regression at 66.3% MAPE on CO, judged inadequate.
Load-bearing premise
The entire ranking depends on a single train/test split that the paper never describes, so the reported margin, about two tenths of a percentage point in NOx MAPE, might not survive a different split.
Editorial extensions
If this is right
- KNN is accurate enough on both pollutants to be a leading candidate for integration into Predictive Emission Monitoring Systems.
- Non-linear models as a class dominate linear ones on this data, with Linear Regression's 66.3% MAPE on CO marking it as unsuited to the task.
- GRU, LSTM, and XGBoost are credible alternatives, with GRU attaining the lowest CO MSE and RMSE.
- Accurate ML-based prediction allows operators to shift from after-the-fact compliance checks to real-time emission adjustments.
- The tabulated metrics provide a benchmark of eight models on a common dataset for future PEMS research.
Reading between the lines
- Because the paper reports a single train/test split whose construction is never described, the small margins between KNN and GRU (about 0.2 percentage points in NOx MAPE) could invert under resampling; testing across several splits is a direct next step.
- The dataset covers only steady-state full-load operation, so the ranking says nothing about startup, shutdown, or transient regimes, where emission spikes are largest; extending the comparison to those regimes is the most consequential test.
- GRU's win on CO MSE and RMSE while KNN wins on CO MAE and MAPE shows the 'best model' verdict depends on which error metric regulators weight, so a deployment choice would need a metric aligned with regulatory limits.
- The recurrent models were given only 100 training epochs at fixed learning rates, so the comparison may under-represent what LSTM and GRU could reach with proper tuning.
Signed reviews
Editorial analysis
A structured set of objections, weighed in public.
Referee Report
Summary. The paper reports a comparative evaluation of eight machine learning models (Linear Regression, SVM, Decision Trees, XGBoost, MLP, LSTM, GRU, and KNN) for predicting CO and NOx emissions from gas turbines, using a proprietary 113,675-row steady-state dataset. The authors describe preprocessing, per-model hyperparameters, and report normalized MSE, RMSE, MAE, and MAPE on a test set. The abstract and conclusions claim that KNN consistently outperformed all other models and is therefore most suitable for predictive emission monitoring systems (PEMS).
Significance. If the claimed ranking were rigorously established, the paper could be a useful applied benchmark for PEMS model selection. The use of a real industrial dataset is a potential strength, and the comparison across both traditional and deep learning models is appropriate in scope. However, the significance is severely limited by the fact that the paper's central claim is contradicted by its own reported results for CO, and by the absence of any reproducible experimental protocol (no train/test split, no error bars, no statistical tests, no code or data release). As it stands, the paper does not provide a defensible basis for preferring KNN over the other models, so its practical and scientific contribution is marginal.
major comments (3)
- [Section 5 (Conclusion) and Table 1] The conclusion that "KNN consistently outperformed other models" is contradicted by Table 1 for CO emissions. For CO, GRU achieves lower MSE (0.00036 vs 0.00041) and lower RMSE (0.01896 vs 0.02033) than KNN, while KNN only wins on MAE (0.01020 vs 0.01062) and MAPE (6.90689% vs 8.34426%). Section 4.3 itself acknowledges that GRU achieves the lowest MSE and RMSE for CO. Therefore the central claim is not supported by the paper's own data; the authors would need to either weaken the conclusion to a per-metric, per-pollutant statement or provide a principled justification for why MAE/MAPE should be decisive over squared-error metrics.
- [Section 4.1 and 4.2 (Data Collection and Training Setup)] The experimental protocol is underspecified to the point of unreproducibility. The paper never states how the 113,675 rows were split into training, validation, and test sets, whether the split respects temporal order (which matters for time-series data), what window size was used for the LSTM and GRU inputs, whether the target variables were standardized, or how the reported 'normalized' metrics were computed. Without these details, the ranking in Table 1 cannot be independently checked, and the results could change under a different split or preprocessing choice.
- [Section 4.3 (Results and Discussion)] The paper reports a single run per model with no confidence intervals, standard deviations, or statistical significance tests. Several metrics are very close: for NOx, KNN's MSE (0.00030) and GRU's MSE (0.00032) differ by about 6%, which may well be within run-to-run noise. The claim that KNN 'consistently' outperforms is therefore not statistically established. The authors should report multiple runs with different seeds, error bars, or at least a significance test (e.g., paired bootstrap or Wilcoxon) to support the ranking.
minor comments (5)
- [Throughout] There are numerous formatting and typographical issues: 'T raining Setup' in Section 4.2, 'T able 1' in Section 4.3, LaTeX artifacts such as '$num_epochs' and '$learning_rate' in the GRU paragraph, and an incomplete sentence in the Decision Trees paragraph where the model name is truncated to 'G'.
- [Figure 2] Figure 2 is described as a 'histogram plot' but the subplots are bar charts of metric values per model; the caption should be corrected and the y-axis labels are missing.
- [Section 3 (Methodology)] The description of KNN says it is used for 'classification problems,' but in this paper it is used as a regressor; this should be corrected for clarity.
- [Section 4.1] The dataset is described as containing 13 numerical variables, but the paper does not list them or cite a public source; if the dataset is proprietary, this should be stated explicitly, while a full feature list would help readers assess the modeling setup.
- [Equation (2)] The MAPE formula is undefined when yi = 0; since emission measurements can be near zero, the paper should discuss how such cases were handled in the normalized target space.
Circularity Check
No significant circularity: standard supervised learning benchmark with no self-citation chain or definitional reduction; the internal inconsistency in the conclusion is a correctness issue, not circularity.
full rationale
The paper is an empirical model comparison. Each model is trained on historical gas-turbine data and evaluated on a test set using standard metrics (MSE, RMSE, MAE, MAPE). Hyperparameters are tuned on a validation set by minimum MSE, which is a conventional fitting procedure, not a hidden circular step. There is no theoretical derivation that reduces to its own inputs, and no load-bearing self-citation: the references are standard ML and PEMS literature, not prior work by this paper's authors invoked to justify the central claim. The claim that KNN 'consistently outperformed other models' is contradicted by the paper's own Table 1 for CO, where GRU has lower MSE and RMSE, but that is an internal correctness/consistency problem, not circularity. The unreported train/test split and lack of code are reproducibility concerns, not definitional equivalence. Accordingly, no circular step can be exhibited with quotations, and the appropriate finding is no significant circularity.
Assumptions & free parameters
free parameters (4)
- KNN n_neighbors =
4
- KNN weights =
distance
- SVM C (CO) =
100
- GRU/LSTM window size =
unspecified
assumptions (4)
- domain assumption The 113,675 recorded rows under ABC mode are a representative sample of operational conditions.
- domain assumption A single, unspecified train/test split yields a stable model ranking.
- domain assumption The 13 numerical variables are sufficient predictors for CO and NOx.
- domain assumption Validation MSE is a reliable proxy for test performance.
Cite this review
Pith. "Pith review of Application of Machine Learning Models for Carbon Monoxide and Nitrogen Oxides Emission Prediction in Gas Turbines." pith.science (2026). https://pith.science/paper/654WUI62
@misc{pith2026250117865,
  author       = {Pith},
  title        = {Pith review of: Application of Machine Learning Models for Carbon Monoxide and Nitrogen Oxides Emission Prediction in Gas Turbines},
  year         = {2026},
  howpublished = {\url{https://pith.science/paper/654WUI62}},
  note         = {Machine review of arXiv:2501.17865}
}
read the original abstract
This paper addresses the environmental impacts linked to hazardous emissions from gas turbines, with a specific focus on employing various machine learning (ML) models to predict the emissions of Carbon Monoxide (CO) and Nitrogen Oxides (NOx) as part of a Predictive Emission Monitoring System (PEMS). We employ a comprehensive approach using multiple predictive models to offer insights on enhancing regulatory compliance and optimizing operational parameters to reduce environmental effects effectively. Our investigation explores a range of machine learning models including linear models, ensemble methods, and neural networks. The models we assess include Linear Regression, Support Vector Machines (SVM), Decision Trees, XGBoost, Multi-Layer Perceptron (MLP), Long Short-Term Memory networks (LSTM), Gated Recurrent Units (GRU), and K-Nearest Neighbors (KNN). This analysis provides a comparative overview of the performance of these ML models in estimating CO and NOx emissions from gas turbines, aiming to highlight the most effective techniques for this critical task. Accurate ML models for predicting gas turbine emissions help reduce environmental impact by enabling real-time adjustments and supporting effective emission control strategies, thus promoting sustainability.
Figures

Reference graph
Works this paper leans on
-
[1]
Si, M., Tarnoczi, T., Wiens, B. & Du, K. Development of predictive emissions monitoring system using open source machine learning library–Keras: A case study on a cogeneration unit.IEEE Access. 7 pp. 113463-113475 (2019)
work page 2019
-
[2]
An experimentally verified NOx emission model for gas turbine com- bustors
Hung, W. An experimentally verified NOx emission model for gas turbine com- bustors. Turbo Expo: Power For Land, Sea, And Air . 79771 pp. V01BT02A009 (1975)
work page 1975
-
[3]
Rizk, N. & Mongia, H. Semianalytical correlations for NOx, CO, and UHC emis- sions. (1993)
work page 1993
- [4]
- [5]
-
[6]
Saiepour, M., Schofield, N., Leden, B., Niska, J., Link, N., Unamuno, I. & Gomes, J. Development and assessment of predictive emission monitoring systems (PEMS) modelsinthesteelindustry. Proc. Iron Steel Technol. Conf.. 2pp.1121-1132(2006)
work page 2006
-
[7]
Vanderhaegen, E., Deneve, M., Laget, H., Faniel, N. & Mertens, J. Predictive emissions monitoring using a continuously updating neural network.Turbo Expo: Power For Land, Sea, And Air . 43970 pp. 769-775 (2010)
work page 2010
-
[8]
& Others Predicting CO and NOxemissions from gas turbines: novel data and abenchmark PEMS..TURKISH J
Kaya, H., Tüfekci, P., Uzun, E. & Others Predicting CO and NOxemissions from gas turbines: novel data and abenchmark PEMS..TURKISH J. Electr. Eng. Com- put. Sci.. 27, 4783-4796 (2019)
work page 2019
Show all 18 references
-
[9]
Environmental Pollution Prediction of NOx by Process Analysis and Predictive Modelling in Natural Gas Turbine Power Plants.ArXiv Preprint arXiv:2011.08978
Rezazadeh, A. Environmental Pollution Prediction of NOx by Process Analysis and Predictive Modelling in Natural Gas Turbine Power Plants.ArXiv Preprint arXiv:2011.08978. (2020)
2020 arXiv
-
[10]
Si, M. & Du, K. Development of a predictive emissions model using a gradient boosting machine learning method. Environmental Technology & Innovation . 20 pp. 101028 (2020)
2020
-
[11]
Explainable Predictions of Industrial Emissions.2021 IEEE Inter- national IOT, Electronics And Mechatronics Conference (IEMTRONICS)
Chawathe, S. Explainable Predictions of Industrial Emissions.2021 IEEE Inter- national IOT, Electronics And Mechatronics Conference (IEMTRONICS) . pp. 1-7 (2021)
2021
-
[12]
& Nikolskii K
Kochueva, O. & Nikolskii K. Data Analysis and Symbolic Regression Models for Predicting CO and NOx Emissions from Gas TurbinesComputation vol. 9, no. 12, p. 139, Dec. 2021
2021
-
[13]
dos Santos Coelho, L., Ayala, H. V. H. & Mariani, V. C. CO and NOx emissions prediction in gas turbine using a novel modeling pipeline based on the combination of deep forest regressor and feature engineeringFuel vol. 355, p.129366, Jan. 2024
2024
-
[14]
& Hastie, T
Zou, H. & Hastie, T. Regularization and variable selection via the elastic net. JRSS-B. 67, 301-320 (2005)
2005
-
[15]
& Guestrin, C
Chen, T. & Guestrin, C. Xgboost: A scalable tree boosting system.Proceedings Of The 22nd Acm Sigkdd International Conference On Knowledge Discovery And Data Mining. pp. 785-794 (2016)
2016
-
[16]
& Schmidhuber, J
Hochreiter, S. & Schmidhuber, J. Long Short-term Memory.Neural Computation. 9 pp. 1735-80 (1997,12)
1997
-
[17]
& Williams, R
Rumelhart, D., Hinton, G. & Williams, R. Learning representations by back- propagating errors. Nature. 323, 533-536 (1986)
1986
-
[18]
& Cadima, J
Jolliffe, I. & Cadima, J. Principal component analysis: a review and recent devel- opments. Phil. Trans. R. Soc. A . 374, 20150202 (2016)
2016
Reviewed August 10, 2026 · model on record in the stance chip above.
Discussion (0). Continue with ORCID to comment.