REVIEW 3 major objections 6 minor 1 cited by
Evolution of X-ray Gas in SN 1987A from 2007 to 2021: Ring Fading and Ejecta Brightening Unveiled through Differential Emission Measure Analysis
T0 review · 3 major / 6 minor · reviewed 2026-08-10 · deepseek-v4-flash
Pith's one-line read By tracking SN 1987A's full X-ray temperature distribution from 2007 to 2021, this paper shows the equatorial ring is fading while shock-heated ejecta are brightening into a 3-5 keV component.
desk verdict Useful 14-epoch DEM evolution of SN 1987A, with a central trend that is likely real; the flashy new 3-5 keV ejecta peak is still hostage to an oversimplified net–kT power law. read the letter →
The pith
A machine-rendered reading of the paper's core claim, the machinery that carries it, and where it could break.
The reading
What carries the argument
The load-bearing object is the differential emission measure (DEM) model c7pvnei, an extension of the XSPEC c6pvmkl model to non-equilibrium-ionization plasmas. It represents the plasma with 40 temperature bins logarithmically spaced between 0.1 and 10 keV; each bin contributes a single vnei (non-equilibrium ionization) spectrum with temperature T_i and emission measure given by a Chebyshev polynomial of order 7 in log-temperature. To keep the fit tractable, the model assumes the ionization parameter at each temperature follows a single power law, τ(T) = τ_1keV (T/1 keV)^β, plus a single set of metal abundances across all bins. The result is a quasi-continuous temperature distribution that can be compared directly, point by point, with the continuous emission-measure distribution extracted from MHD simulations, which is precisely what the paper does to identify the ring and ejecta components.
What would settle it
Re-fit the same spectra while letting the ionization parameter vary freely at each temperature bin, or fix it to the temperature-dependent values from the MHD simulations used in the paper, and check whether the 3–5 keV secondary peak and the post-2014 decline of the 0.5–1 keV peak persist; if they vanish, they are artifacts of the assumed power-law ionization relation.
Extended reading notes
Core claim
The paper's central discovery is that the X-ray-emitting plasma in SN 1987A has been undergoing a slow regime change. Using a Chebyshev-parameterized DEM model (c7pvnei) with 40 temperature bins from 0.1 to 10 keV, the authors reconstruct the continuous emission measure distribution at 14 epochs. In all epochs the distribution contains a major peak at ~0.5–1 keV and a tail to ≳5 keV, but the evolution is especially clear: the major peak's emission measure rises to a maximum around 2011–2014 and then declines, while the tail's emission measure increases continuously and in 2020–2021 appears as a secondary peak at ~3–5 keV. The observed DEM profiles agree with MHD simulation predictions, allowing the authors to attribute the major peak to the shocked equatorial ring and the secondary peak to reverse-shock-heated ejecta. The average metal abundances derived from the DEM are systematically higher than those from discrete-temperature fits, and the Fe K line centroid has dropped from ~6.65–6.7 keV to ≶6.6 keV, both of which point to a growing contribution from metal-poorer, less-ionized outer ejecta.
Load-bearing premise
The weakest link is the assumption that the ionization age of every plasma component is a single power-law function of temperature, which the paper itself calls 'over-simplified'; if the real relation differs by component, the reconstructed DEM peaks—including the claimed secondary ejecta peak—could shift or be spurious.
Editorial extensions
If this is right
- The equatorial ring of SN 1987A is now past its X-ray peak; its soft X-ray flux and surface brightness should continue to decline as the forward shock moves into lower-density material.
- The newly shocked ejecta will become the dominant thermal X-ray source over the next several years, offering a time-resolved view of reverse-shock heating in a young remnant.
- Because the DEM-fit abundances are higher than those from two- or three-temperature fits, earlier abundance estimates for SN 1987A are likely biased low, and similar biases may affect other SNR abundance measurements.
- The Fe K centroid decline predicts that the average iron ionization state will keep dropping until the reverse shock reaches the metal-rich core, at which point line centroids and abundances should rise again.
- The DEM-vs-simulation comparison provides a template for using continuous temperature distributions instead of discrete components when connecting SNR X-ray spectra to hydrodynamic models.
Reading between the lines
- Extending the same DEM analysis to the pre-2007 Chandra LETG/HETG epochs would test whether the major-peak emission measure indeed peaked around 2011–2014, or whether the apparent turnover is a model artifact.
- The 3–5 keV secondary peak should be visible in broadband hard X-ray imaging; targeted NuSTAR or future high-resolution missions may be able to image the ejecta component separately from the ring.
- Relaxing the power-law ionization assumption by fixing τ(T) to the MHD-simulated values for each component would turn the DEM fit into a stricter test of the simulations and would reveal how much of the secondary peak is required by the data rather than by the assumed relation.
- If the Fe K centroid decline is confirmed at higher significance with future microcalorimeter missions, the measured centroid can be inverted to estimate the mass of newly shocked ejecta, providing a quantitative link to the DEM's secondary peak.
Editorial analysis
A structured set of objections, weighed in public.
Referee Report
Summary. The paper presents a differential emission measure (DEM) analysis of XMM-Newton RGS and EPIC-pn observations of SN 1987A taken between 2007 and 2021. The authors model the thermal X-ray spectra with a Chebyshev-parameterized DEM composed of 40 vnei temperature bins, with the ionization parameter of each bin tied to temperature through a power law (Eq. 3). They find a persistent major DEM peak at ~0.5–1 keV whose emission measure declines after about 2014, and a high-temperature tail that grows in EM and appears to form a secondary peak at ~3–5 keV in 2020–2021. The DEM results are compared with MHD simulations, leading the authors to interpret the major peak as the equatorial ring (now fading) and the secondary peak as newly shocked ejecta (now brightening). A complementary analysis of the Fe K line centroid shows a possible recent decrease, interpreted as additional evidence for newly shocked ejecta.
Significance. If the central claims hold, the paper provides a valuable continuous temperature-structure characterization of a benchmark supernova remnant, extending the epoch coverage to 2021 and offering a direct comparison with MHD simulations. The work is significant because it moves beyond discrete-temperature fits and identifies a temporal transition from ring-dominated to ejecta-dominated X-ray emission, a prediction that can be tested with future XRISM and other missions. The authors have also included several commendable strengths: validation of the DEM reconstruction on synthetic one-, two-, and three-temperature spectra and on a 2014 MHD synthetic spectrum; MCMC-based uncertainty estimation with full corner plots and best-fit tables in appendices; and a cross-check with an alternative vpshock-based DEM model. The main concern is that the load-bearing assumption of a power-law net–kTe relation (Eq. 3) is acknowledged by the authors themselves to be oversimplified, and the specific new feature (the 3–5 keV secondary peak) appears in an epoch not covered by the model validation.
major comments (3)
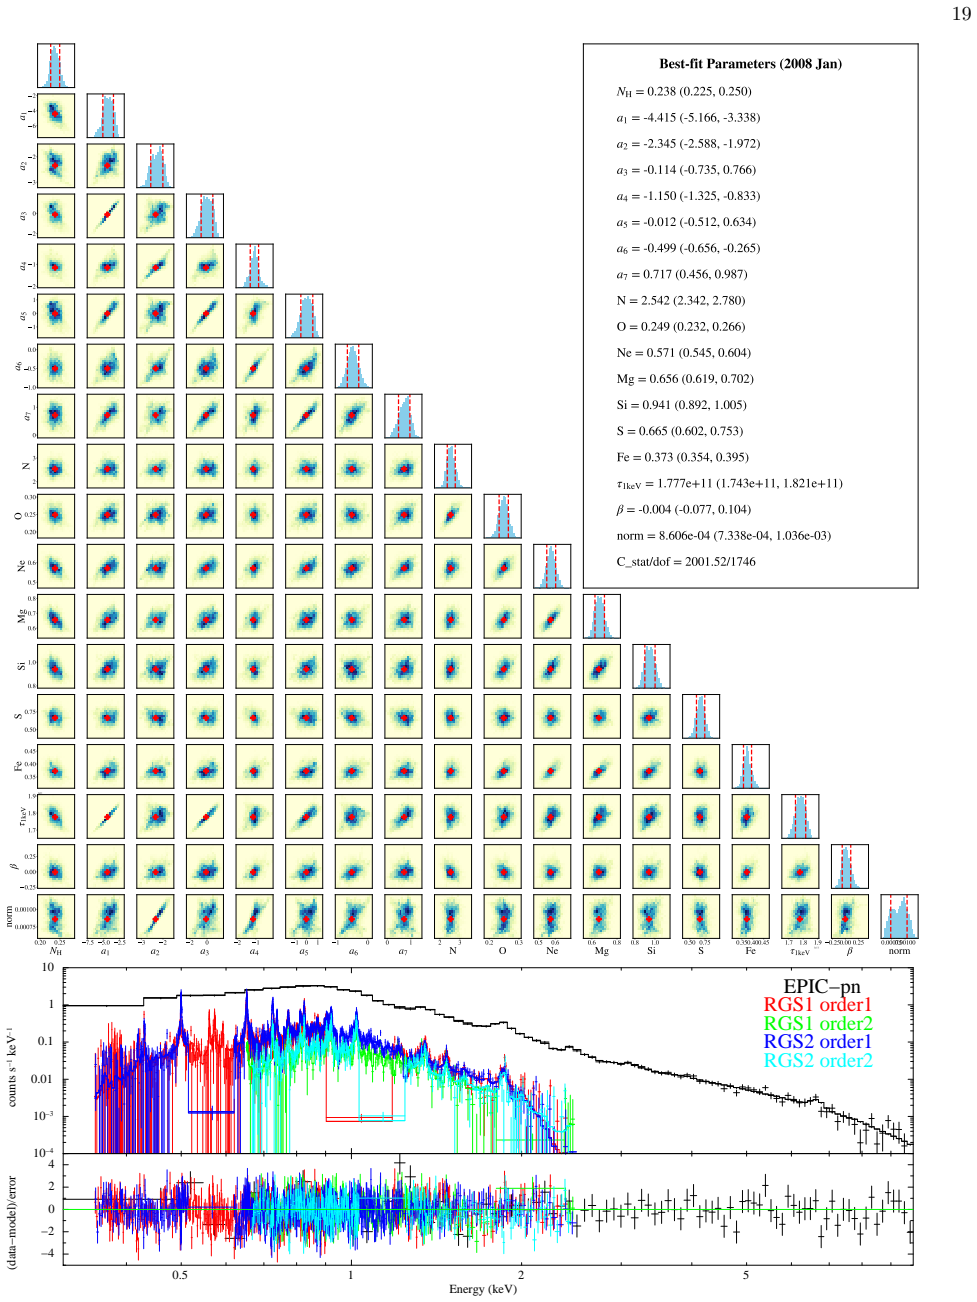
- [Section 3.1, Eq. (3)] The power-law net–kTe relation is load-bearing for the secondary-peak claim, but the paper's own Section 4.3 states that this assumption is 'over-simplified' and that the MHD simulations show an EM-weighted net(kTe) that is not a power law, with a plateau at 0.3–1 keV, a decrease at 1–5 keV, and an increase at >5 keV. The claimed secondary peak at 3–5 keV lies exactly in the temperature range where the simulated net decreases, whereas the fitted power-law index beta is generally >= 0, forcing an increasing net with temperature. This could artificially concentrate emission measure at high temperatures. The validation in Figure 1d uses the 2014 synthetic spectrum, not the 2020–2021 epochs where the secondary peak emerges, so it does not demonstrate that Eq. (3) preserves the very feature being claimed. Please add a synthetic-spectrum test based on the 2020 and 2021 MHD epochs, and/or a systematic exploration of alternative net(T) prescriptions (e.g., the simulated EM-weighted relation), to demonstrate that the secondary peak is not an artifact of the assumed ionization model. This is the main correctness risk of the paper.
- [Section 3.1, abundances] The assumption that metal abundances are identical across all temperature bins, while acknowledged as a simplification, may bias the DEM distribution if the high-temperature component is indeed dominated by shocked ejecta with abundances different from those of the ring. The paper's own comparison with Maitra et al. (2022), who allowed different abundances for different components and found significantly higher abundances in the hot component, indicates that this assumption may not be physically adequate. Since the physical interpretation of the secondary peak as ejecta depends on the separation of components in temperature, please quantify the sensitivity of the DEM profile, especially in the 3–5 keV region, to allowing abundance differences between low- and high-temperature bins (or at least between the ring and ejecta components). Without such a test, the identification of the secondary peak with ejecta is less secure.
- [Section 4.1, Figure 4] The component identification (major peak = ring, secondary peak = ejecta) relies on comparing the observed DEM with the same group's MHD simulations (Orlando et al. 2020; Greco et al. 2022). While this is a reasonable interpretive framework, it is not an independent validation, and the paper itself notes discrepancies (observed peak temperatures are higher and absolute DEMs are lower than simulated). The observed trends of major-peak decline and tail brightening could in principle be produced by a single evolving plasma component (e.g., the forward shock encountering lower-density regions) without requiring a distinct ejecta component. Please make the model dependence of the component labels more explicit, and consider a quantitative test, such as fitting the 2020/2021 spectra with a model that includes a ring component plus an independent ejecta component with separate abundances and ionization states, to strengthen the claim that a newly shocked ejecta component is required by the data.
minor comments (6)
- [Abstract] The sentence 'Our DEM results consistent well with simulations' should read 'Our DEM results are consistent with simulations.'
- [Section 4.3] Given the explicit statement that the power-law net–kTe assumption 'might be over-simplified' and that 'the results must be treated with caution,' the abstract and conclusions should carry a corresponding caveat about the model-dependent nature of the secondary peak and the ejecta-brightening claim.
- [Appendix D] The statistical significance of the Fe K centroid decrease is modest (f-test p-value ~0.05, corresponding to roughly 2σ; the extrapolation test is also caveated by large scatter in the earlier epochs). The text should describe this as a 'possible' or 'tentative' decrease rather than stating it as a firm detection, and it should be made clear that this is not an independent confirmation of the DEM result.
- [Section 3.3] The claim that the DEM model provides 'significantly better fit' than discrete-temperature models should be qualified, since the reported Delta C values range from -4 to -109; for epochs with Delta C close to -4, the improvement is not statistically significant. Please state the average improvement and note the epoch-to-epoch variation.
- [Section 3.2, Figure 1d] The validation on the 2014 MHD synthetic spectrum is useful, but the text should explicitly note that this validation does not cover the 2020–2021 epochs where the new secondary peak appears; this limitation is central to the robustness of the main conclusion.
- [Table 1 and Figure 2] The 2019 observation has a much shorter exposure (32.4 ks for EPIC-pn, PGTI 11.1 ks) than the other epochs; the DEM uncertainties for that epoch appear larger in Figure 2. Please discuss whether the 2019 data point could be affected by the lower signal-to-noise ratio, and whether it influences the inferred onset of the tail rise.
Circularity Check
No significant circularity: the DEM distributions are independent spectral fits, and the same-group simulations are used only for interpretation and validation, not to construct the measured DEM.
full rationale
The paper's central products are DEM distributions obtained by fitting XMM-Newton RGS and EPIC-pn spectra with a Chebyshev-parameterized DEM model (c7pvnei) whose parameters (Chebyshev coefficients, normalization, abundances, and the two net–T parameters of Eq. 3) are free and fitted to the data. The observed DEM features—the major peak at ~0.5–1 keV, the high-temperature tail, the post-2014 decline of the major peak, and the emerging 3–5 keV secondary peak—are outputs of spectral fitting, not inputs. Equation (3) is a modeling assumption inherited from prior literature and explicitly flagged by the authors as possibly over-simplified (Section 4.3); this is a systematic/correctness risk, not circularity, because the power-law relation does not by construction determine the DEM shape. The comparison with MHD simulations (Orlando et al. 2020; Greco et al. 2022) provides an interpretation of the fitted components as ring/ejecta/H II region and a validation test on synthetic 2014 spectra; although several authors overlap with the present paper, those simulations are externally published, constrained by multiwavelength data, and used to interpret rather than to generate the observed DEM. The Fe K centroid decrease is an independent spectral measurement. No derivation step reduces to its own inputs by definition or by fit, so the paper is not significantly circular.
Assumptions & free parameters
free parameters (6)
- beta (ionization parameter power-law index) =
varies per epoch (e.g., -0.121 to 1.937)
- tau_1keV (ionization parameter at 1 keV) =
e.g., (1.4-9.0)e11 cm^-3 s
- Chebyshev coefficients a1..a7 =
per epoch
- Metal abundances (N, O, Ne, Mg, Si, S, Fe) =
per epoch
- LMC absorption column NH_LMC =
~(2.2-2.8)e21 cm^-2
- M and N (Chebyshev order and bin number) =
M=7, N=40
assumptions (4)
- domain assumption Plasma emission in each temperature bin is described by a single-temperature vnei model in collisional ionization equilibrium.
- ad hoc to paper Ionization parameter net is a power-law function of temperature (Eq. 3).
- domain assumption Metal abundances are identical across all temperature bins.
- domain assumption The two-Gaussian decomposition of the observed DEM profiles adequately represents the underlying components.
Cite this review
Pith. "Pith review of Evolution of X-ray Gas in SN 1987A from 2007 to 2021: Ring Fading and Ejecta Brightening Unveiled through Differential Emission Measure Analysis." pith.science (2026). https://pith.science/paper/LAWARRTB
@misc{pith2026250118090,
  author       = {Pith},
  title        = {Pith review of: Evolution of X-ray Gas in SN 1987A from 2007 to 2021: Ring Fading and Ejecta Brightening Unveiled through Differential Emission Measure Analysis},
  year         = {2026},
  howpublished = {\url{https://pith.science/paper/LAWARRTB}},
  note         = {Machine review of arXiv:2501.18090}
}
abstract
As the nearest supernova (SN) observed since Kepler's SN of 1604, SN 1987A provides an unprecedented opportunity to study in detail the early evolution of supernova remnants (SNRs). Despite extensive studies through both observations and simulations, there is still an urgent need for a more effective approach to integrate the results from two sides. In this study, we conducted a detailed differential emission measure (DEM) analysis on the XMM-Newton observations taken in 2007 to 2021 to characterize the continuous temperature structure of SN 1987A, which can be better compared with simulations. The X-ray plasma exhibit a temperature distribution with a major peak at $\sim0.5$-$1$ keV and a high-temperature tail extending to $\gtrsim5$ keV. The emission measure (EM) of the major peak started to decline around 2014, while the EM of the tail continued increasing and appears to have formed a secondary peak at $\sim3$-$5$ keV in recent years. Our DEM results consistent well with simulations, which help to further identify the major peak as originating from the equatorial ring and the secondary peak as arising from the newly shocked ejecta. Together with the simulations, our DEM analysis reveals recent fading of the ring and brightening of the ejecta in X-rays from SN 1987A. Additionally, we observed a recent decrease in the centroid energy of Fe K line, providing further evidence of newly shocked ejecta.
Figures


Figures from the paper (20 more)




Forward citations
Cited by 1 Pith paper
-
Chandra X-Ray Imaging and Spatially Resolved Spectroscopy of SN 1987A: Energy-Dependent Morphology of the Equatorial Ring
Soft X-ray emission from SN 1987A's equatorial ring becomes broader and extends inward after ~2012, while hard X-rays remain compact, indicating growing contribution from reverse-shock-heated interior material.
Reference graph
Works this paper leans on
-
[1]
, " * write output.state after.block = add.period write newline
ENTRY address archivePrefix author booktitle chapter doi edition editor eprint howpublished institution journal key month number organization pages publisher school series title misctitle type volume year version url label extra.label sort.label short.list INTEGERS output.state before.all mid.sentence after.sentence after.block FUNCTION init.state.consts ...
-
[2]
write newline
" write newline "" before.all 'output.state := FUNCTION format.url url empty "" new.block "" url * "" * if FUNCTION format.eprint eprint empty "" archivePrefix empty "" archivePrefix "arXiv" = new.block " " eprint * " " * new.block " " eprint * " " * if if if FUNCTION format.doi doi empty "" " " doi * " " * if FUNCTION format.pid doi empty eprint empty ur...
-
[3]
X H<|7 & J] y F b7 T5r nĐ,lUmHؿǀ[ss] Q l, xLN6 e3,y s hq U@xb߰BB bjg/hs x6b R
thebibliography [1] 20pt to REFERENCES 6pt =0pt -12pt 10pt plus 3pt =0pt =0pt =1pt plus 1pt =0pt =0pt -12pt =13pt plus 1pt =20pt =13pt plus 1pt \@M =10000 =-1.0em =0pt =0pt 0pt =0pt =1.0em @enumiv\@empty 10000 10000 `\.\@m \@noitemerr \@latex@warning Empty `thebibliography' environment \@ifnextchar \@reference \@latexerr Missing key on reference command E...
arXiv 2021
-
[4]
2021, , 916, 76, 10.3847/1538-4357/ac052d
Alp , D., Larsson , J., & Fransson , C. 2021, , 916, 76, 10.3847/1538-4357/ac052d
-
[5]
G., Dwek , E., Bouchet , P., et al
Arendt , R. G., Dwek , E., Bouchet , P., et al. 2016, , 151, 62, 10.3847/0004-6256/151/3/62
-
[6]
Arnaud , K. A. 1996, in Astronomical Society of the Pacific Conference Series, Vol. 101, Astronomical Data Analysis Software and Systems V, ed. G. H. Jacoby & J. Barnes , 17
1996
-
[7]
Borkowski , K. J., Lyerly , W. J., & Reynolds , S. P. 2001, , 548, 820, 10.1086/319011
doi:10.1086/319011 2001
-
[8]
Bray , E., Burrows , D. N., Park , S., & Ravi , A. P. 2020, , 899, 21, 10.3847/1538-4357/ab9c9e
Show all 55 references
-
[9]
Buote , D. A. 2000, , 311, 176, 10.1046/j.1365-8711.2000.03046.x
2000
-
[10]
1975, , 200, L107, 10.1086/181908
Castor , J., McCray , R., & Weaver , R. 1975, , 200, L107, 10.1086/181908
1975 doi
-
[11]
V., Haberl , F., Sturm , R., & Canizares , C
Dewey , D., Dwarkadas , V. V., Haberl , F., Sturm , R., & Canizares , C. R. 2012, , 752, 103, 10.1088/0004-637X/752/2/103
2012 doi
-
[12]
A., Zhekov , S
Frank , K. A., Zhekov , S. A., Park , S., et al. 2016, , 829, 40, 10.3847/0004-637X/829/1/40
2016 doi
-
[13]
2013, , 768, 88, 10.1088/0004-637X/768/1/88
Fransson , C., Larsson , J., Spyromilio , J., et al. 2013, , 768, 88, 10.1088/0004-637X/768/1/88
2013 doi
-
[14]
2015, , 806, L19, 10.1088/2041-8205/806/1/L19
Fransson , C., Larsson , J., Migotto , K., et al. 2015, , 806, L19, 10.1088/2041-8205/806/1/L19
2015 doi
-
[15]
J., Kavanagh , P
Fransson , C., Barlow , M. J., Kavanagh , P. J., et al. 2024, Science, 383, 898, 10.1126/science.adj5796
2024 doi
-
[16]
J., et al
Gabriel , C., Denby , M., Fyfe , D. J., et al. 2004, in Astronomical Society of the Pacific Conference Series, Vol. 314, Astronomical Data Analysis Software and Systems (ADASS) XIII, ed. F. Ochsenbein , M. G. Allen , & D. Egret , 759
2004
-
[17]
M., & Rakowski , C
Ghavamian , P., Laming , J. M., & Rakowski , C. E. 2007, , 654, L69, 10.1086/510740
2007 doi
-
[18]
2020, , 638, A101, 10.1051/0004-6361/202038092
Greco , E., Vink , J., Miceli , M., et al. 2020, , 638, A101, 10.1051/0004-6361/202038092
2020 doi
-
[19]
2021, , 908, L45, 10.3847/2041-8213/abdf5a
Greco , E., Miceli , M., Orlando , S., et al. 2021, , 908, L45, 10.3847/2041-8213/abdf5a
2021 doi
- [20]
-
[21]
2006, , 460, 811, 10.1051/0004-6361:20066198
Haberl , F., Geppert , U., Aschenbach , B., & Hasinger , G. 2006, , 460, 811, 10.1051/0004-6361:20066198
2006 doi
-
[22]
2008, , 676, 361, 10.1086/526517
Heng , K., Haberl , F., Aschenbach , B., & Hasinger , G. 2008, , 676, 361, 10.1086/526517
2008 doi
-
[23]
S., & Bleeker , J
Kaastra , J. S., & Bleeker , J. A. M. 2016, , 587, A151, 10.1051/0004-6361/201527395
2016 doi
-
[24]
S., Mewe , R., & Nieuwenhuijzen , H
Kaastra , J. S., Mewe , R., & Nieuwenhuijzen , H. 1996, in UV and X-ray Spectroscopy of Astrophysical and Laboratory Plasmas, 411--414
1996
-
[25]
2016, , 833, 147, 10.3847/1538-4357/833/2/147
Larsson , J., Fransson , C., Spyromilio , J., et al. 2016, , 833, 147, 10.3847/1538-4357/833/2/147
2016 doi
-
[26]
2019, , 886, 147, 10.3847/1538-4357/ab4ff2
Larsson , J., Fransson , C., Alp , D., et al. 2019, , 886, 147, 10.3847/1538-4357/ab4ff2
2019 doi
-
[27]
2023, , 949, L27, 10.3847/2041-8213/acd555
Larsson , J., Fransson , C., Sargent , B., et al. 2023, , 949, L27, 10.3847/2041-8213/acd555
2023 doi
-
[28]
S., Sugerman , B
Lawrence , S. S., Sugerman , B. E., Bouchet , P., et al. 2000, , 537, L123, 10.1086/312771
2000 doi
-
[29]
R., Mewe , R., Schrijver , C
Lemen , J. R., Mewe , R., Schrijver , C. J., & Fludra , A. 1989, , 341, 474, 10.1086/167508
1989 doi
-
[30]
2012, , 548, L3, 10.1051/0004-6361/201220595
Maggi , P., Haberl , F., Sturm , R., & Dewey , D. 2012, , 548, L3, 10.1051/0004-6361/201220595
2012 doi
-
[31]
2022, , 661, A30, 10.1051/0004-6361/202141104
Maitra , C., Haberl , F., Sasaki , M., et al. 2022, , 661, A30, 10.1051/0004-6361/202141104
2022 doi
-
[32]
N., et al
Miceli , M., Orlando , S., Burrows , D. N., et al. 2019, Nature Astronomy, 3, 236, 10.1038/s41550-018-0677-8
2019 doi
-
[33]
2020, , 888, 111, 10.3847/1538-4357/ab5dba
Ono , M., Nagataki , S., Ferrand , G., et al. 2020, , 888, 111, 10.3847/1538-4357/ab5dba
2020 doi
-
[34]
L., & Bocchino , F
Orlando , S., Miceli , M., Pumo , M. L., & Bocchino , F. 2015, , 810, 168, 10.1088/0004-637X/810/2/168
2015 doi
-
[35]
2019, , 622, A73, 10.1051/0004-6361/201834487
Orlando , S., Miceli , M., Petruk , O., et al. 2019, , 622, A73, 10.1051/0004-6361/201834487
2019 doi
-
[36]
2020, , 636, A22, 10.1051/0004-6361/201936718
Orlando , S., Ono , M., Nagataki , S., et al. 2020, , 636, A22, 10.1051/0004-6361/201936718
2020 doi
-
[37]
A., Burrows , D
Park , S., Zhekov , S. A., Burrows , D. N., Garmire , G. P., & McCray , R. 2004, , 610, 275, 10.1086/421701
2004 doi
-
[38]
A., Burrows , D
Park , S., Zhekov , S. A., Burrows , D. N., et al. 2006, , 646, 1001, 10.1086/505023
2006 doi
-
[39]
A., Burrows , D
Park , S., Zhekov , S. A., Burrows , D. N., & McCray , R. 2005, , 634, L73, 10.1086/498848
2005 doi
-
[40]
P., Park , S., Zhekov , S
Ravi , A. P., Park , S., Zhekov , S. A., et al. 2021, , 922, 140, 10.3847/1538-4357/ac249a
2021 doi
- [41]
-
[42]
C., Ghavamian , P., Bohdan , A., et al
Raymond , J. C., Ghavamian , P., Bohdan , A., et al. 2023, , 949, 50, 10.3847/1538-4357/acc528
2023 doi
- [43]
-
[44]
P., White , N
Singh , K. P., White , N. E., & Drake , S. A. 1996, , 456, 766, 10.1086/176695
1996 doi
-
[45]
Sonneborn , G., Pun , C. S. J., Kimble , R. A., et al. 1998, , 492, L139, 10.1086/311106
1998 doi
-
[46]
2010, , 515, A5, 10.1051/0004-6361/200913317
Sturm , R., Haberl , F., Aschenbach , B., & Hasinger , G. 2010, , 515, A5, 10.1051/0004-6361/200913317
2010 doi
-
[47]
2025, accepted for publication in ApJ
Sun , L., Orlando , S., Greco , E., et al. 2025, accepted for publication in ApJ
2025
-
[48]
2021, , 916, 41, 10.3847/1538-4357/ac033d
Sun , L., Vink , J., Chen , Y., et al. 2021, , 916, 41, 10.3847/1538-4357/ac033d
2021 doi
-
[49]
2012, , 20, 49, 10.1007/s00159-011-0049-1
Vink , J. 2012, , 20, 49, 10.1007/s00159-011-0049-1
2012 doi
-
[50]
2020, Physics and Evolution of Supernova Remnants , 10.1007/978-3-030-55231-2
---. 2020, Physics and Evolution of Supernova Remnants , 10.1007/978-3-030-55231-2
2020 doi
-
[51]
M., Lauberts , A., Jorgensen , H
West , R. M., Lauberts , A., Jorgensen , H. E., & Schuster , H. E. 1987, , 177, L1
1987
-
[52]
2000, , 542, 914, 10.1086/317016
Wilms , J., Allen , A., & McCray , R. 2000, , 542, 914, 10.1086/317016
2000 doi
-
[53]
A., McCray , R., Borkowski , K
Zhekov , S. A., McCray , R., Borkowski , K. J., Burrows , D. N., & Park , S. 2006, , 645, 293, 10.1086/504285
2006 doi
-
[54]
A., McCray , R., Dewey , D., et al
Zhekov , S. A., McCray , R., Dewey , D., et al. 2009, , 692, 1190, 10.1088/0004-637X/692/2/1190
2009 doi
-
[55]
A., Park , S., McCray , R., Racusin , J
Zhekov , S. A., Park , S., McCray , R., Racusin , J. L., & Burrows , D. N. 2010, , 407, 1157, 10.1111/j.1365-2966.2010.16967.x
2010
Reviewed August 10, 2026 · model on record in the stance chip above.
Discussion (0). Continue with ORCID to comment.