REVIEW 3 major objections 6 minor 47 references
The Gas-to-Dust Ratio Investigation in the Massive Star-Forming region M17
T0 review · 3 major / 6 minor · reviewed 2026-08-08 · deepseek-v4-flash
Pith's one-line read M17's gas-to-dust ratio rises sharply in its dense interior, reaching roughly three times the Milky Way average.
desk verdict A useful new extinction/CO data paper for M17 whose headline dense-core GDR excess is probably an artifact of the 90" extinction smoothing and missing background stars, not a real change in gas-to-dust ratio. read the letter →
The pith
A machine-rendered reading of the paper's core claim, the machinery that carries it, and where it could break.
The reading
What carries the argument
The load-bearing machinery is a segmented linear fit of $W(\mathrm{CO})$ versus $A_V$ with a break point at $A_V = 10$ mag, combined with the conversion chain $W(\mathrm{CO}) \to N(\mathrm{H_2}) \to N(\mathrm{H}) \to \mathrm{GDR}$. Gas column densities come from two tracers: $^{12}$CO with $X_{\rm CO} = 2\times10^{20}$ cm$^{-2}\,(\mathrm{K\,km\,s^{-1}})^{-1}$, and $^{13}$CO under local thermodynamic equilibrium with the abundance ratio $N(\mathrm{H_2})/N(^{13}\mathrm{CO}) = 7.5\times10^5$. Dust column density is obtained from the $(H-K)$ colour excess through $A_V = 15[(H-K)_{\rm obs} - 0.2]$. The chain closes with the WD01 dust model (a silicate-graphite mixture fitted to the Milky Way extinction curve), whose constant in Eq. (13) converts $N(\mathrm{H})/A_V$ into the mass ratio. The break at 10 mag is what produces the threefold GDR jump.
What would settle it
Measure the dust column in the same $A_V \ge 10$ mag pixels from far-infrared or submillimetre dust emission instead of extinction. If the emission-derived dust mass is about three times the extinction-derived value, the GDR jump is an artifact of the WD01 conversion; if it agrees with the extinction-derived value, the high GDR is real.
Extended reading notes
Core claim
The central claim is that the gas-to-dust ratio in M17 rises sharply at high extinction. The authors measure a segmented linear relation between CO integrated intensity and visual extinction, with a break at $A_V = 10$ mag: $W(^{12}\mathrm{CO})/A_V$ goes from $6.27 \pm 0.19$ to $15.8 \pm 0.06$ $\mathrm{K\,km\,s^{-1}\,mag^{-1}}$, and $W(^{13}\mathrm{CO})/A_V$ from $0.75 \pm 0.72$ to $3.11 \pm 0.25$. After converting CO brightness to hydrogen column density with $X_{\rm CO} = 2\times10^{20}$ cm$^{-2}\,(\mathrm{K\,km\,s^{-1}})^{-1}$ for $^{12}$CO and an LTE analysis with $N(\mathrm{H_2})/N(^{13}\mathrm{CO}) = 7.5\times10^5$ for $^{13}$CO, and then converting $N(\mathrm{H})/A_V$ to GDR with the WD01 dust model, the derived GDR stays near 100 at low extinction but reaches about 300-390 at high extinction. The authors interpret this as the dense interior of M17 containing roughly three times more gas per unit dust than the Milky Way average, possibly tied to massive-star feedback changing CO abundance or dust properties.
Load-bearing premise
The result assumes that the adopted Milky Way conversion constants — $X_{\rm CO}$, $N(\mathrm{H_2})/N(^{13}\mathrm{CO})$, and especially the WD01 dust model relation between $N(\mathrm{H})/A_V$ and GDR — remain valid in M17's dense interior, where dust grains may grow, be destroyed, or change composition.
Editorial extensions
If this is right
- At $A_V \le 10$ mag the derived GDR is indistinguishable from the Milky Way value of about 100, so the method reproduces standard calibrations in the cloud envelope.
- At $A_V \ge 10$ mag both CO isotopologues give GDRs of $296 \pm 3$ and $387 \pm 40$, about three times the Milky Way average, implying the dense core is gas-rich relative to dust.
- The low-extinction $N(\mathrm{H})/A_V$ values agree with previous estimates for Orion and the high-latitude ISM, while the high-extinction values ($6.32$ and $8.27\times10^{21}$ cm$^{-2}$ mag$^{-1}$) exceed all previous measurements.
- Massive stars in M17 sit in low-extinction cavities with relatively high GDR, suggesting that they locally deplete or destroy dust while leaving CO emission bright.
Reading between the lines
- If the GDR jump is real, gas masses for dense molecular clumps that assume a fixed Milky Way GDR would be underestimated by about a factor of three; the same correction may apply to other massive star-forming regions, not just M17.
- A decisive test is to measure the dust column in the same high-$A_V$ pixels from far-infrared or submillimetre dust emission: if emission-derived dust mass is roughly three times the extinction-derived value, the jump is an extinction-calibration artifact rather than a true gas excess.
- The apparent rise could also be mimicked by CO abundance enhancement near massive stars, so mapping a CO-free dense-gas tracer such as N$_2$H$^+$ across the core would separate a real GDR change from a CO abundance effect.
- Spatially resolved infrared spectroscopy of the 9.7 $\mu$m silicate feature would directly test the paper's suggestion that the dust composition in M17 is more graphite-rich than the WD01 model.
Editorial analysis
A structured set of objections, weighed in public.
Referee Report
Summary. The paper derives the gas-to-dust ratio (GDR) in the massive star-forming region M17 by combining MWISP 12CO and 13CO integrated-intensity maps with an infrared extinction map from UKIRT near-IR photometry. The authors measure the ratio W(CO)/A_V in two extinction regimes, finding a steeper slope for A_V >= 10 mag than for A_V <= 10 mag, and then convert the slopes into N(H)/A_V and GDR using fixed literature constants: X_CO = 2e20, N(H2)/N(13CO) = 7.5e5, and the WD01 dust model conversion. The central claim is that the GDR in M17 increases to 296 +/- 3 (12CO) and 387 +/- 40 (13CO) at high extinction, roughly three times the Milky Way average, whereas at low extinction the GDR is consistent with standard values. The paper also discusses possible causes, including massive-star feedback, dust destruction/growth, and composition changes.
Significance. If correct, the result would indicate a substantial variation of the gas-to-dust ratio within a single massive star-forming cloud, with implications for CO-to-H2 conversion factors and dust evolution in dense regions. The paper contributes a new, deep near-IR extinction map of M17 (about 1.2 million stars) and a comparison of GDR across different dust models. However, the headline GDR values are not derived from a measurement of dust mass independent of the adopted extinction law; they are obtained by multiplying observed W(CO)/A_V slopes by external calibrations (X_CO, 13CO abundance, WD01). The robustness of the claimed increase therefore rests on whether the A_V map faithfully traces dust column in the high-extinction regime and on whether the adopted calibrations remain valid there. The paper is transparent about some of these limitations but does not quantify their impact. The central claim is interesting and potentially important, but it needs a quantitative treatment of the systematic effects before it can be accepted.
major comments (3)
- [Section 2.3, Eq. (5)] The extinction map is a Gaussian-weighted average of stellar A_V values with FWHM 90", while the CO maps have a resolution of approximately 50" (Section 2.1). In pixels with A_V >= 10 mag, background stars behind the dense cloud are mostly undetected at the UKIRT depth, so the stars that contribute to the weighted average are preferentially foreground or lightly reddened sources. These stars do not sample the full column of the cloud, yet W(CO) integrates the entire line of sight. This resolution and source-selection mismatch will inflate W(CO)/A_V preferentially in the very pixels that define the A_V >= 10 mag branch. The paper needs a quantitative test—for example, synthetic star fields drawn from a known column and GDR, or a comparison with an independently constructed extinction map using red clump giants or a deconvolved map—to demonstrate that the reported break at A_V = 10 mag is not an artifact of this weighting.
- [Section 3.4, Eq. (13)] The absolute GDR values are derived by multiplying the fitted slope by external conversion constants: X_CO = 2e20 cm^-2 (K km/s)^-1 with an adopted 30% uncertainty (Bolatto et al. 2013), N(H2)/N(13CO) = 7.5e5, and the WD01 conversion coefficient from Lv et al. (2018). The quoted uncertainties (e.g., 296 +/- 3 for 12CO at A_V >= 10 mag) include only the fit errors of the slope. A 30% uncertainty in X_CO alone would produce a 30% systematic error in the 12CO-based N(H) and GDR, and the 13CO-based values additionally depend on the assumed LTE excitation temperature and optical depth. The paper should present a systematic-error budget that propagates these constants, and should state explicitly how the high-A_V conclusion changes if, for example, X_CO varies by a factor of 2 in dense gas or if the WD01 conversion is replaced by an alternative dust model suitable for coagulated grains.
- [Section 3.2, Figure 7] The 13CO slope in the low-extinction regime is 0.75 +/- 0.72 K km/s mag^-1, which is consistent with zero at the ~1-sigma level; the corresponding GDR of 83 +/- 62 for A_V <= 10 mag is not a meaningful measurement and should not be used to claim consistency with the Milky Way value. In addition, the break at A_V = 10 mag is adopted from Lv et al. (2018) rather than being tested against the M17 data. Please add a statistical test for the segmented fit (e.g., an F-test or a comparison of Bayesian information criteria for one slope versus two slopes) and report the correlation coefficients and scatter of the binned data. Without this, the reality of the two-regime behavior is not established beyond the visual impression of Figure 7.
minor comments (6)
- [Abstract and text] The compiled text contains many missing spaces (e.g., "M17isawell-known"), which makes the paper hard to read; please ensure proper copy-editing of the LaTeX source.
- [Figures 12 and 13 captions] The GDR maps are labeled with units of 10^21 cm^-2 mag^-1, but GDR is a dimensionless ratio; please correct the captions and color-bar labels.
- [Section 2.3, Eq. (5)] Equation (5) defines a single two-dimensional Gaussian, but the text describes a weighted average of A_V values over stars. Please provide the full formula for the weighted mean used to assign an A_V to each pixel, including the normalization and the weight assigned to each star.
- [Section 2.3, paragraph 4] The text says "we detected approximately 1.2 million more stars" when comparing with Lucas et al. (2008); since the paper detected about 1.2 million stars total and Lucas et al. reported 0.788 million, the comparison should be phrased as "about 1.2 million stars, compared to 0.788 million in Lucas et al."
- [Section 4.1, references] Chen (2015) is cited as a National Science Library thesis; if the underlying data or method has a peer-reviewed publication, please cite that instead, or provide the thesis details in a more complete form.
- [Section 3.3, Eq. (11)] The 13CO column density is derived under the assumptions of LTE and optically thin 13CO, but these assumptions are not discussed for the high-extinction regime where the 13CO lines may become optically thick; please add a cautionary note or a test of the optical depth.
Circularity Check
No significant circularity: the derived GDR is a transparent rescaling of measured W(CO)/A_V slopes by external, independently published calibration constants.
full rationale
The derivation chain is explicit and self-contained: W(CO)/A_V is fitted from the MWISP CO maps and the UKIRT extinction map (Sect. 3.2); N(H)/A_V is obtained by multiplying the fitted slopes by fixed literature constants (X_CO = 2e20 cm^-2 (K km/s)^-1, Bolatto et al. 2013; N(H2)/N(13CO) = 7.5e5, Sun & Li 2004; factor 2, Sect. 3.3); and GDR is a linear rescaling of N(H)/A_V by the WD01 dust-model coefficient (Sect. 3.4, Eq. 13). Each conversion is a multiplication by an externally calibrated constant; no parameter is fitted to the M17 data and then rediscovered as a prediction. The high-AV GDR (~300) is the same measurement as the high-AV W(CO)/A_V slope in different units, not an output that was fed back as an input. The paper cites Lv et al. (2018), which includes coauthor Jiang, for the method and the WD01 conversion coefficient, but this is not load-bearing: the coefficient is traceable to Weingartner & Draine (2001), an independent external model, and the qualitative increase is present for all three dust models in Table 1. The limitations openly acknowledged in Sect. 4.2 (X_CO variation, dust composition, scattered light, possible A_V underestimation) and the 90-inch Gaussian smoothing in Sect. 2.3 are systematic-error or data-quality concerns, not equation-by-construction circularity. Therefore no circular step is present.
Assumptions & free parameters
free parameters (6)
- X_CO conversion factor =
2x10^20 cm^-2 (K km/s)^-1
- N(H2)/N(13CO) abundance ratio =
7.5x10^5
- Reddening conversion and intrinsic color =
r=15 mag, (H-K)_intrinsic=0.2 mag
- AV=10 mag segmentation boundary =
10 mag
- Foreground star cutoff =
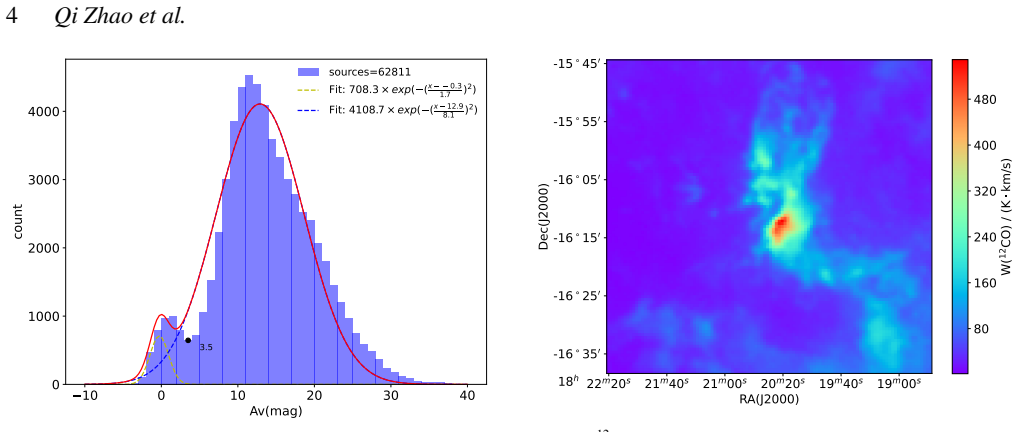
3.5 mag
- WD01 GDR conversion coefficient =
46.8x10^-21 cm^2 mag
assumptions (5)
- domain assumption 12CO J=1-0 integrated intensity is a linear tracer of H2 column density with a constant X_CO
- domain assumption 13CO is optically thin and in LTE with Tex(13CO) equal to Tex(12CO)
- domain assumption N(H) equals 2 N(H2) and atomic HI makes no significant contribution
- domain assumption Interstellar dust in M17 follows the WD01 Milky Way extinction curve and dust-to-extinction relation
- domain assumption Foreground contamination is separable by a simple AV less than 3.5 mag cutoff
Cite this review
Pith. "Pith review of The Gas-to-Dust Ratio Investigation in the Massive Star-Forming region M17." pith.science (2026). https://pith.science/paper/3POOWSWO
@misc{pith2026250204626,
  author       = {Pith},
  title        = {Pith review of: The Gas-to-Dust Ratio Investigation in the Massive Star-Forming region M17},
  year         = {2026},
  howpublished = {\url{https://pith.science/paper/3POOWSWO}},
  note         = {Machine review of arXiv:2502.04626}
}
abstract
M17 is a well-known massive star-forming region, and its Gas-to-Dust Ratio (GDR) may vary significantly compared to the other areas. The mass of gas can be traced by the ${\rm CO}$ emission observed in the \emph{Milky Way Imaging Scroll Painting (MWISP) project}. The dust mass can be traced by analyzing the interstellar extinction magnitude obtained from the \emph{United Kingdom Infrared Telescope (UKIRT)}. We computed the ratio ${W({\rm CO})/A_V}$: for ${A_V \le }$ 10 mag, ${{ W(^{12}{\rm CO})/ A_V}= (6.27 \pm 0.19)}$ ${\mathrm{{K \cdot km/s} \cdot mag^{-1}}}$ and ${{ W(^{13}{\rm CO})/ A_V} = (0.75 \pm 0.72)}$ ${ \mathrm{{K \cdot km/s} \cdot mag^{-1}}}$; whereas for ${{A_V} \ge 10}$ mag, ${{ W(^{12}{\rm CO})/ A_V} = (15.8 \pm 0.06) }$ ${\mathrm{{K \cdot km/s} \cdot mag^{-1}}}$ and ${{ W(^{13}{\rm CO})/ A_V} = (3.11 \pm 0.25)}$ ${ \mathrm{{K \cdot km/s} \cdot mag^{-1}}}$. Then, we converted the ${W({\rm CO})/A_V}$ into ${N(\rm H)/A_V}$. Using the WD01 model, we derived the GDR: for ${A_V \le }$ 10 mag, the GDRs were ${118 \pm 9}$ for ${^{12}{\rm CO}}$ and ${83 \pm 62}$ for ${^{13}{\rm CO}}$, comparable to those of the Milky Way; however, for ${A_V \ge }$ 10 mag, the GDRs increased significantly to ${296 \pm 3}$ for ${^{12}{\rm CO}}$ and ${387 \pm 40}$ for ${^{13}{\rm CO}}$, approximately three times higher than those of the Milky Way. In the discussion, we compared the results of this work with previous studies and provided a detailed discussion of the influence of massive stars and other factors on GDR.
Figures


Figures from the paper (7 more)


Reference graph
Works this paper leans on
-
[1]
write newline
" write newline "" before.all 'output.state := FUNCTION fin.entry write newline FUNCTION new.block output.state before.all = 'skip after.block 'output.state := if FUNCTION new.sentence output.state after.block = 'skip output.state before.all = 'skip after.sentence 'output.state := if if FUNCTION not #0 #1 if FUNCTION and 'skip pop #0 if FUNCTION or pop #1...
-
[2]
write newline
" write newline "" before.all 'output.state := FUNCTION fin.entry write newline FUNCTION new.block output.state before.all = 'skip after.block 'output.state := if FUNCTION new.sentence output.state after.block = 'skip output.state before.all = 'skip after.sentence 'output.state := if if FUNCTION not #0 #1 if FUNCTION and 'skip pop #0 if FUNCTION or pop #1...
-
[3]
Akimkin V. V., Kirsanova M. S., Pavlyuchenkov Y. N., Wiebe D. S., 2017, @doi [ ] 10.1093/mnras/stx797 , https://ui.adsabs.harvard.edu/abs/2017MNRAS.469..630A 469, 630
-
[4]
J., 1997, IAU Symposium, https://ui.adsabs.harvard.edu/abs/1997IAUS..170...47A 170, 47
Alves J., Lada C. J., 1997, IAU Symposium, https://ui.adsabs.harvard.edu/abs/1997IAUS..170...47A 170, 47
work page 1997
-
[5]
Bohlin R. C., Savage B. D., Drake J. F., 1978, @doi [ ] 10.1086/156357 , https://ui.adsabs.harvard.edu/abs/1978ApJ...224..132B 224, 132
doi:10.1086/156357 1978
-
[6]
Bolatto A. D., Wolfire M., Leroy A. K., 2013, @doi [ ] 10.1146/annurev-astro-082812-140944 , https://ui.adsabs.harvard.edu/abs/2013ARA&A..51..207B 51, 207
-
[7]
Casali M., et al., 2007, @doi [ ] 10.1051/0004-6361:20066514 , https://ui.adsabs.harvard.edu/abs/2007A&A...467..777C 467, 777
-
[8]
Chen Z., 2015, National Science Library Chinese Academy of Sciences, LW104453
work page 2015
Show all 47 references
-
[9]
Q., Liu X
Chen B. Q., Liu X. W., Yuan H. B., Huang Y., Xiang M. S., 2015, @doi [ ] 10.1093/mnras/stv103 , https://ui.adsabs.harvard.edu/abs/2015MNRAS.448.2187C 448, 2187
2015 doi
-
[10]
Chen Z., Jiang Z., Tamura M., Kwon J., Roman-Lopes A., 2017, @doi [ ] 10.3847/1538-4357/aa65d3 , https://ui.adsabs.harvard.edu/abs/2017ApJ...838...80C 838, 80
2017 doi
-
[11]
F., 1998, , https://ui.adsabs.harvard.edu/abs/1998A&A...329..161C 329, 161
Chini R., Wargau W. F., 1998, , https://ui.adsabs.harvard.edu/abs/1998A&A...329..161C 329, 161
1998
-
[12]
Combes F., 1991, @doi [ ] 10.1146/annurev.aa.29.090191.001211 , https://ui.adsabs.harvard.edu/abs/1991ARA&A..29..195C 29, 195
1991
-
[13]
M., Hartmann D., Thaddeus P., 2001, @doi [ ] 10.1086/318388 , https://ui.adsabs.harvard.edu/abs/2001ApJ...547..792D 547, 792
Dame T. M., Hartmann D., Thaddeus P., 2001, @doi [ ] 10.1086/318388 , https://ui.adsabs.harvard.edu/abs/2001ApJ...547..792D 547, 792
2001 doi
-
[14]
L., Snell R
Dickman R. L., Snell R. L., Schloerb F. P., 1986, @doi [ ] 10.1086/164604 , https://ui.adsabs.harvard.edu/abs/1986ApJ...309..326D 309, 326
1986 doi
-
[15]
T., 2009, in Henning T., Gr \"u n E., Steinacker J., eds, Astronomical Society of the Pacific Conference Series Vol
Draine B. T., 2009, in Henning T., Gr \"u n E., Steinacker J., eds, Astronomical Society of the Pacific Conference Series Vol. 414, Cosmic Dust - Near and Far. p. 453 ( @eprint arXiv 0903.1658 ), @doi 10.48550/arXiv.0903.1658
-
[16]
T., Lee H
Draine B. T., Lee H. M., 1984, @doi [ ] 10.1086/162480 , https://ui.adsabs.harvard.edu/abs/1984ApJ...285...89D 285, 89
1984 doi
-
[17]
T., Salpeter E
Draine B. T., Salpeter E. E., 1979, @doi [ ] 10.1086/157206 , https://ui.adsabs.harvard.edu/abs/1979ApJ...231..438D 231, 438
1979 doi
-
[18]
Entekhabi N., et al., 2022, @doi [ ] 10.1051/0004-6361/202142601 , https://ui.adsabs.harvard.edu/abs/2022A&A...662A..39E 662, A39
2022 doi
-
[19]
M., Howarth I
Hanson M. M., Howarth I. D., Conti P. S., 1997, @doi [ ] 10.1086/304808 , https://ui.adsabs.harvard.edu/abs/1997ApJ...489..698H 489, 698
1997 doi
-
[20]
M., 2015, @doi [ ] 10.1146/annurev-astro-082214-122324 , https://ui.adsabs.harvard.edu/abs/2015ARA&A..53..583H 53, 583
Heyer M., Dame T. M., 2015, @doi [ ] 10.1146/annurev-astro-082214-122324 , https://ui.adsabs.harvard.edu/abs/2015ARA&A..53..583H 53, 583
2015 doi
-
[21]
H., Chini R., Scheyda C
Hoffmeister V. H., Chini R., Scheyda C. M., Schulze D., Watermann R., N \"u rnberger D., Vogt N., 2008, @doi [ ] 10.1086/591070 , https://ui.adsabs.harvard.edu/abs/2008ApJ...686..310H 686, 310
2008 doi
-
[22]
J., Tielens A
Hollenbach D. J., Tielens A. G. G. M., 1999, @doi [Reviews of Modern Physics] 10.1103/RevModPhys.71.173 , https://ui.adsabs.harvard.edu/abs/1999RvMP...71..173H 71, 173
1999 doi
-
[23]
Kainulainen J., Alves J., Beuther H., Henning T., Schuller F., 2011, @doi [ ] 10.1051/0004-6361/201117757 , https://ui.adsabs.harvard.edu/abs/2011A&A...536A..48K 536, A48
2011 doi
-
[24]
S., Pavlyuchenkov Y
Kirsanova M. S., Pavlyuchenkov Y. N., 2023, in Bisikalo D., Wiebe D., Boily C., eds, IAU Symposium Vol. 362, The Predictive Power of Computational Astrophysics as a Discover Tool. pp 268--272 ( @eprint arXiv 2203.05986 ), @doi 10.1017/S1743921322001880
2023 arXiv
-
[25]
Koutoulaki M., et al., 2019, @doi [ ] 10.1051/0004-6361/201834713 , https://ui.adsabs.harvard.edu/abs/2019A&A...625A..49K 625, A49
2019 doi
-
[26]
Kr \"u gel E., 2009, @doi [ ] 10.1051/0004-6361:200809976 , https://ui.adsabs.harvard.edu/abs/2009A&A...493..385K 493, 385
2009 doi
-
[27]
F., Penfield H., 1974, @doi [ ] 10.1086/181458 , https://ui.adsabs.harvard.edu/abs/1974ApJ...189L..35L 189, L35
Lada C., Dickinson D. F., Penfield H., 1974, @doi [ ] 10.1086/181458 , https://ui.adsabs.harvard.edu/abs/1974ApJ...189L..35L 189, L35
1974 doi
-
[28]
J., Alves J., Lada E
Lada C. J., Alves J., Lada E. A., 1999, , https://ui.adsabs.harvard.edu/abs/1999ApJ...512..250L 512
1999
-
[29]
Liseau R., Lorenzetti D., Molinari S., Nisini B., Saraceno P., Spinoglio L., 1995, , https://ui.adsabs.harvard.edu/abs/1995A&A...300..493L 300, 493
1995
-
[30]
Liseau R., et al., 2015, @doi [ ] 10.1051/0004-6361/201525641 , https://ui.adsabs.harvard.edu/abs/2015A&A...578A.131L 578, A131
2015 doi
-
[31]
Liszt H., 2014, @doi [ ] 10.1088/0004-637X/783/1/17 , https://ui.adsabs.harvard.edu/abs/2014ApJ...783...17L 783, 17
2014 doi
-
[32]
W., et al., 2008, @doi [ ] 10.1111/j.1365-2966.2008.13924.x , https://ui.adsabs.harvard.edu/abs/2008MNRAS.391..136L 391, 136
Lucas P. W., et al., 2008, @doi [ ] 10.1111/j.1365-2966.2008.13924.x , https://ui.adsabs.harvard.edu/abs/2008MNRAS.391..136L 391, 136
2008
-
[33]
Lv Z.-p., Jiang B.-w., Li J., 2018, @doi [ ] 10.1016/j.chinastron.2018.04.004 , https://ui.adsabs.harvard.edu/abs/2018ChA&A..42..213L 42, 213
2018 doi
-
[34]
P., 2012, @doi [ ] 10.1051/0004-6361/201118740 , https://ui.adsabs.harvard.edu/abs/2012A&A...543A.103P 543, A103
Paradis D., Dobashi K., Shimoikura T., Kawamura A., Onishi T., Fukui Y., Bernard J. P., 2012, @doi [ ] 10.1051/0004-6361/201118740 , https://ui.adsabs.harvard.edu/abs/2012A&A...543A.103P 543, A103
2012 doi
-
[35]
C., de Koter A., Backs F., Derkink A., Bik A., Kaper L., 2023, @doi [ ] 10.1051/0004-6361/202245658 , https://ui.adsabs.harvard.edu/abs/2023A&A...676A.122P 676, A122
Poorta J., Ram \' rez-Tannus M. C., de Koter A., Backs F., Derkink A., Bik A., Kaper L., 2023, @doi [ ] 10.1051/0004-6361/202245658 , https://ui.adsabs.harvard.edu/abs/2023A&A...676A.122P 676, A122
2023 doi
-
[36]
C., et al., 2017a, VizieR Online Data Catalog, https://ui.adsabs.harvard.edu/abs/2017yCat..36040078R pp J/A+A/604/A78
Ramirez-Tannus M. C., et al., 2017a, VizieR Online Data Catalog, https://ui.adsabs.harvard.edu/abs/2017yCat..36040078R pp J/A+A/604/A78
-
[37]
C., et al., 2017b, @doi [ ] 10.1051/0004-6361/201629503 , https://ui.adsabs.harvard.edu/abs/2017A&A...604A..78R 604, A78
Ram \' rez-Tannus M. C., et al., 2017b, @doi [ ] 10.1051/0004-6361/201629503 , https://ui.adsabs.harvard.edu/abs/2017A&A...604A..78R 604, A78
-
[38]
H., Lebofsky M
Rieke G. H., Lebofsky M. J., 1985, @doi [ ] 10.1086/162827 , https://ui.adsabs.harvard.edu/abs/1985ApJ...288..618R 288, 618
1985 doi
-
[39]
H., Adams F
Shu F. H., Adams F. C., Lizano S., 1987, @doi [ ] 10.1146/annurev.aa.25.090187.000323 , https://ui.adsabs.harvard.edu/abs/1987ARA&A..25...23S 25, 23
1987
-
[40]
M., van Steenberg M
Shull J. M., van Steenberg M. E., 1985, @doi [ ] 10.1086/163327 , https://ui.adsabs.harvard.edu/abs/1985ApJ...294..599S 294, 599
1985 doi
-
[41]
F., et al., 2006, @doi [ ] 10.1086/498708 , https://ui.adsabs.harvard.edu/abs/2006AJ....131.1163S 131, 1163
Skrutskie M. F., et al., 2006, @doi [ ] 10.1086/498708 , https://ui.adsabs.harvard.edu/abs/2006AJ....131.1163S 131, 1163
2006 doi
-
[42]
H., Hopkins P
Soliman N. H., Hopkins P. F., Grudi \'c M. Y., 2024, @doi [ ] 10.3847/1538-4357/ad6ddd , https://ui.adsabs.harvard.edu/abs/2024ApJ...974..136S 974, 136
2024 doi
-
[43]
John Wiley and Sons, Inc., @doi 10.1002/9783527617722
Spitzer L., 1978, Physical processes in the interstellar medium . John Wiley and Sons, Inc., @doi 10.1002/9783527617722
1978 doi
-
[44]
Su Y., et al., 2019, @doi [ ] 10.3847/1538-4365/aaf1c8 , https://ui.adsabs.harvard.edu/abs/2019ApJS..240....9S 240, 9
2019 doi
-
[45]
Beijing Normal University Publishing Group
Sun J., Li S., 2004, Fundamentals of Molecular Astrophysics . Beijing Normal University Publishing Group
2004
-
[46]
C., Draine B
Weingartner J. C., Draine B. T., 2001, @doi [ ] 10.1086/318651 , https://ui.adsabs.harvard.edu/abs/2001ApJ...548..296W 548, 296
2001 doi
-
[47]
S., Scoville N
Young J. S., Scoville N. Z., 1991, @doi [ ] 10.1146/annurev.aa.29.090191.003053 , https://ui.adsabs.harvard.edu/abs/1991ARA&A..29..581Y 29, 581
1991
Reviewed August 8, 2026 · model on record in the stance chip above.
Discussion (0). Continue with ORCID to comment.