REVIEW 3 major objections 5 minor 29 references
Feasibility study of multiplexing analog signals from SiPMs for a single layer monolithic PET detector design
T0 review · 3 major / 5 minor · reviewed 2026-08-08 · deepseek-v4-flash
Pith's one-line read A simulated PET detector can halve its readout channels from 32 to 16 without losing its roughly 0.50 mm spatial resolution, and only below 16 channels does performance degrade.
desk verdict Solid simulation study: the 16-channel conclusion holds up internally, but the single-layer-to-stack transfer is asserted not shown, and the bias-corrected 0.34 mm is an in-sample number. read the letter →
The pith
A machine-rendered reading of the paper's core claim, the machinery that carries it, and where it could break.
The reading
What carries the argument
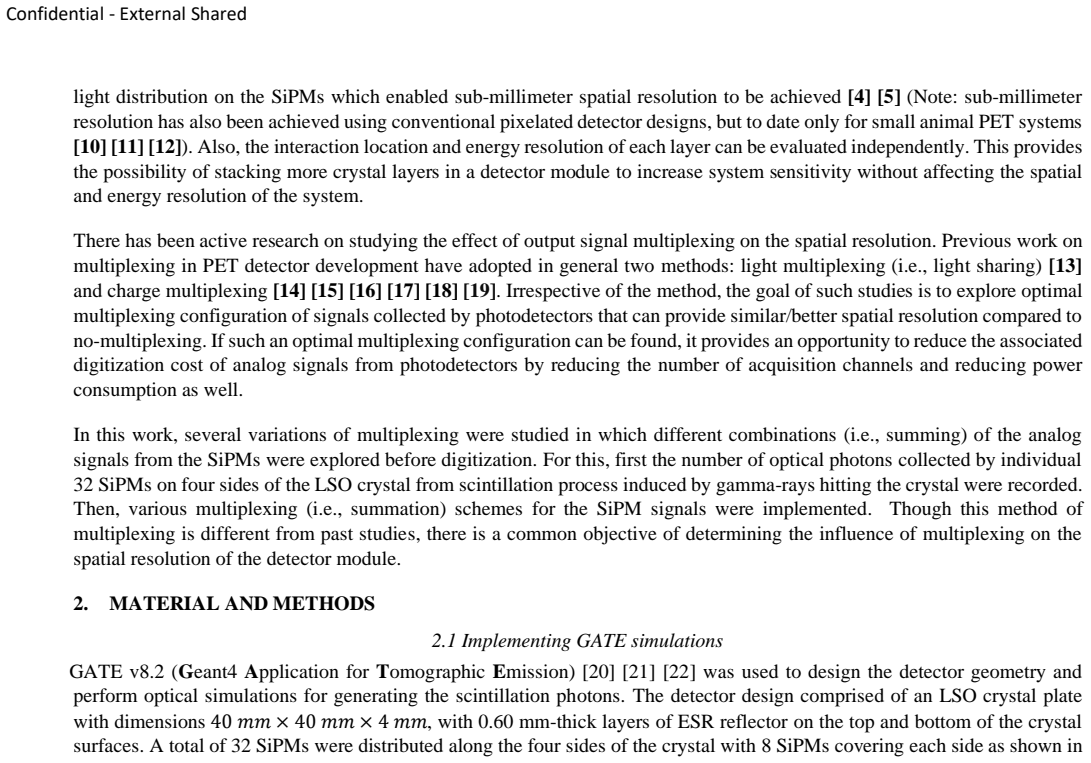
The central mechanism is the comparison of average FWHM and corner bias across a ladder of multiplexing schemes, carried by three components: a GATE v8.2 optical simulation of a single LSO layer with 32 side SiPMs; a set of analog summation schemes that reduce 32 signals to 28, 24, 20, 16, 12, 8, or 4 channels; and a convolutional neural network that converts the summed light distribution into a grayscale image, assigns probabilities over 1600 calibration positions, and computes the interaction position as a probability-weighted center of mass. The load-bearing comparison is the average FWHM (and its standard deviation) over a 39 x 39 test grid, together with the mean squared error of corner bias.
What would settle it
Measure the built single-layer module's average FWHM at 32 and 16 readout channels with a collimated 511 keV source; if the 16-channel value is not within the simulation's reported spread of the 32-channel value (about 0.50 mm with standard deviation near 0.2 mm), the central claim fails. Separately, simulate a realistic stacked module including inter-crystal Compton scattering and random interaction positions; if 16-channel resolution degrades relative to 32 channels more than the single-layer study predicts, the transferability assumption fails.
Extended reading notes
Core claim
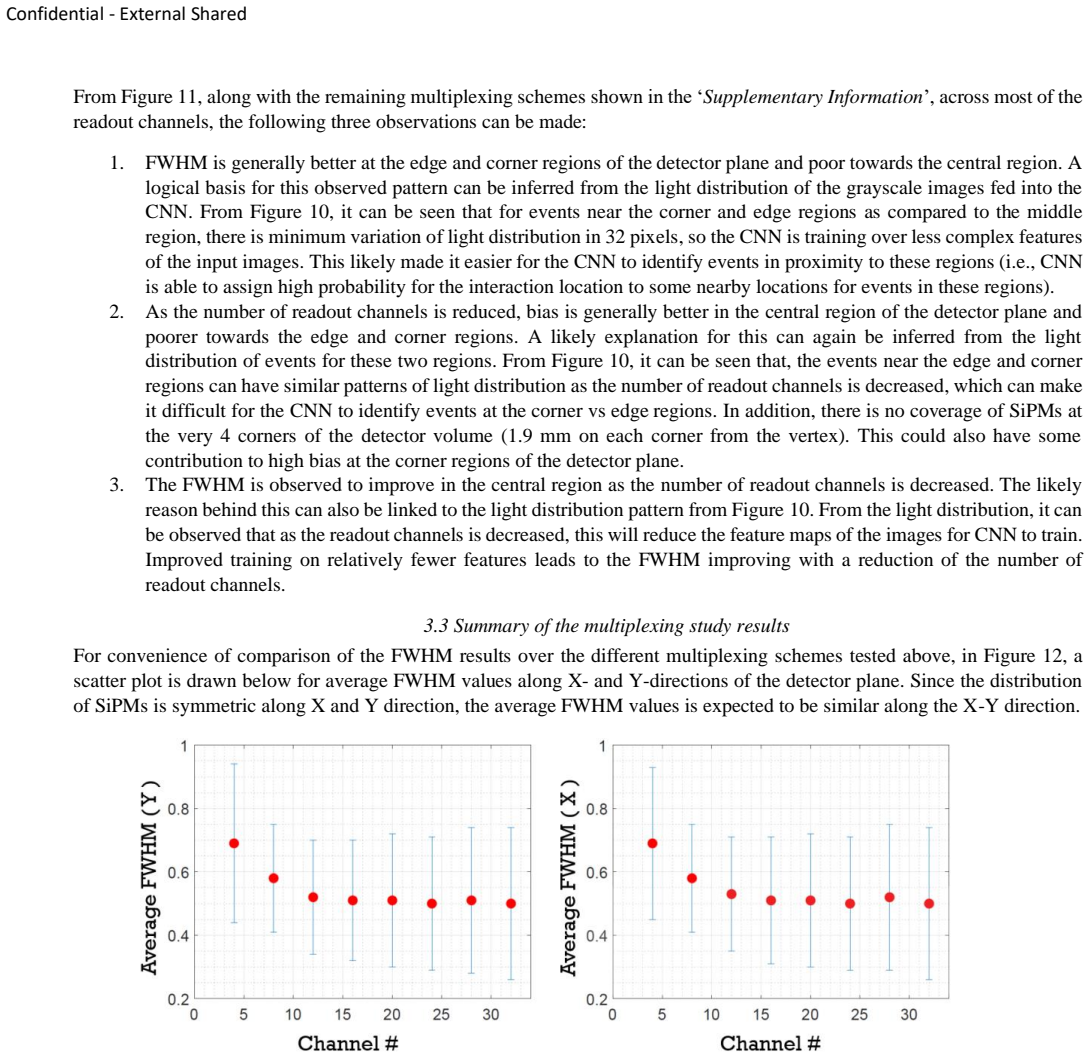
For a single-layer 40 mm x 40 mm x 4 mm LSO monolithic detector with 0.60 mm ESR reflector films on top and bottom and 32 SiPMs distributed around the four sides, the authors show that summing analog SiPM signals before digitization—from 32 channels down to 28, 24, 20, and 16—keeps the average FWHM of the CNN-decoded interaction position nearly constant at about 0.50 mm in both X and Y. The 16-channel readout that pairs adjacent SiPM signals is the lowest channel count that matches the no-multiplexing performance, including the magnitude of corner bias. Reducing to 12, 8, or 4 channels worsens average FWHM and, especially at the detector corners, produces positioning bias that can extend several millimeters away from the true interaction point. The study also finds that not all multiplexing schemes with the same channel count perform equally; combining signals from SiPMs at the corners of neighboring sides tends to help.
Load-bearing premise
The results for a single 4 mm LSO layer carry over to a full multi-layer stack because the paper assumes light collection efficiency and distribution are independent of the number of layers, so inter-crystal scattering and multilayer electronic effects are not simulated.
Editorial extensions
If this is right
- PET detector modules can halve their digitized channel count (from 32 to 16) in this geometry without degrading average spatial resolution, lowering electronics cost and power consumption.
- The choice of which SiPM signals to combine matters: at 16 channels, the best summing patterns give 0.51 mm average FWHM while the worst studied give 0.70 mm, so multiplexing schemes need to be designed deliberately.
- At 12 or fewer channels, corner bias exceeds the 1 mm training-grid pitch, so simple bias correction no longer recovers position accuracy and image reconstruction must model the full point spread function.
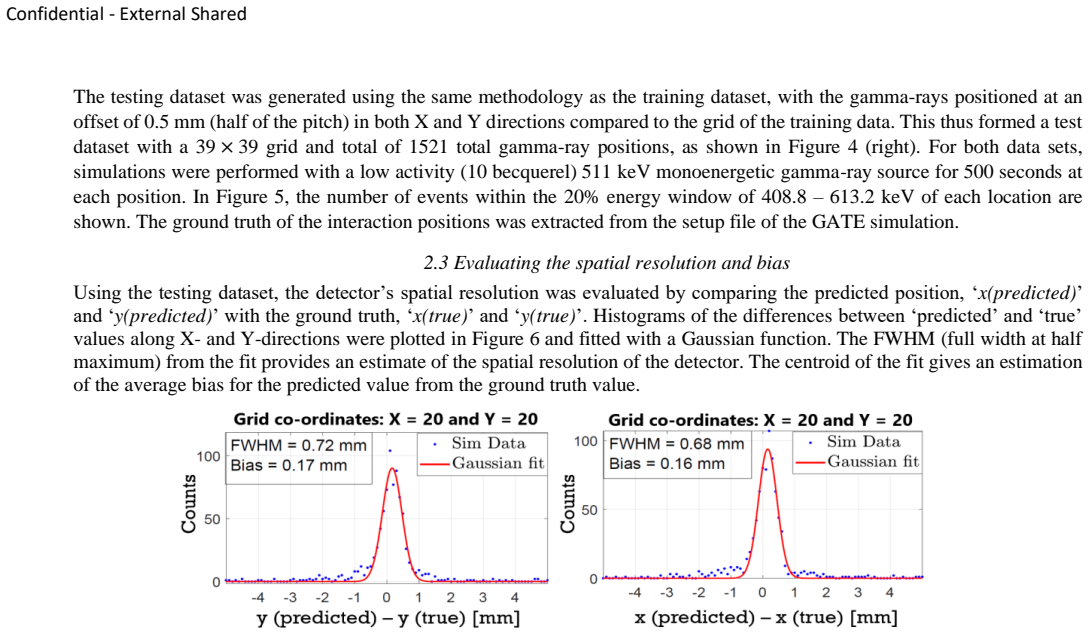
- For the 32-channel readout, applying bias correction across the whole detector plane improves the average FWHM from about 0.50 mm to about 0.34 mm, showing that much of the remaining positioning error is systematic and recoverable.
- Because combining signals from corner-adjacent SiPMs repeatedly improves FWHM and bias, future multiplexing layouts should preserve light-distribution gradients near the detector corners.
Reading between the lines
- If the single-layer-to-multilayer transferability holds, the cost argument extends to a full scanner: a 16-channel-per-layer readout halves the digitizer count for every stacked layer, so the savings grow with the number of layers.
- The same simulation pipeline could test more aggressive or non-uniform multiplexing patterns—such as row-column charge division or unequal grouping—to probe whether the 16-channel floor can be pushed lower while keeping bias correctable.
- Because training and test grids are interleaved, the reported FWHM is a worst-case interpolation test; interactions at continuous random positions might yield different average resolution, and the corner-bias structure could shift.
- The observation that central-region FWHM improves as channels decrease suggests aggressive multiplexing can regularize the CNN by reducing feature maps, implying a trade-off between information loss and network trainability that could guide co-design of hardware and machine learning.
Editorial analysis
A structured set of objections, weighed in public.
Referee Report
Summary. The paper reports a GATE v8.2 simulation study of a single-layer LSO monolithic PET detector plate (40 mm × 40 mm × 4 mm) with four side-mounted 1×8 SiPM arrays (32 SiPMs total). Scintillation light distributions are converted into grayscale images and fed into a CNN that predicts the gamma interaction position by a probability-weighted center-of-mass over a 40×40 training grid. The study then simulates analog multiplexing by summing SiPM signals into 28, 24, 20, 16, 12, 8, and 4 readout channels, evaluating spatial resolution (FWHM) and bias on an interleaved 39×39 test grid. The main finding is that average FWHM remains roughly constant at 0.50–0.51 mm as the channel count is reduced from 32 to 16, with degradation below 16 channels; bias is largest at edges and corners. A bias-correction procedure is also presented, yielding a corrected FWHM of 0.34 mm for the 32-channel case.
Significance. If the findings hold, they provide a practical path to reducing readout electronics cost and power consumption in semi-monolithic PET detectors, which are of current interest for high-resolution and DOI-capable systems. The study is valuable for its systematic comparison of multiple concrete multiplexing schemes, its detailed GATE simulation setup, and its explicit treatment of bias in addition to FWHM. The manuscript is also honest about several limitations, including the omission of inter-crystal scattering and electronic noise. However, two load-bearing aspects—the transferability of single-layer results to multilayer stacks and the interpretation of the bias-corrected 0.34 mm value—need to be addressed before the central claims can be fully accepted.
major comments (3)
- [§2.1, first paragraph] The assertion that 'the light collection efficiency and distribution are independent of the number of layers for the semi-monolithic design' is stated without simulation or analytic support. In a stacked multilayer module, scintillation photons can cross inter-layer ESR interfaces, be reflected or absorbed by adjacent layers, and the boundary conditions repeat at every interface; the paper itself acknowledges in §4 that inter-crystal Compton scattering is not considered. Because the stated motivation is a semi-monolithic detector built from stacked thin plates, the multiplexing ranking obtained from a single-layer simulation may not transfer to the actual detector. Please provide supporting evidence or explicitly reframe the conclusions as applying to the single-layer module only.
- [§3.6, Eq. (2)] The bias-corrected FWHM of 0.34 mm is obtained by estimating the bias from the same test set and then subtracting that estimated bias from the predictions. This is an in-sample correction, not a predictive performance metric: it uses ground-truth information from the test positions to remove a systematic error that would not be known in a real measurement. The comparison of this 0.34 mm value with the uncorrected 0.50 mm average therefore overstates the practically achievable resolution. The bias-correction result should be cross-validated or presented explicitly as a post-hoc illustration of precision after perfect bias knowledge, not as the expected detector resolution.
- [§3.3 and Table 2] The plateau claim that average FWHM remains constant from 32 down to 16 channels relies on single multiplexing schemes for the 28, 24, and 20 channel cases. Since the paper shows that for 16 channels different multiplexing schemes give average FWHM values ranging from 0.51 mm to 0.70 mm (Table 2), the single-scheme points at 28/24/20 may not be representative of the range of achievable performance at those channel counts. Without testing at least two or three schemes for each of these intermediate counts, the conclusion that performance is preserved from 32 to 16 channels is not robust.
minor comments (5)
- [§2.1] Electronic noise is stated to be negligible based on modern SiPM specifications, but the manuscript does not quantify this expectation in the context of summing analog signals. Since multiplexing combines multiple SiPM outputs, correlated or uncorrelated electronic noise contributions could differ across schemes; a brief quantitative estimate or a more explicit limitation statement would help.
- [Figure 8 and §2.4] The caption describes the displayed schemes as those 'found to have optimal detector performance,' but the optimality criterion is not precisely defined (e.g., best average FWHM, best bias bounds, or a combination). Please state the selection rule used.
- [Figure 12 and Table 2] The error bars in Figure 12 are the standard deviation of the per-position FWHM values, not the standard error of the mean. Clarifying this in the caption would prevent readers from misinterpreting the spread as uncertainty in the average.
- [Table 1] The corner test-grid sizes vary from 3×3 to 5×5 across channel counts, so the MSE values are not directly comparable across rows. This should be acknowledged or the analysis should use a fixed region for all channel counts.
- [§3.2] The explanation that reduced feature maps make it 'easier for the CNN to train' and hence improve central-region FWHM is speculative. A quantitative analysis, such as a plot of FWHM versus local light-gradient magnitude, would strengthen this claim.
Circularity Check
Central multiplexing comparison is independent; only the §3.6 bias-corrected FWHM is an in-sample correction.
-
fitted input called prediction
[Section 2.3 / Eq. (2) and Section 3.6]
"After correction of bias from the predicted value, histograms of the differences between ‘bias corrected value’ and ‘true’ values can be plotted along X- and Y- directions (similar to Figure 6) to obtain the bias corrected spatial resolution. ... Bias correction was implemented for the entire 39 × 39 grid of test positions ... As observed from Figure 17, with bias correction FWHM = 0.34 mm (both X- and Y-direction) for the entire detector plane"
The bias subtracted in Eq. (2) is the measured centroid of (predicted − true) on the same 39×39 test grid used for the FWHM evaluation. Consequently, the 'bias-corrected' residuals are the original predictions recentered by their own average error; the 0.34 mm value is, by construction, the spread after removing the in-sample systematic error, not an out-of-sample or predicted resolution. An unbiased estimate would require estimating bias from an independent calibration grid (or from training positions) and applying it to the test positions. This does not affect the uncorrected FWHM comparison in Figure 12/Table 2, since both 32- and 16-channel values are computed without this correction.
full rationale
Most of the paper's derivation chain is self-contained: GATE simulation produces photon counts; a CNN is trained on a 40×40 grid and tested on an interleaved 39×39 grid; FWHM is computed from test residuals. The multiplexing comparison (32→16 channels) is an empirical simulation result and is not circular. The §2.1 assertion that single-layer results transfer to multilayer is an unverified extrapolation rather than a circular reduction. The only in-sample step is the bias correction in §3.6, where the same test set's true positions are used to compute and subtract the bias, making the 0.34 mm number an in-sample residual rather than an independent prediction. Because the main 16-channel conclusion is based on uncorrected FWHM, the overall circularity is partial and localized.
Assumptions & free parameters
free parameters (5)
- ESR reflectance =
0.98
- SiPM detection efficiency =
0.5
- Energy window =
408.8-613.2 keV (20% window)
- CNN filter count =
200
- CNN training configuration =
epochs=10, lr=0.001, sgdm
assumptions (4)
- domain assumption GATE/Geant4 optical transport correctly models scintillation photon propagation in LSO with ESR and SiPM boundaries.
- domain assumption The light collection efficiency and light distribution are independent of the number of layers in the semi-monolithic stack, so a single-layer simulation is sufficient to evaluate multiplexing.
- domain assumption Electronic noise from SiPM readout is negligible compared with photon statistics.
- standard math The CNN's classification output probabilities, weighted by calibration positions, give an unbiased position estimate when bias is corrected.
Cite this review
Pith. "Pith review of Feasibility study of multiplexing analog signals from SiPMs for a single layer monolithic PET detector design." pith.science (2026). https://pith.science/paper/QYNLI76R
@misc{pith2026250207777,
  author       = {Pith},
  title        = {Pith review of: Feasibility study of multiplexing analog signals from SiPMs for a single layer monolithic PET detector design},
  year         = {2026},
  howpublished = {\url{https://pith.science/paper/QYNLI76R}},
  note         = {Machine review of arXiv:2502.07777}
}
read the original abstract
Semi monolithic detector designs with a series of stacked thin monolithic scintillator plates and side readout are an attractive approach for potentially achieving very high performance in a positron emission tomography (PET) scanner. In this work, a simulation study of a single layer monolithic detector module was performed with side read out of scintillation light using GATEv8.2. In this design, a single layer LSO crystal was used with dimensions 40 mm*40 mm*40 mm, with 0.60 mm thickness of the ESR (enhanced specular reflector) films covering the crystal's top and bottom surfaces. The photons generated in the scintillation process induced by the gamma ray hitting the crystal were detected by four 1*8 SiPM (silicon photomultiplier) arrays placed along the four sides of the crystal. The scintillation light distribution detected by all of the 32 SiPMs surrounding the crystal layer was then used to extract the gamma-crystal interaction location based on machine learning analysis. In this work, the spatial resolution of the detector module was explored when analog signals from each of the 32 SiPMs were summed to 28, 24, 20, 16, 12, 8, and 4 total outputs. This study showed that good spatial resolution can be achieved even when the number of read out channels is decreased by multiplexing, which can reduce the overall detector manufacturing cost.
Figures


Figures from the paper (18 more)





Reference graph
Works this paper leans on
-
[14]
Simple charge division readouts for imaging scintillator arrays using a multi-channel PMT,
S. Siegel, R. Silverman, Y. Shao and S. Cherry, "Simple charge division readouts for imaging scintillator arrays using a multi-channel PMT," IEEE Transactions on Nuclear Science, vol. 43, no. 3, pp. 1634-1641, 1996
work page 1996
-
[19]
Silicon photomultiplier signal readout and multiplexing techniques for positron emission tomography,
H. Park, M. Yi and J. Lee, "Silicon photomultiplier signal readout and multiplexing techniques for positron emission tomography," Biomed Eng Lett., vol. 12, no. 3, pp. 263-283, 2022
work page 2022
-
[4]
P. Peng, M. S. Judenhofer, A. Q. Jones and S. R. Cherry, "Compton PET: A Simulation Study for a PET Module with Novel Geometry and Machine Learning for Position Decoding," Biomedical physics & engineering express, vol. 5, no. 1, 2019
work page 2019
-
[5]
Compton PET: a layered structure PET detector with high performance,
P. Peng, M. S. Judenhofer and S. R. Cherry, "Compton PET: a layered structure PET detector with high performance," Physics in Medicine & Biology, vol. 64, no. 10, p. 10LT01, 2019
work page 2019
-
[1]
An analysis of side readouts of monolithic scintillation crystals,
X. Li and L. Furenlid, "An analysis of side readouts of monolithic scintillation crystals," 2016
work page 2016
-
[2]
An edge-readout, multilayer detector for positron emission tomography.,
X. Li, M. Ruiz-Gonzalez and L. R. Furenlid, "An edge-readout, multilayer detector for positron emission tomography.," Medical Physics, vol. 45, no. 6, 2018
work page 2018
-
[3]
Performance of a SiPM based semi -monolithic scintillator PET detector,
X. Zhang, X. Wang, N. Ren, Z. Kuang, X. Deng, X. Fu, S. Wu, Z. Sang, Z. Hu, D. Liang, X. Liu, H. Zheng and Y. Yang, "Performance of a SiPM based semi -monolithic scintillator PET detector," Physics in Medicine & Biology, vol. 62, no. 19, pp. 7889-7904, 2017
work page 2017
-
[6]
Timing evaluation of a PET detector block based on semi-monolithic LYSO crystals,
N. Cucarella, J. Barrio, E. Lamprou, C. Valladares, J. Benlloch and A. Gonzalez, "Timing evaluation of a PET detector block based on semi-monolithic LYSO crystals," Med. Phys., vol. 48, no. 12, p. 8010–8023, 2021
work page 2021
Show all 29 references
-
[7]
Tomographic imaging with Compton PET modules: ideal case and first implementation,
P. Peng, M. Zhang, N. Zeraatkar, J. Qi and S. R. Cherry, "Tomographic imaging with Compton PET modules: ideal case and first implementation," Journal of Instrumentation, vol. 16, no. 04, p. T04007, 2021
2021
-
[8]
A semi -monolithic detector providing intrinsic DOI-encoding and sub-200 ps CRT TOF-capabilities for clinical PET applications,
F. Mueller, S. Naunheim, Y. Kuhl, D. Schug, T. Solf and V. Schulz, "A semi -monolithic detector providing intrinsic DOI-encoding and sub-200 ps CRT TOF-capabilities for clinical PET applications," Med Phys., pp. 1-20, 2022. Page17 Confidential - External Shared
2022
-
[9]
Timing evaluation of a PET detector block based on semi-monolithic LYSO crystals,
N. Cucarella, J. Barrio, E. Lamprou, C. Valladares, J. Benlloch and A. Gonzalez, "Timing evaluation of a PET detector block based on semi-monolithic LYSO crystals," Med. Phys., vol. 48, pp. 8010-8023, 2021
2021
-
[10]
A Prototype High -Resolution Small-Animal PET Scanner Dedicated to Mouse Brain Imaging,
Y. Yang, J. Bec, J. Zhou, M. Zhang, M. Judenhofer, X. Bai, K. Di, Y. Wu, M. Rodriguez, P. Dokhale, K. Shah, R. Farrell and J. C. S. Qi, "A Prototype High -Resolution Small-Animal PET Scanner Dedicated to Mouse Brain Imaging," J Nucl Med., vol. 57, no. 7, pp. 1130-5, 2016
2016
-
[11]
Performance of a PET Insert for High-Resolution Small-Animal PET/MRI at 7 Tesla,
G. Stortz, J. Thiessen, D. Bishop, M. Khan, P. Kozlowski, F. Retière, G. Schellenberg, E. Shams, X. Zhang, C. Thompson, A. Goertzen and V. Sossi, "Performance of a PET Insert for High-Resolution Small-Animal PET/MRI at 7 Tesla," J Nucl Med., vol. 59, no. 3, pp. 536-542, 2018
2018
-
[12]
Submillimeter-Resolution PET for High-Sensitivity Mouse Brain Imaging,
H. Kang, H. Tashima, H. Wakizaka, F. Nishikido, M. Higuchi, M. Takahashi and T. Yamaya, "Submillimeter-Resolution PET for High-Sensitivity Mouse Brain Imaging," J Nucl Med., vol. 64, no. 6, pp. 978-985, 2023
2023
-
[13]
Recent development in PET instrumentation,
B. H. Peng and C. S. Levin, "Recent development in PET instrumentation," Current pharmaceutical biotechnology, vol. 11, no. 6, p. 555–571, 2010
2010
-
[15]
Effect of Number of Readout Channels on the Intrinsic Spatial Resolution Performance of a Continuous Miniature Crystal Element (cMiCE) Detector,
R. S. Miyaoka, T. Ling and T. K. Lewellen, "Effect of Number of Readout Channels on the Intrinsic Spatial Resolution Performance of a Continuous Miniature Crystal Element (cMiCE) Detector," IEEE Transactions on Nuclear Science, vol. 54, no. 5, pp. 1561-1567, 2007
2007
-
[16]
Study of PET Detector Performance With Varying SiPM Parameters and Readout Schemes,
X. Li, C. Lockhart, T. K. Lewellen and R. S. Miyaoka, "Study of PET Detector Performance With Varying SiPM Parameters and Readout Schemes," IEEE Transactions on Nuclear Science, vol. 58, no. 3, pp. 590-596, 2011
2011
-
[17]
Investigation of analog charge multiplexing schemes for SiPM based PET block detectors,
E. Downie, X. Yang and H. Peng, "Investigation of analog charge multiplexing schemes for SiPM based PET block detectors," Physics in Medicine & Biology, vol. 58, no. 11, p. 3943, 2013
2013
-
[18]
Multiplexing strategies for monolithic crystal PET detector modules,
L. A. Pierce, W. C. J. Hunter, D. R. Haynor, L. R. MacDonald, P. E. Kinahan and R. S. Miyaoka, "Multiplexing strategies for monolithic crystal PET detector modules," Physics in Medicine & Biology, vol. 59, no. 18, p. 5347, 2014
2014
-
[20]
GATE: a simulation toolkit for PET and SPECT,
S. Jan, G. Santin, D. Strul, K. Assié, D. Autret and et.a., "GATE: a simulation toolkit for PET and SPECT," Physics in Medicine & Biology, vol. 49, p. 4543, 2004
2004
-
[21]
Advanced Monte Carlo simulations of emission tomography imaging systems with GATE,
D. Sarrut, M. Bała, M. Bardiès, J. Bert, M. Chauvin, K. Chatzipapas, M. Dupont, A. Etxebeste, F. L. M, S. Jan, G. Kayal, K. A. S, P. Kowalski, W. Krzemien, J. Labour, M. Lenz, G. Loudos, B. Mehadji, L. Ménard, C. Morel, P. Papadimitroulas, M. Rafecas, J. S alvadori, D. Seiter,...
2021
-
[22]
The OpenGATE ecosystem for Monte Carlo simulation in medical physics,
D. Sarrut, N. Arbor, T. Baudier, D. Borys, A. Etxebeste, H. Fuchs, J. Gajewski, L. Grevillot, S. Jan, G. Kagadis, H. Kang, A. Kirov, O. Kochebina, W. Krzemien, A. Lomax, P. Papadimitroulas, C. Pommranz, E. Roncali, A. Rucinski, C. Winterhalter and L. Maign e, "The OpenGATE eco...
2022
-
[23]
Experimental Validation of an Efficient Fan -Beam Calibration Procedure for k -Nearest Neighbor Position Estimation in Monolithic Scintillator Detectors,
G. Borghi, V. Tabacchini, S. S. and D. R. Schaart, "Experimental Validation of an Efficient Fan -Beam Calibration Procedure for k -Nearest Neighbor Position Estimation in Monolithic Scintillator Detectors," IEEE TRANSACTIONS ON NUCLEAR SCIENCE, vol. 62, no. 1, pp. 57-67, 2015....
2015
-
[24]
Monolithic LaBr3:Ce crystals on silicon photomultiplier arrays for time -of-flight positron emission tomography,
S. Seifert, H. T. v. Dam, J. Huizenga, R. Vinke, P. Dendooven, H. Löhner and D. R. Schaart, "Monolithic LaBr3:Ce crystals on silicon photomultiplier arrays for time -of-flight positron emission tomography," Physics in Medicine & Biology, vol. 57, no. 8, p. 2219, 2012
2012
-
[25]
First characterization of a digital SiPM based time-of-flight PET detector with 1 mm spatial resolution,
S. Seifert, G. v. d. Lei, H. T. v. Dam and D. R. Schaart, "First characterization of a digital SiPM based time-of-flight PET detector with 1 mm spatial resolution," Physics in Medicine & Biology, vol. 58, no. 9, p. 3061, 2013
2013
-
[26]
Concept development of an on-chip PET,
C. Clement, G. Birindelli, M. Pizzichemi, F. Pagano, M. Kruithof-De Julio, S. Ziegler, A. Rominger, E. Auffray and K. Shi, "Concept development of an on-chip PET," EJNMMI Phys, vol. 9, no. 1, p. 38, 2022
2022
-
[27]
Deep learning based methods for gamma ray interaction location estimation in monolithic scintillation crystal detectors,
L. Tao, X. Li, L. R. Furenlid and C. S. Levin, "Deep learning based methods for gamma ray interaction location estimation in monolithic scintillation crystal detectors," Physics in Medicine & Biology, vol. 65, no. 11, p. 115007, 2020
2020
-
[28]
Deep residual -convolutional neural networks for event positioning in a monolithic annular PET scanner.,
G. Jaliparthi, P. F. Martone, A. V. Stolin and R. R. Raylman, "Deep residual -convolutional neural networks for event positioning in a monolithic annular PET scanner.," Physics in medicine and biology, vol. 66, no. 14, 2021. Page19 Confidential - External Shared
2021
-
[29]
SUPPLEMENTARY INFORMATION This section includes a discussion of all the multiplexing schemes for readout channels 16, 12, 8, and 4 that were evaluated (excludes multiplexing schemes for 28, 24, 20 channel readout that were presented in the main manuscript along with the 32- ch...
Reviewed August 8, 2026 · model on record in the stance chip above.
Discussion (0). Continue with ORCID to comment.