REVIEW 3 major objections 5 minor 56 references
An Improved Approach to Estimate the Internal Resistance of a Battery During the HPPC Test
T0 review · 3 major / 5 minor · reviewed 2026-08-15 · deepseek-v4-flash
Pith's one-line read Standard HPPC internal-resistance estimates are biased upward by the voltage shift caused by the pulse itself, and a least-squares OCV correction removes most of that bias.
desk verdict Solid, honest extension that fixes a real bias in HPPC resistance estimation, but the real-cell claims need an independent reference before they are taken as established. read the letter →
The pith
A machine-rendered reading of the paper's core claim, the machinery that carries it, and where it could break.
The reading
What carries the argument
The load-bearing object is the linear observation model z = Hx + n (Eq. 30), whose columns are the constant discharge current, a constant '1', and the cumulative coulombs C{a(tx,t0)} drawn up to each sample. It collapses the OCV-SOC relationship into a single scalar κ under the assumption that the OCV-SOC slope is constant across the pulse, so the initial OCV E(s(t0)), resistance R0, and κ can be recovered together by nonnegative least squares. The corrected resistance (Eq. 36) subtracts the estimated OCV drift ΔÊ = κ̂LS C{a(t1,t0)} from the measured voltage drop before dividing by current.
What would settle it
Run the same HPPC pulse at SOC 0.15 and compare the corrected estimate (simulation predicts 7.47 mΩ at 22.5 A) against an EIS measurement or a 1 ms pulse resistance; if the true resistance is near 5 mΩ, the constant-slope assumption is the cause. More directly, split the 30 s pulse into early and late halves, fit κ separately to each, and check whether the two values differ by more than the estimation uncertainty — if they do, the model is misspecified in exactly the band the paper flags.
Extended reading notes
Core claim
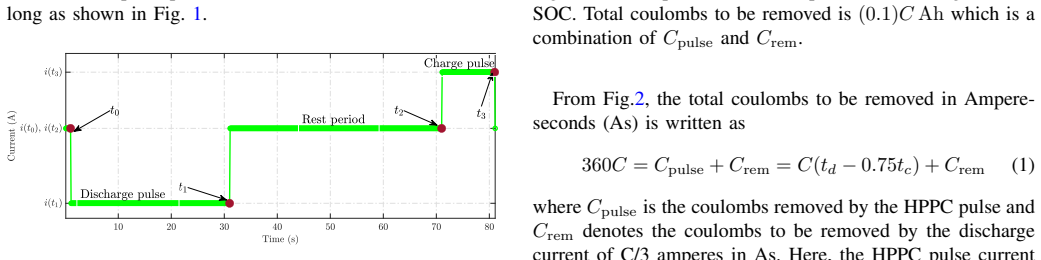
The central claim is that the conventional HPPC resistance estimator, R0 = |Δv/Idis|, is biased upward by exactly ΔE/Idis, where ΔE is the open-circuit voltage change caused by the pulse, and that ΔE can be estimated from the same pulse data. The paper constructs a vector observation model in which each sampled terminal voltage during the pulse is expressed as Idis R0 + E(s(t0)) + κ times the cumulative coulombs drawn, with κ the ratio of OCV-SOC slope to capacity. Solving the nonnegative least-squares problem gives R0, the initial OCV, and κ simultaneously; the corrected resistance is (Δv - ΔÊ)/Idis. In controlled simulation with true R0 = 5 mΩ, the standard estimate ranged from 7.0 to 19.6 mΩ depending on SOC, while the corrected estimate stayed near 5 mΩ except at SOC 0.15 where it reached 7.47 mΩ.
Load-bearing premise
The method assumes the slope of the OCV-versus-SOC curve is constant across each 30-second pulse; when the curve bends sharply, as between roughly 10% and 30% SOC, the fitted κ is a biased average and the corrected resistance remains overestimated.
Editorial extensions
If this is right
- Battery management systems that run HPPC-style pulses can reduce resistance bias without adding sensors or prior knowledge of SOC or capacity.
- Reported internal resistance values from standard HPPC tests, and the state-of-power and state-of-health conclusions built on them, are systematically high, especially under high current and low SOC.
- The correction makes resistance estimates nearly independent of the pulse's SOC operating point, except in the 10-30% SOC band where OCV curvature remains.
- Because the method needs only voltage, current, and time samples from the existing pulse, it can be retrofitted to past HPPC datasets.
Reading between the lines
- Extending the model from one scalar κ to a piecewise-linear or quadratic OCV segment would likely close the residual 49% error at SOC 0.15; the data already collected contain the necessary samples.
- The same bias argument applies to shorter or longer pulses: the correction term scales with pulse duration, so any standardized pulse with non-negligible coulomb throughput is affected.
- A direct field test would be to compare corrected HPPC resistance against electrochemical impedance spectroscopy at the same SOC; the paper's claim implies the two should agree much more closely than uncorrected HPPC does.
Signed reviews
Editorial analysis
A structured set of objections, weighed in public.
Referee Report
Summary. This paper addresses internal resistance estimation in HPPC tests. The authors show that the conventional calculation R0 = |Δv/Idis| overestimates the true ohmic resistance because it neglects the open-circuit voltage change ΔE during the pulse. They propose a least-squares observation model (Eq. 30) that simultaneously estimates R0, the initial OCV, and an effective OCV slope κ from the sampled terminal voltage during the discharge pulse, assuming a constant OCV-SOC gradient. The corrected estimate is R0 = (Δv − κ̂C)/Idis. Simulation with a known 5 mΩ resistance shows the proposed method reduces estimation error from up to 291.7% to at most 49.3% across SOC, and the method is applied to four Molicel INR-21700-P42A cells, where it reduces the HPPC resistance estimates by 5–20 mΩ.
Significance. The paper's core derivation is sound, and the simulation benchmark against a known ground-truth resistance is a strength; it clearly demonstrates that the conventional HPPC resistance is inflated by the OCV drop, and the proposed correction is attractive because it requires no additional battery information such as SOC, capacity, or OCV parameters. If the accuracy on real cells were established, the method would be a low-cost improvement for BMS resistance estimation. However, the claimed accuracy is not yet established: the constant-gradient assumption fails substantially at low SOC, and the real-cell experiments lack an independent resistance reference, so the central quantitative claim is only partly supported.
major comments (3)
- [Section IV, Eqs. (26)–(29), and Table II] The central assumption of a constant OCV-SOC gradient over the pulse is load-bearing and it breaks down at low SOC. The authors' own Table II shows the proposed estimate has 49.31% error at SOC 0.15, versus 0.39% at SOC 0.5, and the conclusion acknowledges that the gradient changes significantly between 10% and 30% SOC. Since the paper claims accurate resistance estimation, this SOC dependence should be quantified and the valid operating range of the method should be stated; otherwise the reported 49.3% error is not an accuracy guarantee but a bound that is too large for many BMS applications.
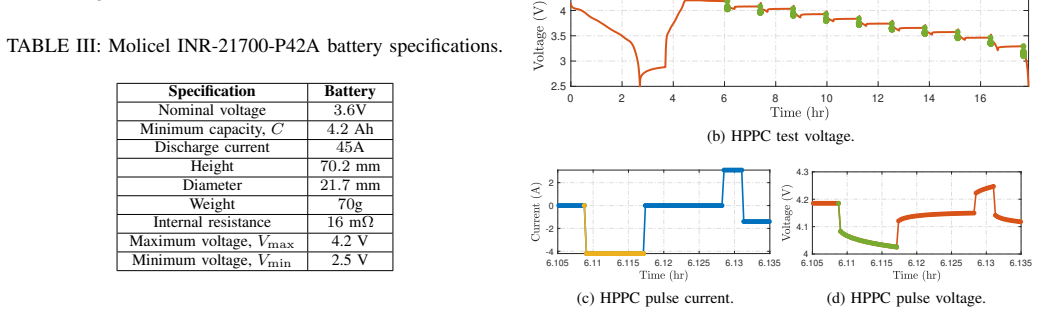
- [Section VI, Fig. 11 and Table III] The real-cell results are not validated against any independent resistance reference. The proposed estimates are compared only to the biased HPPC ratio of Eq. (4), so the reported reduction of 5–20 mΩ cannot be distinguished from a systematic downward shift. The manufacturer datasheet quoted in Table III lists an internal resistance of 16 mΩ, but no comparison is made to this value. An independent measurement, such as EIS at a comparable frequency, a short sub-second pulse, or a manufacturer reference, is needed to establish that the corrected values are closer to the true resistance.
- [Section V, Remark 3, and Eqs. (23)–(30)] The observation model assumes an R-int circuit with no RC polarization. Over a 30 s HPPC pulse, real cells exhibit an exponential polarization transient; this unmodeled term will be absorbed by the κ regressor and the intercept, biasing the estimated R0. The simulation in Section V uses only R-int data, so the magnitude of this bias is not quantified. The authors should test the estimator on data with realistic RC dynamics, or restrict the method to timescales where the R-int model is a better approximation and provide evidence for that restriction.
minor comments (5)
- [Section IV, Eq. (32)] The optimization in Eq. (32) is written as an arg max of the squared residual norm, which is unbounded; it should be arg min to match the least-squares objective and the use of 'lsqnonneg'.
- [Section V.C] The 'gain' metric is defined as the difference between two percentage errors (e.g., 291.67 − 49.31 = 242.36 percentage points), but the abstract phrases this as a 'performance gain in the range of 30% to more than 250% in percentage estimation error', which is ambiguous and should be restated as a reduction in percentage-point error.
- [Section II.B, Algorithm 1] The initiation procedure states that the battery is discharged to Vmin, rested, charged to Vmax, and rested again, but the rest times are not consistently specified; clarifying that the first rest is one hour and the post-charge rest is one hour would improve reproducibility.
- [Section V, Fig. 5] Figures 5(b)–(d) show both terminal voltage and OCV, but the captions do not clearly identify which curve corresponds to E(s(k)) and which to v(k); adding labels to the figure or caption would remove ambiguity.
- [Section IV and Reference [52]] The observation model is attributed to the authors' own under-review paper [52]; although the model is written out in full here, citing a version with a preprint identifier or a self-contained derivation would help readers verify the provenance.
Circularity Check
No circularity: the proposed R0 and kappa are jointly estimated from measured voltage, with the simulation benchmarked against a known ground truth.
full rationale
The derivation chain is self-contained. The claimed overestimation of the standard HPPC resistance estimate follows algebraically from the R-int model in Eqs. (7)–(13): the measured voltage difference includes both the ohmic drop and the OCV change, so ignoring the OCV change inflates the resistance estimate. The proposed observation model in Eq. (30) regresses measured terminal voltage on regressors [I, 1, C] to jointly estimate R0, E(s(t0)), and kappa; these parameters are separately identifiable from the data because the regressor columns are distinct, so R0 is not forced to equal any fitted ratio by construction. The simulation section provides an external ground truth: the simulator is configured with a known true R0 = 5 mΩ, and the proposed estimator recovers values close to that truth (e.g., 5.0784 mΩ at full SOC), so the claimed performance gain is a genuine quantitative comparison against a known reference, not a renaming of inputs. The constant-gradient assumption in Eq. (26) is explicit and its violation at low SOC is acknowledged in the conclusion as a limitation; this is a modeling approximation, not a circular step. The self-citations to [52] and [45] supply context and an observation-model reference, but the model is fully written and derived in this paper, so those citations are not load-bearing. The real-cell results lack an independent resistance reference, but that is a validation gap rather than circularity: the paper does not claim to have independently verified the absolute accuracy of the corrected real-cell values, only that they are lower than the HPPC estimates. Overall, no step in the derivation reduces by definition or by fitted-parameter renaming to its own input.
Assumptions & free parameters
free parameters (1)
- Combined+3 OCV model coefficients u0..u7 =
u0=-9.082, u1=103.087, u2=-18.185, u3=2.062, u4=-0.102, u5=-76.604, u6=141.199, u7=-1.117
assumptions (5)
- domain assumption Battery terminal voltage follows the R-int model v(k)=E(s(k))+i(k)R0 with no RC/polarization dynamics over the pulse.
- ad hoc to paper The OCV-SOC gradient f'_em(s) is constant during the pulse.
- domain assumption The terminal voltage at t0 equals the OCV E(s(t0)), i.e., the cell is at rest equilibrium before the pulse.
- standard math Charge removed is computed by rectangular (constant-current) integration with known Idis and sampling time Ts.
- domain assumption The OCV-SOC curve is monotonically non-decreasing and all unknowns are nonnegative.
Cite this review
Pith. "Pith review of An Improved Approach to Estimate the Internal Resistance of a Battery During the HPPC Test." pith.science (2026). https://pith.science/paper/4BRTCLYN
@misc{pith2026250506410,
  author       = {Pith},
  title        = {Pith review of: An Improved Approach to Estimate the Internal Resistance of a Battery During the HPPC Test},
  year         = {2026},
  howpublished = {\url{https://pith.science/paper/4BRTCLYN}},
  note         = {Machine review of arXiv:2505.06410}
}
read the original abstract
This paper considers the problem of resistance estimation in electronic systems including battery management systems (BMS) and battery chargers. In typical applications, the battery resistance is obtained through an approximate method computed as the ratio of the voltage difference to the applied current excitation pulse or vice versa for admittance. When estimating the battery resistance, this approach ignores the change in the open circuit voltage (OCV) as a result of the excitation signal. In this paper, we formally demonstrate and quantify the effect of the OCV drop on the errors in internal resistance estimation. Then, we propose a novel method to accurately estimate the internal resistance by accounting for the change in OCV caused by the applied current excitation signal. The proposed approach is based on a novel observation model that allows one to estimate the effect of OCV without requiring any additional information, such as the state of charge (SOC), parameters of the OCV-SOC curve, and the battery capacity. As such, the proposed approach is independent of the battery chemistry, size, age, and the ambient temperature. A performance analysis of the proposed approach using the battery simulator shows significant performance gain in the range of 30% to more than 250% in percentage estimation error. Then, the proposed approach is applied for resistance estimation during the hybrid pulse power characterization (HPPC) of cylindrical Li-ion battery cells. Results from tested batteries show that the proposed approach reduced the overestimated internal resistance of the batteries by up to 20 m{\Omega}.
Figures


Figures from the paper (6 more)



Reference graph
Works this paper leans on
-
[52]
Open circuit voltage and resistance estimation using on-off pulses,
P. Pillai, S. Desai, S. Sunil, K. Pattipati, and B. Balasingam, “Open circuit voltage and resistance estimation using on-off pulses,” IEEE Transactions on Transportation Electrification (under review) , 2024
work page 2024
-
[1]
Status and challenges facing representative anode materials for rechargeable lithium batteries,
L. Zhang, C. Zhu, S. Yu, D. Ge, and H. Zhou, “Status and challenges facing representative anode materials for rechargeable lithium batteries,” Journal of Energy Chemistry , vol. 66, pp. 260–294, 2022
work page 2022
-
[2]
C. Capasso and O. Veneri, “Experimental analysis on the performance of lithium based batteries for road full electric and hybrid vehicles,” Applied Energy, vol. 136, pp. 921–930, 2014
work page 2014
-
[3]
Balasingam, Robust Battery Management System Design With MAT- LAB
B. Balasingam, Robust Battery Management System Design With MAT- LAB. Artech House, 2023
work page 2023
-
[4]
Battery management system: An overview of its application in the smart grid and electric vehicles,
H. Rahimi-Eichi, U. Ojha, F. Baronti, and M.-Y . Chow, “Battery management system: An overview of its application in the smart grid and electric vehicles,” IEEE industrial electronics magazine , vol. 7, no. 2, pp. 4–16, 2013
work page 2013
-
[5]
S. Saberi, M. Stockinger, C. Stoeckl, B. Buchmayr, H. Weiss, R. Af- sharnia, and K. Hartl, “A new development of four-point method to measure the electrical resistivity in situ during plastic deformation,” Measurement, vol. 180, p. 109547, 2021
work page 2021
-
[6]
Electrical and physical sensors for biomedical implants,
P. Kassanos, S. Anastasova, and G.-Z. Yang, “Electrical and physical sensors for biomedical implants,” Implantable Sensors and Systems: From Theory to Practice , pp. 99–195, 2018
work page 2018
-
[7]
Analysis and validation of electrical safety procedures for biomedical devices,
D. Rubio, N. Lescouli ´e, D. Arce, M. Roberti, and S. Ponce, “Analysis and validation of electrical safety procedures for biomedical devices,” in VIII Latin American Conference on Biomedical Engineering and XLII National Conference on Biomedical Engineering: Proceedings of CLAIB-CNIB 2019, October 2-5, 2019, Canc´un, M´exico, pp. 1434–1440, Springer, 2020
work page 2019
Show all 56 references
-
[8]
Bioimpedance sensors: A tutorial,
P. Kassanos, “Bioimpedance sensors: A tutorial,” IEEE Sensors Journal, vol. 21, no. 20, pp. 22190–22219, 2021
2021
-
[9]
Schumacher bt-100 battery load tester
S. Electric, “Schumacher bt-100 battery load tester.” https://www. schumacherelectric.com, n.d. Accessed: 2025-03-05
2025
-
[10]
Performance tool w2988 100 amp battery load tester
W. LLC, “Performance tool w2988 100 amp battery load tester.” https: //www.wilmarllc.com, n.d. Accessed: 2025-03-05
2025
-
[11]
Bosch 100 amps battery load tester
Bosch, “Bosch 100 amps battery load tester.” https://www.autozone.com, n.d. Accessed: 2025-03-05
2025
-
[12]
Neiko 40510a car battery tester
N. Tools, “Neiko 40510a car battery tester.” https://www.neikotools.com, n.d. Accessed: 2025-03-05
2025
-
[13]
Cen-tech 100 amp, 6/12v battery load tester
H. F. Tools, “Cen-tech 100 amp, 6/12v battery load tester.” https://www. harborfreight.com, n.d. Accessed: 2025-03-05
2025
-
[14]
The 7 best instruments to measure resistance,
Keysight Technologies, “The 7 best instruments to measure resistance,”
-
[15]
Characteristics evaluation of 14 battery equivalent circuit models,
S. Jung and A. Tullu, “Characteristics evaluation of 14 battery equivalent circuit models,” IEEE Access, 2023
2023
-
[16]
A comparison of time-domain implementation methods for fractional-order battery impedance models,
B. Ospina Agudelo, W. Zamboni, and E. Monmasson, “A comparison of time-domain implementation methods for fractional-order battery impedance models,” Energies, vol. 14, no. 15, p. 4415, 2021
2021
-
[17]
Application of electrochemical impedance spectroscopy to commercial li-ion cells: A review,
N. Meddings, M. Heinrich, F. Overney, J.-S. Lee, V . Ruiz, E. Napolitano, S. Seitz, G. Hinds, R. Raccichini, M. Gaber ˇsˇcek, et al., “Application of electrochemical impedance spectroscopy to commercial li-ion cells: A review,” Journal of Power Sources , vol. 480, p. 228742, 2020
2020
-
[18]
Electrochemical impedance spectroscopy based estimation of the state of charge of lithium-ion batteries,
U. Westerhoff, T. Kroker, K. Kurbach, and M. Kurrat, “Electrochemical impedance spectroscopy based estimation of the state of charge of lithium-ion batteries,” Journal of Energy Storage , vol. 8, pp. 244–256, 2016
2016
-
[19]
Eis study on metal hydride electrodes using a porous model: Fitting methodology and soc effects.,
M. Martinez, E. Teliz, C. F. Zinola, and V . D ´ıaz, “Eis study on metal hydride electrodes using a porous model: Fitting methodology and soc effects.,” Journal of Energy Storage , vol. 27, p. 101067, 2020
2020
-
[20]
Electrochemical impedance spec- troscopy,
M. E. Orazem and B. Tribollet, “Electrochemical impedance spec- troscopy,” New Jersey, vol. 1, pp. 383–389, 2008
2008
-
[21]
Battery parameter analysis through electrochemical impedance spectroscopy at different state of charge levels,
Y . Wu, S. Sundaresan, and B. Balasingam, “Battery parameter analysis through electrochemical impedance spectroscopy at different state of charge levels,” Journal of Low Power Electronics and Applications , vol. 13, no. 2, p. 29, 2023
2023
-
[22]
Ga-based approach to optimize an equivalent electric circuit model of a li-ion battery-pack,
V . Pizarro-Carmona, S. Castano-Solis, M. Cortes-Carmona, J. Fraile- Ardanuy, and D. Jimenez-Bermejo, “Ga-based approach to optimize an equivalent electric circuit model of a li-ion battery-pack,”Expert Systems with Applications, vol. 172, p. 114647, 2021
2021
-
[23]
Impedance analysis and parameter estimation of lithium-ion batteries using the eis technique,
H. Nunes, J. Martinho, J. Fermeiro, J. Pombo, S. Mariano, and M. do Ros ´ario Calado, “Impedance analysis and parameter estimation of lithium-ion batteries using the eis technique,” IEEE Transactions on Industry Applications, 2024
2024
-
[24]
Review of elec- trochemical impedance spectroscopy methods for lithium-ion battery diagnostics and their limitations,
K. Nov ´akov´a, V . Pape ˇz, J. Sadil, and V . Knap, “Review of elec- trochemical impedance spectroscopy methods for lithium-ion battery diagnostics and their limitations,” Monatshefte f ¨ur Chemie-Chemical Monthly, vol. 155, no. 3, pp. 227–232, 2024
2024
-
[25]
State-of-charge estimation of the lithium-ion battery using an adaptive extended kalman filter based on an improved thevenin model,
H. He, R. Xiong, X. Zhang, F. Sun, and J. Fan, “State-of-charge estimation of the lithium-ion battery using an adaptive extended kalman filter based on an improved thevenin model,” IEEE Transactions on vehicular technology, vol. 60, no. 4, pp. 1461–1469, 2011
2011
-
[26]
State of charge estimation for electric vehicle batteries using unscented kalman filtering,
W. He, N. Williard, C. Chen, and M. Pecht, “State of charge estimation for electric vehicle batteries using unscented kalman filtering,” Micro- electronics Reliability, vol. 53, no. 6, pp. 840–847, 2013
2013
-
[27]
A state of charge estimation method for lithium-ion batteries based on fractional order adaptive extended kalman filter,
Q. Zhu, M. Xu, W. Liu, and M. Zheng, “A state of charge estimation method for lithium-ion batteries based on fractional order adaptive extended kalman filter,” Energy, vol. 187, p. 115880, 2019
2019
-
[28]
State of charge estimation for limn2o4 power battery based on strong tracking sigma point kalman filter,
D. Li, J. Ouyang, H. Li, and J. Wan, “State of charge estimation for limn2o4 power battery based on strong tracking sigma point kalman filter,” Journal of power sources , vol. 279, pp. 439–449, 2015
2015
-
[29]
Online estimation of battery equivalent circuit model parameters and state of charge using decoupled least squares technique,
C. Zhang, W. Allafi, Q. Dinh, P. Ascencio, and J. Marco, “Online estimation of battery equivalent circuit model parameters and state of charge using decoupled least squares technique,” Energy, vol. 142, pp. 678–688, 2018
2018
-
[30]
State of charge estimation for lithium-ion battery based on an intelligent adaptive extended kalman filter with improved noise estimator,
D. Sun, X. Yu, C. Wang, C. Zhang, R. Huang, Q. Zhou, T. Amietszajew, and R. Bhagat, “State of charge estimation for lithium-ion battery based on an intelligent adaptive extended kalman filter with improved noise estimator,” Energy, vol. 214, p. 119025, 2021
2021
-
[31]
Online state-of-health estimation of lithium-ion battery based on dynamic parameter identi- fication at multi timescale and support vector regression,
X. Tan, D. Zhan, P. Lyu, J. Rao, and Y . Fan, “Online state-of-health estimation of lithium-ion battery based on dynamic parameter identi- fication at multi timescale and support vector regression,” Journal of Power Sources, vol. 484, p. 229233, 2021
2021
-
[32]
Comparative study of parameter identification with frequency and time domain fitting using a physics-based battery model,
Y . Zhao and A. Jossen, “Comparative study of parameter identification with frequency and time domain fitting using a physics-based battery model,” Batteries, vol. 8, no. 11, p. 222, 2022
2022
-
[33]
Investigation on the impact of the hppc profile on the battery ecm parameters’ offline identification,
Z. Li, X. Shi, M. Shi, C. Wei, F. Di, and H. Sun, “Investigation on the impact of the hppc profile on the battery ecm parameters’ offline identification,” in 2020 Asia Energy and Electrical Engineering Symposium (AEEES), pp. 753–757, IEEE, 2020
2020
-
[34]
State of charge estimation for lithium-ion batteries based on square root sigma point kalman filter considering temperature variations,
D. Mahboubi, I. J. Gavzan, M. H. Saidi, and N. Ahmadi, “State of charge estimation for lithium-ion batteries based on square root sigma point kalman filter considering temperature variations,” IET Electrical Systems in Transportation , vol. 12, no. 3, pp. 165–180, 2022
2022
-
[35]
Bi and S.-Y
Y . Bi and S.-Y . Choe, “An adaptive sigma-point kalman filter with state equality constraints for online state-of-charge estimation of a li (nimnco) o2/carbon battery using a reduced-order electrochemical model,”Applied Energy, vol. 258, p. 113925, 2020
2020
-
[36]
Improved realtime state-of- charge estimation of lifepo4 battery based on a novel thermoelectric model,
C. Zhang, K. Li, J. Deng, and S. Song, “Improved realtime state-of- charge estimation of lifepo4 battery based on a novel thermoelectric model,” IEEE Transactions on Industrial Electronics , vol. 64, no. 1, pp. 654–663, 2016
2016
-
[37]
Parameter identification and state-of- charge estimation approach for enhanced lithium–ion battery equivalent circuit model considering influence of ambient temperatures,
H. Pang, L.-J. Mou, and L. Guo, “Parameter identification and state-of- charge estimation approach for enhanced lithium–ion battery equivalent circuit model considering influence of ambient temperatures,” Chinese Physics B, vol. 28, no. 10, p. 108201, 2019. 10
2019
-
[38]
Hppc test methodol- ogy using lfp battery cell identification tests as an example,
T. Biało ´n, R. Niestr ´oj, W. Skarka, and W. Korski, “Hppc test methodol- ogy using lfp battery cell identification tests as an example,” Energies, vol. 16, no. 17, p. 6239, 2023
2023
-
[39]
Effect of sample interval on the parameter identification results of rc equivalent circuit models of li-ion battery: An investigation based on hppc test data,
H. Zhang, C. Deng, Y . Zong, Q. Zuo, H. Guo, S. Song, and L. Jiang, “Effect of sample interval on the parameter identification results of rc equivalent circuit models of li-ion battery: An investigation based on hppc test data,” Batteries, vol. 9, no. 1, p. 1, 2022
2022
-
[40]
A modified high c-rate battery equivalent circuit model based on current dependence and concentration modification,
X. Zhao, Y . Liu, Z. Yang, R. Wang, L. Liu, L. Wang, and Y . Wang, “A modified high c-rate battery equivalent circuit model based on current dependence and concentration modification,” Electrochimica Acta, vol. 478, p. 143833, 2024
2024
-
[41]
A state-of-charge estimation method of the power lithium-ion battery in complex conditions based on adaptive square root extended kalman filter,
C. Jiang, S. Wang, B. Wu, C. Fernandez, X. Xiong, and J. Coffie-Ken, “A state-of-charge estimation method of the power lithium-ion battery in complex conditions based on adaptive square root extended kalman filter,” Energy, vol. 219, p. 119603, 2021
2021
-
[42]
A study of the influence of measurement timescale on internal resistance characterisation methodologies for lithium-ion cells,
A. Barai, K. Uddin, W. D. Widanage, A. McGordon, and P. Jennings, “A study of the influence of measurement timescale on internal resistance characterisation methodologies for lithium-ion cells,” Scientific reports, vol. 8, no. 1, p. 21, 2018
2018
-
[43]
Maximum pulse current estimation for high accuracy power capability prediction of a li-ion battery,
S. Lee, J. Kim, and B.-H. Cho, “Maximum pulse current estimation for high accuracy power capability prediction of a li-ion battery,” Microelectronics Reliability, vol. 55, no. 3-4, pp. 572–581, 2015
2015
-
[44]
Pngv battery test manual,
B. SHH and G. EE, “Pngv battery test manual,” 1999
1999
-
[45]
Real-time state of power estimation of a lithium-ion battery using robust ocv and internal resistance estimates,
R. S. P. K. Pillai, Prarthana and B. Balasingam, “Real-time state of power estimation of a lithium-ion battery using robust ocv and internal resistance estimates,” IEEE Transactions on Energy Conversion (under review), 2024
2024
-
[46]
Battery test manual for electric vehicles,
J. P. Christophersen, “Battery test manual for electric vehicles,” Idaho National Laboratory, 2015
2015
-
[47]
Novel fitting algorithm for parametrization of equivalent circuit model of li-ion battery from broadband impedance measurements,
J. Sihvo, T. Roinila, and D.-I. Stroe, “Novel fitting algorithm for parametrization of equivalent circuit model of li-ion battery from broadband impedance measurements,” IEEE Transactions on Industrial Electronics, vol. 68, no. 6, pp. 4916–4926, 2020
2020
-
[48]
An ev-scale demonstration of in-situ battery electro- chemical impedance spectroscopy and bms-limited pack performance analysis,
Z. Gong, A. Kachura, S. A. Assadi, N. Cusimano, J. Piruzza, J. Xu, and O. Trescases, “An ev-scale demonstration of in-situ battery electro- chemical impedance spectroscopy and bms-limited pack performance analysis,” IEEE Transactions on Industrial Electronics , vol. 70, no. 9,...
2022
-
[49]
Circuit parameters extrac- tion algorithm for a lithium-ion battery charging system incorporated with electrochemical impedance spectroscopy,
S. R. Islam, S.-Y . Park, and B. Balasingam, “Circuit parameters extrac- tion algorithm for a lithium-ion battery charging system incorporated with electrochemical impedance spectroscopy,” in 2018 IEEE Applied Power Electronics Conference and Exposition (APEC) , pp. 3353–3358,...
2018
-
[50]
Ahmed, M
R. Ahmed, M. El Sayed, I. Arasaratnam, J. Tjong, and S. Habibi, “Reduced-order electrochemical model parameters identification and soc estimation for healthy and aged li-ion batteries part i: Parameterization model development for healthy batteries,” IEEE journal of emerging a...
2014
-
[51]
Optimizing current profiles for efficient online estimation of battery equivalent circuit model parameters based on cramer–rao lower bound,
P. Pillai, S. Sundaresan, K. R. Pattipati, and B. Balasingam, “Optimizing current profiles for efficient online estimation of battery equivalent circuit model parameters based on cramer–rao lower bound,” Energies, vol. 15, no. 22, p. 8441, 2022
2022
-
[53]
Open circuit voltage characterization of lithium-ion batteries,
B. Pattipati, B. Balasingam, G. Avvari, K. Pattipati, and Y . Bar-Shalom, “Open circuit voltage characterization of lithium-ion batteries,” Journal of Power Sources, vol. 269, pp. 317–333, 2014
2014
-
[54]
Battery test equipment
Arbin Instruments, “Battery test equipment.” https://www.arbin.com/ battery-test-equipment, 2024. Accessed: 2025-03-05
2024
-
[55]
Inr21700-p42a v4 datasheet
Molicel, “Inr21700-p42a v4 datasheet.” https://www.molicel.com/ wp-content/uploads/INR21700P42A-V4-80092.pdf, 2024. Accessed: 2025-03-05
2024
-
[2025]
Accessed: 2025-03-05
2025
Reviewed August 15, 2026 · model on record in the stance chip above.
Discussion (0). Continue with ORCID to comment.