REVIEW 4 major objections 4 minor 27 references
Study of Stability and Consistency of EAS Thermal Neutron Detection at ENDA-64
T0 review · 4 major / 4 minor · reviewed 2026-08-07 · deepseek-v4-flash
Pith's one-line read ENDA-64, a 64-detector array for air-shower neutrons, is consistent to 6.85% and stable enough for cosmic-ray studies around the knee.
desk verdict First quantitative stability/consistency numbers for ENDA-64; rate-stability results are solid, but the consistency and sand-cube conclusions rest on an unvalidated background sample and a confounded comparison. read the letter →
The pith
A machine-rendered reading of the paper's core claim, the machinery that carries it, and where it could break.
The reading
What carries the argument
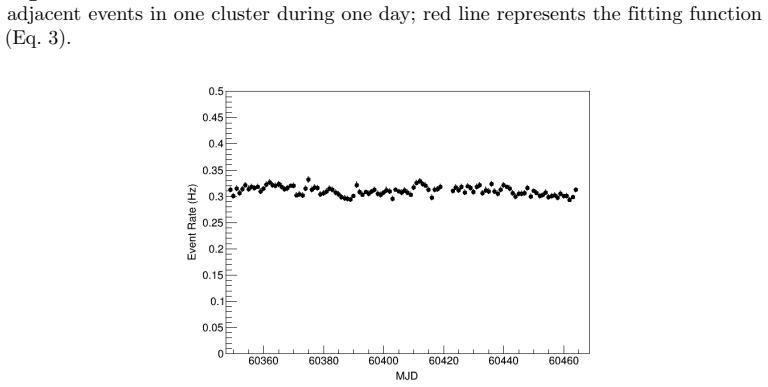
The central calibration object is the steepness parameter $b$ of the pulse-height distribution, fit by $y=10^{a-bx}$; because $b$ reflects the energy deposited by one captured thermal neutron, equalizing it across detectors by adjusting high voltage is the paper's definition of consistency. Signal/background separation uses the ratio of the triggered-event neutron distribution to the rate-normalized M0 background distribution, with $\lg n > 1.2$ taken as the regime where real EAS events dominate. Stability is measured by fitting an exponential to the time-difference distribution between adjacent events, giving the event rate, and by tracking the thermal neutron rate. The sand-cube effect is assessed by comparing cluster No. 4's distributions across dry and rainy seasons and with and without sand cubes.
What would settle it
Recompute the triggered-to-background ratio using an independent background sample, such as randomly triggered 20 ms gates from non-coincident detector signals, and check whether $\lg n > 1.2$ still marks the EAS-dominated region. If the independent background gives a different threshold, or if the 18% cluster inconsistency changes substantially when the background is subtracted event-by-event, the paper's stability and consistency conclusions would need revision.
Extended reading notes
Core claim
The central claim is that ENDA-64, after adjusting photomultiplier high voltages, detects single thermal neutrons uniformly enough for physics use: the spread of the pulse-height steepness parameter $b$ within each cluster is at most 6.85% of its mean. Over February–June 2024 the event rate in a cluster is stable to 4.68% and the thermal neutron rate to 11.0%. Comparing the three clusters without sand cubes over August–December 2024, the thermal-neutron distributions agree to within 18% once low-statistics high-count bins are set aside. For cluster No. 4, the data show that sand cubes keep the neutron response stable through the rainy season and that, at neutron counts $\lg n > 1.2$, the sand-cube cluster collects more shower-produced thermal neutrons than the others, which the authors attribute to the 1 m elevation and the increased geometrical factor of the sand target.
Load-bearing premise
The load-bearing assumption is that the minute-long M0 background events, after being rescaled by event rate, represent the background that is actually mixed into the triggered events; if that scaling is wrong, the signal/background separation and the cluster comparisons built on it are biased.
Editorial extensions
If this is right
- If these stability and consistency numbers hold, ENDA-64 can provide a hadronic, neutron-based channel alongside electromagnetic and muon measurements for cosmic-ray studies around the knee.
- The quoted instabilities set systematic-error floors for the future energy spectrum and composition analysis; improving high-voltage calibration should reduce the 18% cluster inconsistency.
- The sand-cube result implies that the array can lower its energy threshold for light-component (proton/helium) knee measurements, because the cubes raise neutron collection at higher neutron counts.
- The measured inconsistency bounds justify the planned expansion to a larger array, since the per-cluster performance transfers to the larger detector count.
- The seasonal and moisture sensitivity quantified here will need to be corrected or monitored continuously in the final physics analysis.
Reading between the lines
- The paper leaves implicit that its 11.0% thermal-neutron-rate instability likely includes soil-moisture variation; an explicit correlation of the daily neutron rate with local rainfall or soil moisture would test whether sand cubes suppress this seasonal component.
- The M0-ratio method for isolating real EAS events could be validated independently by comparing it with a Monte Carlo simulation of the shower neutron signal, which the authors say is planned; if the $\lg n > 1.2$ threshold shifts under simulation, the reported cluster inconsistencies would need revisiting.
- Because only cluster No. 4 had sand cubes, the with/without-cube comparison conflates the sand-cube effect with any cluster-to-cluster calibration or environmental difference; a swap experiment—moving sand cubes to a different cluster—would isolate the effect.
- The 18% inconsistency among the three no-cube clusters is stated after excluding high-count bins; if the full distribution is used, the quoted inconsistency could be larger, so future analyses should state the bin range over which the 18% applies.
Editorial analysis
A structured set of objections, weighed in public.
Referee Report
Summary. The paper reports an instrument-performance study of the ENDA-64 thermal-neutron detector array at LHAASO. The authors calibrate each detector by adjusting PMT high voltages so that the pulse-height distribution for single thermal neutrons is consistent across detectors, and they quantify the residual inconsistency per cluster as the ratio of the standard deviation to the mean of the fitted steepness parameter (maximum 6.85%). They then use time-difference distributions to derive event rates and thermal-neutron rates per cluster, quoting maximum instabilities of 4.68% and 11.0% based on the relative standard deviations of the daily rates. For consistency, they compare thermal-neutron multiplicity distributions among clusters without sand cubes, reporting a maximum difference of 18% after excluding high-multiplicity bins with low statistics. Finally, they compare cluster 4 (with sand cubes) to other clusters and to its own history in dry and rainy seasons, concluding that sand cubes protect the target material from rainwater and enhance collection of neutrons from extensive air showers.
Significance. The stability and calibration numbers (6.85%, 4.68%, 11.0%) are direct, data-driven measurements that are useful for the ENDA-64 collaboration and for any future cosmic-ray physics analysis using this array. The paper makes specific, falsifiable claims that can be checked against the published figures and tables, and the rate-stability analysis is straightforward and reproducible. The main value is the quantitative characterization of detector performance, which is a necessary prerequisite for the planned measurement of the cosmic-ray spectrum around the knee. However, the consistency and sand-cube conclusions are currently supported by comparisons that lack statistical uncertainties and controlled baselines, so the quantitative significance of those specific claims is not yet established.
major comments (4)
- [Section 3.2, Fig. 4] The definition of the real-EAS-dominated region (lg(n)>1.2) relies on normalizing M0 background events to triggered events using event rates. M0 events are 20 ms windows triggered by software once per minute, whereas triggered events are 20 ms gates opened by an EAS charged-particle trigger. These two types of windows can have different dead-time, afterpulse, and acceptance conditions, and it is not demonstrated that the M0 distribution faithfully represents the background inside triggered events. Because this threshold is used in Section 3.4 to interpret the sand-cube ratios, this unvalidated background treatment is load-bearing for the sand-cube conclusions.
- [Section 3.3, Fig. 7] The maximum inconsistency of 18% between the three clusters without sand cubes is stated after 'disregarding the higher neutron counts, which have low statistics and consequently large statistical errors,' but no quantitative definition of that cut is given, and the ratio panel in Fig. 7 has no error bars. Without a stated multiplicity range and statistical uncertainties, the 18% value cannot be reproduced or distinguished from a statistical fluctuation. Please specify the fitted lg(n) range, the binning, and the statistical uncertainty on the maximum deviation.
- [Section 3.4, Fig. 8] The rain-protection claim for sand cubes is based on a confounded comparison. The 'rainy season without sand cubes' period (Aug 16-Oct 14, 2023) is compared against a 'dry season with sand cubes' baseline (Feb 9-Jun 3, 2024), so differences between these two curves can be due to seasonal or inter-annual variations in soil moisture, temperature, or other environmental factors, rather than to the presence of the sand cubes alone. A controlled comparison would require the same cluster with and without sand cubes in the same season, or a quantitative measurement of soil moisture and rain during the two periods.
- [Section 3.4, Fig. 9] The comparison between cluster 4 (with sand cubes) and the average of the other three clusters (without sand cubes) shows a ratio that rises above 1 for lg(n)>1.2, but the text attributes this rise to the cluster being 1 m above the ground, not to the sand cubes themselves. This attribution contradicts the abstract and conclusion statement that 'the sand cubes help the cluster to increase collection of neutrons generated by EAS events.' Since the sand mass, the detector elevation, and the observation period are all different between the compared samples, the EAS-neutron enhancement cannot be uniquely assigned to the sand cubes without a simulation or a dedicated test.
minor comments (4)
- [Section 3.2] The text states that for lg(n)>1 the ratio R is greater than 1.2, but later uses lg(n)>1.2 as the real-EAS threshold; please make the threshold consistent and specify how it is chosen.
- [General figures] The ratio panels in Figs. 4, 7, 8, and 9 do not show statistical error bars. Adding error bars would allow the reader to assess whether features such as the 18% inconsistency and the sand-cube excess are significant.
- [Tables 1-3] The captions do not define M, S, and R; please state explicitly that M is the mean, S the standard deviation, and R the ratio S/M expressed as a percentage.
- [Section 3.4] The three periods in Fig. 8 are from different years (2023 and 2024), but this is only stated in the figure caption; the text should note the non-overlapping observation windows and the potential for long-term drift or seasonal effects.
Circularity Check
No circularity: all reported quantities are direct data summaries or post-calibration residuals; no derivation reduces to its own inputs.
full rationale
This is an experimental characterization paper, not a derivation paper. The stability and consistency numbers are direct statistical summaries (mean M, standard deviation S, and ratio R = S/M) of measured quantities: the fitted steepness parameter b of pulse-height distributions, the event rate lambda fitted from time-difference distributions, and the thermal neutron rate. None of these results is used as an input to define itself: the 6.85% calibration inconsistency is the residual spread of b after high-voltage adjustment, not a parameter fitted to produce that spread; the 4.68% and 11.0% instabilities are spreads of measured rates over time; and the 18% cross-cluster inconsistency is a direct comparison of measured neutron-count distributions. The lg(n) > 1.2 region is empirically identified from triggered-to-M0 background ratios and then used consistently when interpreting sand-cube effects, but this is an operational selection, not a self-definitional reduction. Self-citations ([11, 23, 26]) are used only for trigger description and prior sand-cube installation background; they are not load-bearing uniqueness arguments and do not force any result. The acknowledged confounds in the sand-cube comparison (elevation, season, observation period) are correctness risks, not circularity. Therefore the central claims are self-contained measurements with no circular derivation.
Assumptions & free parameters
assumptions (4)
- domain assumption The middle part of the pulse height distribution fitted by Eq. 2 corresponds to single thermal neutron captures in 10B.
- domain assumption Event times follow an exponential distribution, so event rate can be extracted from the fit to Eq. 3.
- domain assumption M0 background events, normalized by event rate, represent the background contribution within triggered events.
- domain assumption The threshold lg(n)>1.2 separates real EAS events from background.
Cite this review
Pith. "Pith review of Study of Stability and Consistency of EAS Thermal Neutron Detection at ENDA-64." pith.science (2026). https://pith.science/paper/EUSDNGHJ
@misc{pith2026250610510,
  author       = {Pith},
  title        = {Pith review of: Study of Stability and Consistency of EAS Thermal Neutron Detection at ENDA-64},
  year         = {2026},
  howpublished = {\url{https://pith.science/paper/EUSDNGHJ}},
  note         = {Machine review of arXiv:2506.10510}
}
read the original abstract
Introduction:Electron-Neutron Detector Array (ENDA) is designed to measure thermal neutrons produced by hadronic interactions between cosmic ray extensive air showers (EAS) and the surrounding environment as well as electrons around the cores of EAS. ENDA is located within Large High Altitude Air Shower Observatory (LHAASO). ENDA was expanded from an initial 16 detectors to 64 detectors in April 2023, so called ENDA-64, and has been running alongside LHAASO. The stability and consistency of neutron detection are crucial for laying a solid foundation for subsequent data analysis and physical results. Methods:We obtain the stability by studying variations of event rate and thermal neutron rate in each cluster and the consistency by comparing distribution of number of thermal neutrons between clusters. Additionally, we investigate the specific influences of the rainy and dry seasons, as well as the presence or absence of sand cubes under the detectors, to examine the environmental factors affecting neutron measurement performance. Results:The calibration results indicate good consistency in thermal neutron detection across the clusters, with the maximum inconsistency of 6.85%. The maximum instability of event rate and thermal neutron rate over time are 4.68% and 11.0% respectively. The maximum inconsistency between the clusters without the sand cubes is 18%. The use of sand cubes is effective in protecting the target material from rainwater, and the sand cubes help the cluster to increase collection of neutrons generated by EAS events.
Figures


Figures from the paper (6 more)




Reference graph
Works this paper leans on
-
[1]
T. Antoni and et al. Kascade measurements of energy spectra for elemental groups of cosmic rays: Results and open problems.Astroparticle Physics, 24(1):1–25, 2005
work page 2005
-
[2]
M. Amenomori and et al. Are protons still dominant at the knee of the cosmic-ray energy spectrum.Physics Letters B, 632(1):58–64, 2006
work page 2006
-
[3]
B. Bartoli and et al. Knee of the cosmic hydrogen and helium spectrum below 1 pev measured by argo-ybj and a cherenkov telescope of lhaaso.Phys. Rev. D, 92:092005, Nov 2015
work page 2015
-
[4]
Zhen Cao and et al. Measurements of all-particle energy spectrum and mean logarithmic mass of cosmic rays from 0.3 to 30 pev with lhaaso-km2a.Phys. Rev. Lett., 132:131002, Mar 2024
work page 2024
-
[5]
J¨ org R. H¨ orandel. Models of the knee in the energy spectrum of cosmic rays. Astroparticle Physics, 21(3):241–265, 2004
work page 2004
-
[6]
Cosmic ray energy spectrum from measurements of air showers.Frontiers of Physics, 8, 04 2013
Thomas Gaisser and et al. Cosmic ray energy spectrum from measurements of air showers.Frontiers of Physics, 8, 04 2013
work page 2013
-
[7]
S. I. Nikolsky. The Cause of the EAS Spectrum Break. InInternational Cosmic Ray Conference, volume 6 ofInternational Cosmic Ray Conference, page 105, January 1997
work page 1997
-
[8]
Yuri Stenkin. On special features of the longitudinal development of extensive air showers and on the spectrum of cosmic rays.Physics of Atomic Nuclei, 71:98–110, 01 2011
work page 2011
Show all 27 references
-
[9]
Chapter 1 lhaaso instruments and detector technology *
Xin-Hua Ma and et al. Chapter 1 lhaaso instruments and detector technology *. Chinese Physics C, 46(3):030001, mar 2022
2022
-
[10]
Electron–neutron detector array (enda).Physics of Atomic Nuclei, 84:941–946, 11 2021
Bing-Bing Li and et al. Electron–neutron detector array (enda).Physics of Atomic Nuclei, 84:941–946, 11 2021
2021
-
[11]
Progress of electron–neutron detector array (enda)
Da-Yu Peng and et al. Progress of electron–neutron detector array (enda). Physics of Atomic Nuclei, 86:1056–1062, 2023
2023
-
[12]
Research on the knee region of cosmic ray by using a novel type of electron–neutron detector array.Frontiers of Physics, 19:44200, 2024
Bing-Bing Li and et al. Research on the knee region of cosmic ray by using a novel type of electron–neutron detector array.Frontiers of Physics, 19:44200, 2024
2024
-
[13]
Stenkin and et al
Yuri V. Stenkin and et al. On the Neutron Bursts Origin.Modern Physics Letters A, 17(26):1745–1751, jan 2002. 12/13
2002
-
[14]
Yuri V. Stenkin. On the prisma project.Nuclear Physics B - Proceedings Supplements, 196:293–296, 2009
2009
-
[15]
Thermal neutron flux produced by eas at various altitudes
Yuri Tenkin and et al. Thermal neutron flux produced by eas at various altitudes. Chinese Physics C, 37(1):015001, jan 2013
2013
-
[16]
Yu. V. Stenkin and et al. Neutrons in extensive air showers.Physics of Atomic Nuclei, 70:1088–1099, 06 2007
2007
-
[17]
Yu.V. Stenkin. Thermal neutrons in eas: a new dimension in eas study.Nuclear Physics B - Proceedings Supplements, 175-176:326–329, 2008
2008
-
[18]
D. D. Djappuev and et al. Compact multicomponent array for EAS study (MULTICOM). InInternational Cosmic Ray Conference, page 822, 2001
2001
-
[19]
Gromushkin and et al
D. Gromushkin and et al. The protoprisma array for eas study: first results. Journal of Physics Conference Series, 409:2044–, 02 2013
2013
-
[20]
Bartoli and et al
B. Bartoli and et al. Detection of thermal neutrons with the prisma-ybj array in extensive air showers selected by the argo-ybj experiment.Astroparticle Physics, 81:49–60, 2016
2016
-
[21]
Seasonal and lunar month periods observed in natural neutron flux at high altitude.Pure and Applied Geophysics, 174:2763–2771, 07 2017
Yuri Stenkin and et al. Seasonal and lunar month periods observed in natural neutron flux at high altitude.Pure and Applied Geophysics, 174:2763–2771, 07 2017
2017
-
[22]
Response of the environmental thermal neutron flux to earthquakes.Journal of Environmental Radioactivity, 208-209:105981, 2019
Yuri Stenkin and et al. Response of the environmental thermal neutron flux to earthquakes.Journal of Environmental Radioactivity, 208-209:105981, 2019
2019
-
[23]
Li and et al
B.-B. Li and et al. Eas thermal neutron detection with the prisma-lhaaso-16 experiment.Journal of Instrumentation, 12(12):P12028, dec 2017
2017
-
[24]
Performance of the thermal neutron detector array in yangbajing, tibet for cosmic ray eas detection.Astrophysics and Space Science, 365:123, 07 2020
Mao-Yuan Liu and et al. Performance of the thermal neutron detector array in yangbajing, tibet for cosmic ray eas detection.Astrophysics and Space Science, 365:123, 07 2020
2020
-
[25]
Yang and et al
F. Yang and et al. Correlation between thermal neutrons and soil moisture measured by enda.Journal of Instrumentation, 18(05):P05020, may 2023
2023
-
[26]
Influence of soil environment on performance of eas electron–neutron detector array.Astrophysics and Space Science, 367:75, 08 2022
Di-Xuan Xiao and et al. Influence of soil environment on performance of eas electron–neutron detector array.Astrophysics and Space Science, 367:75, 08 2022
2022
-
[27]
Readout electronics for thermal neutron detector array
Chunhui Dong and et al. Readout electronics for thermal neutron detector array. Nuclear Instruments and Methods in Physics Research Section A: Accelerators, Spectrometers, Detectors and Associated Equipment, 946:162639, 2019. 13/13
2019
Reviewed August 7, 2026 · model on record in the stance chip above.
Discussion (0). Sign in to comment.