REVIEW 4 major objections 5 minor 58 references
Predicting air flow in calendered paper sheets from $\mu$-CT data: combining physics with morphology
T0 review · 4 major / 5 minor · reviewed 2026-08-07 · deepseek-v4-flash
Pith's one-line read Combining cheap pore-network flow simulations with a few geometric pore-space descriptors yields substantially better predictions of air flux through paper, with different descriptors decisive for uncompressed and calendered sheets.
desk verdict A careful, transparent in-sample demonstration that geometric descriptors can correct PNM flux predictions, but the 'predictive power' claim is overreaching without any out-of-sample validation. read the letter →
The pith
A machine-rendered reading of the paper's core claim, the machinery that carries it, and where it could break.
The reading
What carries the argument
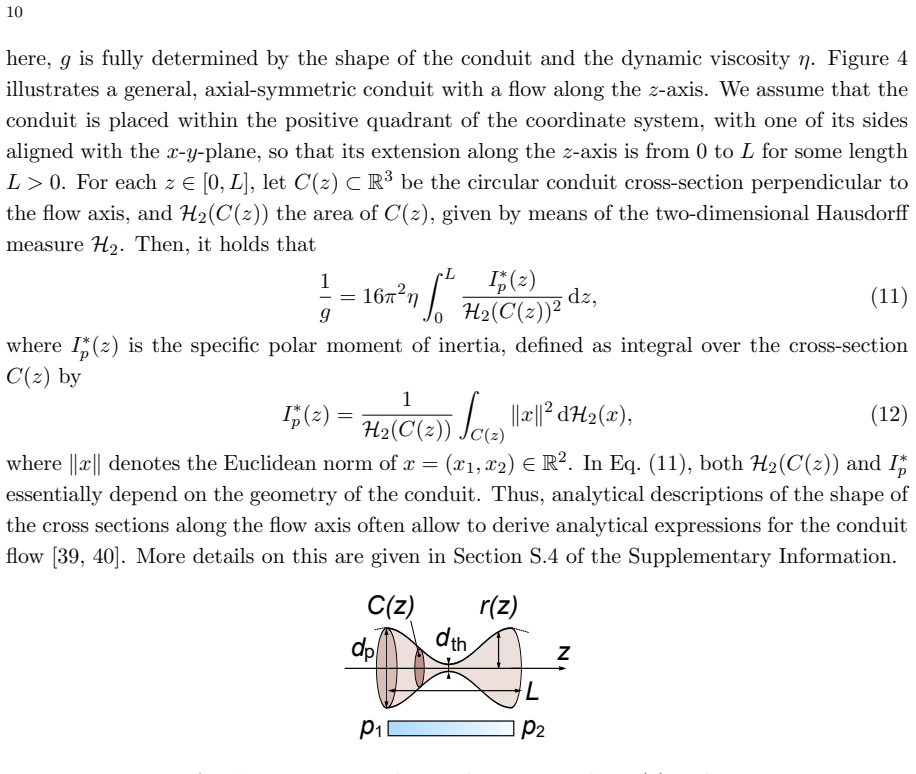
The central machinery is a family of six power-law regression models of the form $v = c_0 x_1^{c_1} \cdots x_n^{c_n}$, made linear by taking logarithms and fitted by least squares to CFD fluxes. The fitted exponents on porosity $\varepsilon$, specific surface area $S$, mean and standard deviation of geodesic tortuosity $\mu(\tau)$ and $\sigma(\tau)$, median pore radius $r_{\max}$, and the PNM flux $v_{\mathrm{PNM}}$ are the quantitative measure of how much each quantity corrects the pore-network prediction. The PNM flux itself comes from a graph representation of the pore space whose local conductances are computed with an analytical conduit formula, so the regressions inherit the physics of the network model and add morphology on top.
What would settle it
Fit the same six regressions to experimentally measured Gurley fluxes instead of CFD fluxes, on cutouts aligned with the measured sheet positions. Because the prefactor $c_0$ can absorb the four-to-fivefold scale offset, the central claim predicts that the descriptor rankings should survive; if geodesic tortuosity stops helping for uncompressed paper or specific surface area stops helping for compressed paper, the CFD-as-ground-truth premise is the weak link. Repeating the CFD on a finer mesh with compressible flow would test whether the four-to-fivefold offset and the excluded cutout's implausible porosity disappear.
Extended reading notes
Core claim
On the paper's own terms, the claim is that pore-network (PNM) flux predictions can be corrected into close agreement with CFD reference fluxes by multiplying them by power-law factors in geometric descriptors of the pore space. For descriptor-only regressions, the uncompressed sample improves from $R^2=0.62$ with porosity alone to $R^2=0.71$ when tortuosity statistics are added; the compressed sample improves from $R^2=0.87$ with porosity alone to $R^2=0.98$ when specific surface area is added. When PNM flux is the base predictor, porosity as an extra factor raises the compressed-sample fit from $R^2=0.39$ to $R^2=0.89$. The paper further demonstrates that median pore radius remains useful even though it is strongly correlated with porosity, and that jointly fitted models lose the sample-specific gains, indicating that the corrections encode real microstructural differences rather than generic trends.
Load-bearing premise
The load-bearing premise is that CFD-simulated fluxes are the correct target, even though they run four to five times below the measured Gurley fluxes and one cutout was excluded because its simulated porosity looked like a mesh artifact.
Editorial extensions
If this is right
- Corrected PNM fluxes give a computationally cheap way to map local air-permeance variations across many cutouts of a paper sheet, which full CFD cannot cover at the same cost.
- The optimal correction descriptor is grade-specific, so a single universal porosity-permeability curve should not be assumed across different paper grades.
- The compressed sample's poor PNM-only fit ($R^2=0.39$) and its rescue by porosity identify pore-throat and surface-area features that the simplified conduit model misses.
- Strong correlation with porosity does not make a descriptor redundant, so feature screening by correlation alone can discard useful morphology information.
Reading between the lines
- Because the fitted prefactor absorbs the four-to-fivefold CFD/experiment gap, the descriptor exponents are likely more transferable to real paper than the absolute predicted fluxes; refitting the same models to Gurley permeances would test this directly.
- The same recipe—one fast network simulation plus a handful of image-based descriptors—could serve as a manufacturing proxy for local permeance, replacing case-by-case CFD on paper, filters, and gas-diffusion layers.
- If compression shifts the decisive descriptor from tortuosity to surface area in paper, analogous processing-induced anisotropy in other fibrous sheets should be detectable by the same regression diagnostic before any tomographic segmentation is optimized.
Signed reviews
Editorial analysis
A structured set of objections, weighed in public.
Referee Report
Summary. The paper addresses prediction of laminar air flow through thin paper sheets from μ-CT images, using two samples (uncompressed and calendered paper). The authors compute volume fluxes per cutout with CFD, approximate them with a pore network model (PNM), and then fit six power-law regression models that combine PNM fluxes with geometric descriptors (porosity, specific surface area, geodesic tortuosity mean/standard deviation, and median pore radius). Models are fitted separately for each sample and jointly for both samples, and are evaluated by in-sample R² and MAPE on log-transformed fluxes. The main findings are that adding geometric descriptors improves agreement with CFD relative to PNM alone or porosity alone, that the most useful descriptor differs between samples (geodesic tortuosity for uncompressed paper, specific surface area for compressed paper), and that a high correlation between two descriptors does not imply that one is redundant. The manuscript explicitly acknowledges the empirical nature of the regressions and the use of the same data for fitting and evaluation.
Significance. If the reported structure-property relationships survive out-of-sample testing, the work would be a practically relevant step toward inexpensive prediction of paper air permeance from tomographic data. The paper is transparent about the empirical status of the fitted laws, publishes all fitted coefficients in the supplementary tables, and carefully checks the sensitivity of PNM predictions to the conduit shape. The claim that descriptor correlation does not imply redundancy is interesting and falsifiable. However, the central evidence currently consists of in-sample fits to 11–12 cutouts with up to six parameters, so the significance of the descriptor-ranking conclusions depends on the cross-validation requested below.
major comments (4)
- [Section 5.2, Eq. (27); Section 6.1; Tables S1–S3] The central claim that combining PNM fluxes with geometric descriptors 'significantly improves the predictive power' rests entirely on in-sample R² and MAPE. The paper explicitly states in §5.2 that the same data are used to fit and evaluate, and with 12 cutouts for uncompressed paper and 11 for compressed paper, models such as v(5) and v(6) contain up to six coefficients, so in-sample improvement is expected even if additional predictors are pure noise. In particular, the sample-specific conclusions about tortuosity versus surface area in §6.1 are based on R² differences of 0.70 vs. 0.71 and 0.97 vs. 0.98, which are well within the noise of fitting several competing models to roughly 11 points. I request leave-one-out cross-validation (or an equivalent out-of-sample protocol) for all models, with cross-validated R² and MAPE, and standard errors or confidence intervals for the fitted exponents. Without this, 'predictive power' is not established and the descriptor-relevance ranking may not transfer to new cutouts.
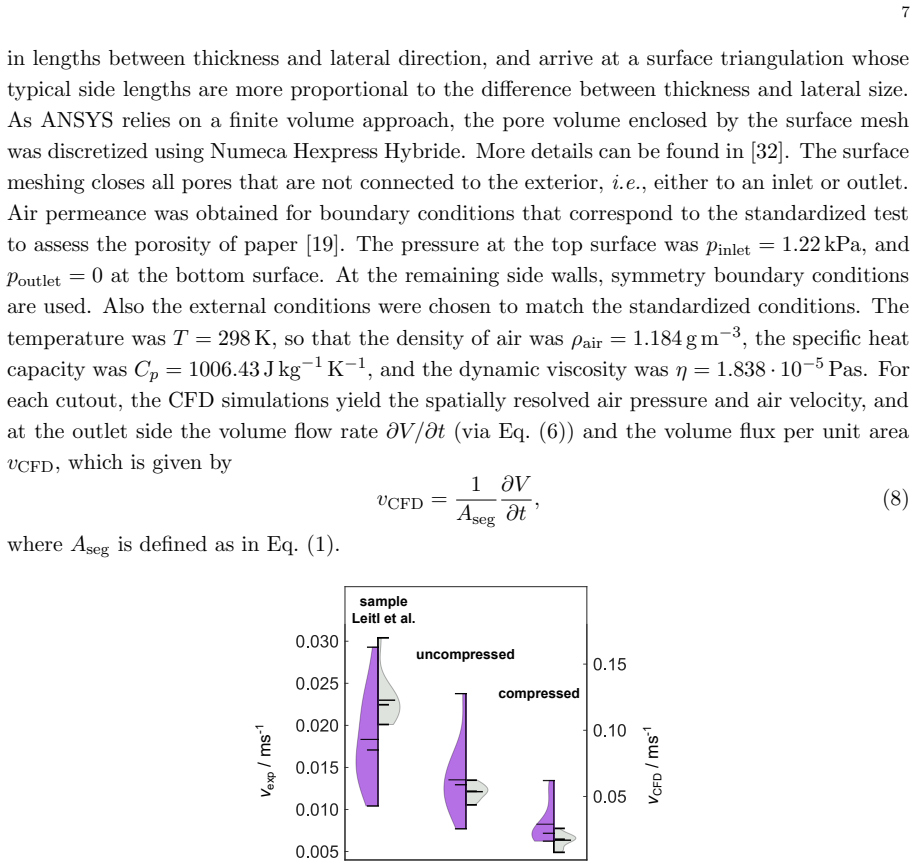
- [Section 3.1, Figure 2; Section 2.1] The paper treats CFD-computed fluxes as ground truth for air flow even though v_CFD and experimental Gurley fluxes differ by a factor of four to five. The regression prefactors can absorb a constant multiplicative offset, but the manuscript does not demonstrate that the offset is constant across the morphological range; if the CFD/experiment discrepancy depends on porosity or connectivity, the fitted descriptor exponents target a biased quantity. I ask the authors to quantify the CFD-versus-experiment relationship beyond medians and quartiles, for example with a pointwise scatter plot or a ratio-versus-porosity plot, or to explicitly restrict all claims to 'CFD flux' rather than measured air permeance. The exclusion of one compressed cutout for an 'implausibly large' CFD porosity (§2.1) is a related robustness concern, because a mesh artifact in one cutout raises the possibility of systematic mesh-induced bias in the remaining cutouts.
- [Section 2.1; Section 4.2] The targeted cutout design (eight cutouts near the mean porosity, two dense, two open) means the reported R² values are not estimates for a random sample of the paper sheet. The authors acknowledge in §4.2 that this design boosts the importance of other descriptors in explaining flow variation, but the in-sample model comparisons are still affected: the apparent success of a descriptor can depend on this stratified design. Please report results under a design-aware analysis, for example weighted R² or leave-one-group-out cross-validation where the three porosity strata are the groups, and state more cautiously that the descriptor ranking is specific to this stratified set.
- [Section 6.3, Figure 10] The generalization analysis in §6.3 fits a single model on the combined data and evaluates on the same two samples; this is still in-sample evaluation and cannot be read as evidence that the relationships generalize to other paper grades. The conclusion that 'the decrease in MAPE between v(1) and v(4) is consistent between both samples' should be rephrased as a statement about the fitted data, not about predictive generalization, unless an out-of-sample protocol is added.
minor comments (5)
- [Equation (27)] There appears to be a parenthesis error in the MAPE expression; it should read |log(v_CFD,k) - log(v_k)| / |log(v_CFD,k)| (or the percentage version).
- [Figure 5 and Section 3.2.3] The caption for Figure 5 assigns blue diamonds to the compressed sample and orange circles to the uncompressed sample, while the text in §3.2.3 assigns the colors the other way; please make these consistent.
- [Section 2.1] The word 'particurlarly' should be 'particularly'.
- [Section 6.1] The phrase 'mean absolute percentage MAPE' should be 'mean absolute percentage error MAPE'.
- [General notation] After Eq. (26), the notation for the predicted value log(v) is used without distinguishing it from the same symbol in Eq. (25); a hat or subscript would improve readability.
Circularity Check
Central 'predictive power' claim rests on in-sample R^2; added descriptors improve the fit by construction, so the descriptor-relevance conclusions are not out-of-sample predictions.
-
fitted input called prediction
[Section 5.2 (fitting/validation) and Eq. (27); abstract]
"However, due to the limited amount of available data, we always use the same data to fit the coefficients log(c0), c1, . . . , cn in Eq. (26) as we do to evaluate the statistics R^2 and MAPE defined in Eq. (27)."
Abstract claims combining PNM fluxes with geometric descriptors 'significantly improves the predictive power of the pore network model', but this is evaluated by R^2/MAPE on the same 12/11 cutouts used for the least-squares fit of Eq. (26). Because R^2 is computed from that same fitted regression, adding a nested descriptor cannot decrease R^2; the reported jumps (v(3)->v(4): 0.39->0.89; v(1)->v(2): 0.87->0.98) are therefore guaranteed by the fitting procedure. The 'prediction' is the fitted value, not an independent forecast, and the sample-specific descriptor ranking (tortuosity vs surface area) rests on in-sample fit differences of 0.01 (0.70 vs 0.71; 0.97 vs 0.98).
full rationale
The only step I can exhibit as circular is the in-sample 'validation' protocol. The paper itself states that the same data are used to fit and to evaluate R^2/MAPE, and the reported improvements are properties of least-squares fitting of nested power-law regressions, not evidence of predictive power. This directly affects the central claim, so the score is 6 rather than lower. The correlation between CFD and experimental fluxes (factor 4-5) and the exclusion of one cutout are correctness/robustness concerns, not circularity. The self-citations to [11] and [16] provide context and descriptor definitions but are not load-bearing for the regression; the descriptors and PNM/CFD fluxes are computed in this paper. I do not see a self-definitional identity, imported uniqueness theorem, or renamed known result. The paper would need a leave-one-out or held-out evaluation before the descriptor-relevance conclusions can be called predictive.
Assumptions & free parameters
free parameters (4)
- Regression coefficients c_0...c_n for models v^(1)-v^(6) =
e.g., uncompressed v^(5): log c0=8.3394, c_eps=-2.8884, c_rmax=0.22851, c_vPNM=2.5101 (Table S1)
- SNOW pore-extraction parameters R and sigma =
R=3, sigma=0.35
- Tortuosity minimum pore radius =
1.5 micrometers
- Cutout sampling design =
8 near mean porosity + 2 dense + 2 open per sample
assumptions (5)
- domain assumption Steady incompressible Stokes flow with no-slip conditions applies in the pore space under the Gurley pressure difference
- ad hoc to paper The pore space can be represented as a graph of pores and throats with cone-cylinder-cone conduits
- ad hoc to paper The power-law regression form v = c0 * x1^c1 ... xn^cn is adequate
- ad hoc to paper CFD simulations are the ground truth for flow despite factor 4-5 offset from experiment
- ad hoc to paper In-sample R^2 and MAPE are valid measures of predictive power
Cite this review
Pith. "Pith review of Predicting air flow in calendered paper sheets from $\mu$-CT data: combining physics with morphology." pith.science (2026). https://pith.science/paper/K6J44F4R
@misc{pith2026250610606,
  author       = {Pith},
  title        = {Pith review of: Predicting air flow in calendered paper sheets from $\mu$-CT data: combining physics with morphology},
  year         = {2026},
  howpublished = {\url{https://pith.science/paper/K6J44F4R}},
  note         = {Machine review of arXiv:2506.10606}
}
read the original abstract
Predicting the macroscopic properties of thin fiber-based porous materials from their microscopic morphology remains challenging because of the structural heterogeneity of these materials. In this study, computational fluid dynamics simulations were performed to compute volume air flow based on tomographic image data of uncompressed and compressed paper sheets. To reduce computational demands, a pore network model was employed, allowing volume air flow to be approximated with less computational effort. To improve prediction accuracy, geometric descriptors of the pore space, such as porosity, surface area, median pore radius, and geodesic tortuosity, were combined with predictions of the pore network model. This integrated approach significantly improves the predictive power of the pore network model and indicates which aspects of the pore space morphology are not accurately represented within the pore network model. In particular, we illustrate that a high correlation among descriptors does not necessarily imply redundancy in a combined prediction.
Figures


Figures from the paper (7 more)


Reference graph
Works this paper leans on
-
[1]
Torquato.Random Heterogeneous Materials: Microstructure and Macroscopic Proper- ties
S. Torquato.Random Heterogeneous Materials: Microstructure and Macroscopic Proper- ties. Springer, 2002
work page 2002
-
[2]
L. G. Leal.Advanced Transport Phenomena: Fluid Mechanics and Convective Transport Processes. Cambridge University Press, 2007
2007
-
[3]
T. J. Chung.Computational Fluid Dynamics. Cambridge University Press, 2002
work page 2002
- [4]
-
[5]
X. Yang, Y. Mehmani, W. A. Perkins, A. Pasquali, M. Sch¨ onherr, K. Kim, M. Perego, M. L. Parks, N. Trask, M. T. Balhoff, M. C. Richmond, M. Geier, M. Krafczyk, L.-S. Luo, A. M. Tartakovsky, and T. D. Scheibe. Intercomparison of 3D pore-scale flow and solute transport simulation methods.Advances in Water Resources, 95:176–189, 2016
work page 2016
-
[6]
D. Morgan and R. Jacobs. Opportunities and challenges for machine learning in materials science.Annual Review of Materials Research, 50, 2020
work page 2020
-
[7]
M. J. Blunt, B. Bijeljic, H. Dong, O. Gharbi, S. Iglauer, P. Mostaghimi, A. Paluszny, and C. Pentland. Pore-scale imaging and modelling.Advances in Water Resources, 51:197–216, 2013
2013
-
[8]
S. N. Chiu, D. Stoyan, W. S. Kendall, and J. Mecke.Stochastic Geometry and its Applica- tions. J. Wiley & Sons, 3rd edition, 2013
work page 2013
Show all 58 references
-
[9]
Jeulin.Morphological Models of Random Structures
D. Jeulin.Morphological Models of Random Structures. Springer, 2021
2021
-
[10]
Ohser and K
J. Ohser and K. Schladitz.3D Images of Materials Structures: Processing and Analysis. Wiley-VCH, 2009
2009
-
[11]
Neumann, P
M. Neumann, P. Gr¨ afensteiner, E. Machado Charry, U. Hirn, A. Hilger, I. Manke, R. Schen- nach, V. Schmidt, and K. Zojer. R-vine copulas for data-driven quantification of descriptor relationships in porous materials.Advanced Theory and Simulations, 7:2301261, 2024
2024
-
[12]
Neumann, M
M. Neumann, M. Ademmer, M. Osenberg, A. Hilger, F. Wilde, S. Muench, M. D. Hager, U. S. Schubert, I. Manke, and V. Schmidt. 3D microstructure characterization of polymer battery electrodes by statistical image analysis based on synchrotron X-ray tomography. Journal of Power So...
2022
-
[13]
Ademmer, P.-H
M. Ademmer, P.-H. Su, L. Dodell, J. Asenbauer, M. Osenberg, A. Hilger, J.-K. Chang, I. Manke, M. Neumann, V. Schmidt, and D. Bresser. Unveiling the impact of cross-linking redox-active polymers on their electrochemical behavior by 3D imaging and statistical microstructure anal...
2023
-
[14]
Dodell, M
L. Dodell, M. Neumann, M. Osenberg, A. Hilger, G. Studer, B. Esser, I. Manke, and V. Schmidt. Quantifying local heterogeneities in the 3D morphology of X-PVMPT battery electrodes based on FIB-SEM measurements.ACS Materials Letters, 7:1914–1921, 2025
1914
-
[15]
Whitaker
S. Whitaker. Flow in porous media I: A theoretical derivation of Darcy’s law.Transport in Porous Media, 1:3–25, 1986
1986
-
[16]
Neumann, E
M. Neumann, E. Machado-Charry, E. Baikova, A. Hilger, U. Hirn, R. Schennach, I. Manke, V. Schmidt, and K. Zojer. Capturing centimeter-scale local variations in paper pore space viaµ-CT: A benchmark study using calendered paper.Microscopy and Microanalysis, 27:1305–1315, 2021. 25
2021
-
[17]
S. R. Sternberg. Biomedical image processing.Computer, 16:22–34, 1983
1983
-
[18]
Machado Charry, M
E. Machado Charry, M. Neumann, J. Lahti, R. Schennach, V. Schmidt, and K. Zojer. Pore space extraction and characterization of sack paper usingµ-CT.Journal of Microscopy, 272:35–46, 2018
2018
-
[19]
Paper and board: Determination of air permeance (medium range) – Part 5: Gurley method
ISO 5636-5:2013. Paper and board: Determination of air permeance (medium range) – Part 5: Gurley method. Standard, Geneva: Standard, International Organization for Standardization, 2013
2013
-
[20]
Leitl, E
P. Leitl, E. Machado-Charry, E. Baikova, M. Neumann, U. Hirn, V. Schmidt, and K. Zojer. Joint distributions of local pore space properties quantitatively explain simulated air flow variations in paper.Transport in Porous Media, 148:1–22, 2023
2023
-
[21]
P. H. Valvatne and M. J. Blunt. Predictive pore-scale modeling of two-phase flow in mixed wet media.Water Resources Research, 40:W07406, 2004
2004
-
[22]
J. Zhao, F. Qin, Q. Kang, C. Qin, D. Derome, and J. Carmeliet. A dynamic pore network model for imbibition simulation considering corner film flow.Water Resources Research, 58:WR032332, 2022
2022
-
[23]
Aslannejad, S
H. Aslannejad, S. M. Hassanizadeh, A. Raoof, D. A. M. de Winter, N. Tomozeiu, and M. T. van Genuchten. Characterizing the hydraulic properties of paper coating layer using FIB- SEM tomography and 3D pore-scale modeling.Chemical Engineering Science, 160:275–280, 2017
2017
-
[24]
Fischer, C
R. Fischer, C. M. Schlep¨ utz, D. Hegemann, R. M. Rossi, D. Derome, and J. Carmeliet. Four-dimensional imaging and free-energy analysis of sudden pore-filling events in wicking of yarns.Physical Review E, 103:053101, 2021
2021
-
[25]
Bernab´ e
Y. Bernab´ e. Gaseous flow through heterogeneous, partially connected networks of pipes. Scientific Reports, 8:14956, 2018
2018
-
[26]
Sohr.The Navier-Stokes Equations: An Elementary Functional Analytic Approach
H. Sohr.The Navier-Stokes Equations: An Elementary Functional Analytic Approach. Springer, 2012
2012
-
[27]
K. Xu, W. Wei, Y. Chen, H. Tian, S. Xu, and J. Cai. A pore network approach to study throat size effect on the permeability of reconstructed porous media.Water, 14:77, 2022
2022
-
[28]
T. I. Gombosi.Gaskinetic Theory. Cambridge Atmospheric and Space Science Series. Cambridge University Press, 1994
1994
-
[29]
J. Zhao, F. Qin, D. Derome, Q. Kang, and J. Carmeliet. Improved pore network models to simulate single-phase flow in porous media by coupling with lattice Boltzmann method. Advances in Water Resources, 145:103738, 2020
2020
-
[30]
I. M. Hutten.Handbook of Nonwoven Filter Media. Butterworth-Heinemann, 2015
2015
-
[31]
Schindelin, I
J. Schindelin, I. Arganda-Carreras, E. Frise, V. Kaynig, M. Longair, T. Pietzsch, S. Preibisch, C. Rueden, S. Saalfeld, B. Schmid, J.-Y. Tinevez, D. W. White, V. Harten- stein, K. Eliceiri, P. Tomancak, and A. Cardona. Fiji: an open-source platform for biological-image analysi...
2012
-
[32]
P. Leitl. Modelling the air flow through a paper web using computational fluid dynamics. Master’s thesis, Graz University of Technology, 2020
2020
-
[33]
Gostick, Z
J. Gostick, Z. Khan, T. Tranter, M. Kok, M. Agnaou, M. Sadeghi, and R. Jervis. PoreSpy: A Python toolkit for quantitative analysis of porous media images.Journal of Open Source Software, 4:1296, 2019. 26
2019
-
[34]
Soille.Morphological Image Analysis: Principles and Applications
P. Soille.Morphological Image Analysis: Principles and Applications. Springer, 2nd edition, 2003
2003
-
[35]
C. R. Maurer, R. Qi, and V. Raghavan. A linear time algorithm for computing exact Euclidean distance transforms of binary images in arbitrary dimensions.IEEE Transactions on Pattern Analysis and Machine Intelligence, 25:265–270, 2003
2003
-
[36]
J. T. Gostick. Versatile and efficient pore network extraction method using marker-based watershed segmentation.Physical Review E, 96:023307, 2017
2017
-
[37]
Gostick, M
J. Gostick, M. Aghighi, J. Hinebaugh, T. Tranter, M. A. Hoeh, H. Day, B. Spellacy, M. H Sharqawy, A. Bazylak, A. Burns, et al. OpenPNM: a pore network modeling package. Computing in Science & Engineering, 18:60–74, 2016
2016
-
[38]
Ioannidis and I
M. Ioannidis and I. Chatzis. Network modeling of pore structure and transport-properties of porous-media.Chemical Engineering Science, 48:951, 1993
1993
-
[39]
T. Sochi. Newtonian flow in converging-diverging capillaries.International Journal of Modeling, Simulation, and Scientific Computing, 04:1350011, 2013
2013
-
[40]
Akbari, D
M. Akbari, D. Sinton, and M. Bahrami. Viscous flow in variable cross-section microchannels of arbitrary shapes.International Journal of Heat and Mass Transfer, 54:3970–3978, 2011
2011
-
[41]
X. Miao, K. M. Gerke, and T. O. Sizonenko. A new way to parameterize hydraulic con- ductances of pore elements: A step towards creating pore-networks without pore shape simplifications.Advances in Water Resources, 105:162–172, 2017
2017
-
[42]
Rodriguez de Castro, M
A. Rodriguez de Castro, M. Agnaou, and J. Gostick. Predicting shear-thinning fluid flows in porous media using pore network modeling: Simulations and experimental validation. Transport in Porous Media, 149:453–478, 2023
2023
-
[43]
Holzer, B
L. Holzer, B. Iwanschitz, T. Hocker, L. Keller, O. M. Pecho, G. Sartoris, P. Gasser, and B. M¨ unch. Redox cycling of Ni–YSZ anodes for solid oxide fuel cells: influence of tortuosity, constriction and percolation factors on the effective transport properties.Journal of Power ...
2013
-
[44]
Barman, H
S. Barman, H. Rootz´ en, and D. Bolin. Prediction of diffusive transport through polymer films from characteristics of the pore geometry.AIChE Journal, 65:446–457, 2019
2019
-
[45]
Neumann, O
M. Neumann, O. Stenzel, F. Willot, L. Holzer, and V. Schmidt. Quantifying the influence of microstructure on effective conductivity and permeability: virtual materials testing. International Journal of Solid and Structures, 184:211–220, 2020
2020
-
[46]
Schladitz, J
K. Schladitz, J. Ohser, and W. Nagel. Measuring intrinsic volumes in digital 3D images. In A. Kuba, L. G. Ny´ ul, and K. Pal´ agyi, editors,International Conference on Discrete Geometry for Computer Imagery (DGCI), pages 247–258, Berlin, 2006. Springer, Lecture Notes in Comput...
2006
-
[47]
Holzer, P
L. Holzer, P. Marmet, M. Fingerle-Straß, A. Wiegmann, M. Neumann, and V. Schmidt. Tortuosity and Microstructure Effects in Porous Media: Classical Theories, Empirical Data and Modern Methods. Springer, 2023
2023
-
[48]
E. W. Dijkstra. A note on two problems in connexion with graphs.Numerische Mathematik, 1:269–271, 1959
1959
-
[49]
Serra.Image Analysis and Mathematical Morphology
J. Serra.Image Analysis and Mathematical Morphology. Academic Press, 1982
1982
-
[50]
Holzer, D
L. Holzer, D. Wiedenmann, B. M¨ unch, L. Keller, M. Prestat, P. Gasser, I. Robertson, and B. Grob´ ety. The influence of constrictivity on the effective transport properties of porous 27 layers in electrolysis and fuel cells.Journal of Materials Science, 48:2934–2952, 2013
2013
-
[51]
M. H. Kutner, C. J. Nachtsheim, J. Neter, and W. Li.Applied Linear Statistical Models. McGraw-Hill, 5th edition, 2004
2004
-
[52]
Hommel, E
J. Hommel, E. Coltman, and H. Class. Porosity–permeability relations for evolving pore space: A review with a focus on (bio-)geochemically altered porous media.Transport in Porous Media, 124:589–629, 2018
2018
-
[53]
R. Gebart. Permeability of unidirectional reinforcements for RTM.Journal of Composite Materials, 26:1100–1133, 1992
1992
-
[54]
Nabovati, E
A. Nabovati, E. W. Llewellin, and A. C. M. Sousa. A general model for the permeability of fibrous porous media based on fluid flow simulations using the lattice Boltzmann method. Composites Part A: Applied Science and Manufacturing, 40:860–869, 2009
2009
-
[55]
Matlab, 2022
The MathWorks Inc. Matlab, 2022. Version: 9.12 (R2022a)
2022
-
[56]
Spiess and N
A.-N. Spiess and N. Neumeyer. An evaluation ofR 2 as an inadequate measure for nonlinear models in pharmacological and biochemical research: A Monte Carlo approach.BMC Pharmacology, 10:6, 2010
2010
-
[57]
H. Peng, F. Long, and C. Ding. Feature selection based on mutual information criteria of max-dependency, max-relevance, and min-redundancy.IEEE Transactions on Pattern Analysis and Machine Intelligence, 27:1226–1238, 2005
2005
-
[58]
J. H. van der Linden, G. A. Narsilio, and A. Tordesillas. Machine learning framework for analysis of transport through complex networks in porous, granular media: A focus on permeability.Physical Review E, 94, 2016. Statements and Declarations F unding.The authors appreciate f...
2016
Reviewed August 7, 2026 · model on record in the stance chip above.
Discussion (0). Continue with ORCID to comment.