REVIEW 3 major objections 4 minor 1 cited by
JWST IFU observations uncover host galaxy continua in extremely red and obscured quasars
T0 review · 3 major / 4 minor · reviewed 2026-08-07 · deepseek-v4-flash
Pith's one-line read JWST integral-field observations recover the host galaxies of extremely red and obscured quasars, showing compact hosts with half-light radii of 1.4-2.9 kpc and stellar masses near $10^{10.6}$-$10^{10.9}$ solar masses.
desk verdict First JWST IFU host continuum measurements for ERQs are a real step forward, but the compact-size and offset claims need a PSF systematics test. read the letter →
The pith
A machine-rendered reading of the paper's core claim, the machinery that carries it, and where it could break.
The reading
What carries the argument
The load-bearing mechanism is an empirical, wavelength-dependent PSF model built from dedicated JWST standard-star observations (program 3399, 16 dithers) reduced like the science data, then subtracted from each target cube with GALFIT along the spectral axis. A PSF plus uniform background are fit with free centroid and flux; the residual images, averaged over line-free wavelength ranges, are modeled with a single Sersic profile to get sizes and shapes, and forced photometry at fixed Sersic parameters yields the host spectrum, which pPXF fits with Bruzual and Charlot stellar population templates. This transfers the quasar-host separation from the spectral domain, where continuum and additive polynomials are degenerate, to the spatial domain, where PSF structure is explicitly modeled.
What would settle it
Run injection-recovery tests with the same standard-star PSF: add simulated Sersic hosts of known radius and centering under a scaled quasar PSF at the observed PSF-to-host ratios (3-170), then apply the full GALFIT pipeline; if recovered half-light radii are systematically biased below input by more than roughly 0.3 kpc, or if spurious 0.4-1.3 kpc centroid offsets appear for centered inputs at the observed noise levels, the compact-size and offset claims do not survive.
Extended reading notes
Core claim
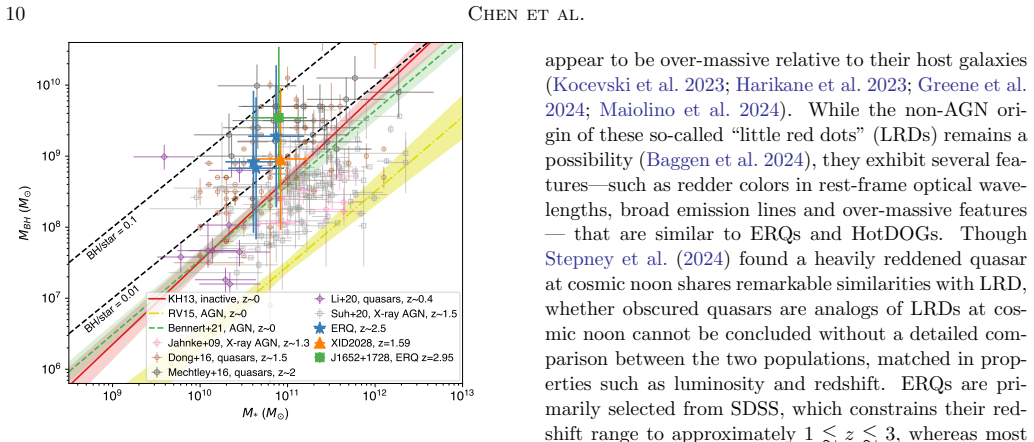
The central discovery is that the stellar continua of the hosts can be cleanly separated from quasar light across a full spectral cube, not just in a single broadband image. For eight targets, the separated light forms a spatially extended galaxy with a measurable Sersic profile; the five reliably measured hosts have stellar masses in the range $10^{10.6}$-$10^{10.9}$ solar masses and the ERQs have half-light radii of 1.4-2.9 kpc. Most quasars are offset from their host centers by 0.4-1.3 kpc, which the authors interpret as dynamical signatures of a post-merger phase or as the effect of uneven dust obscuration. The same measurements place the ERQs 0.5-2 dex above the local black-hole-to-stellar-mass relation, and, compared with earlier HST-based work, they yield more compact hosts, lower Sersic indices, and lower stellar masses.
Load-bearing premise
The results stand or fall on the assumption that the PSF built from dedicated standard-star observations matches the JWST PSF at the position, wavelength, and dither pattern of each science target; if the true PSF is slightly broader or narrower, the compact radii, low Sersic indices, and quasar-host offsets could be fitting artifacts rather than real host properties.
Editorial extensions
If this is right
- The measured stellar masses place ERQ hosts in dark matter halos of roughly $10^{12}$-$10^{13}$ solar masses, consistent with abundance matching and clustering expectations for quasars at $z\sim1$-$3$.
- ERQ hosts sit between the size-mass relations of early-type and late-type galaxies, suggesting a star-forming-to-quiescent transition at cosmic noon.
- The frequent 0.4-1.3 kpc quasar-host offsets, together with tidal features in two targets, support a picture in which obscured quasars are triggered by mergers or hide behind uneven dust.
- ERQs appear to host over-massive black holes relative to local relations, linking them to HotDOGs and JWST-discovered high-redshift black hole candidates, though selection bias is a viable alternative.
- JWST IFU decomposition yields systematically more compact hosts and lower stellar masses than HST-based studies, so previous space-based sizes for such quasars may be systematically overestimated.
Reading between the lines
- If the compact sizes survive an independent PSF construction, the factor-of-two size discrepancy between HST and JWST implies that quasar host size measurements at cosmic noon are resolution-limited, and scaling relations built on HST photometry may need revisiting.
- The quasar-host offsets could be tested directly: a dust-obscuration origin predicts that extinction-corrected, rest-frame infrared centroids should move toward the quasar, while a recoiling or off-center black hole would leave a centroid offset even at long wavelengths.
- Extending this PSF-subtraction approach to unobscured quasars, where the quasar-to-host contrast is even higher, would test whether the over-massive black hole trend is confined to dusty systems or is a general property of quasar selection.
- The marginal host detections among several targets mean the method's yield should be checked against a larger, deeper sample before taking the 1.4-2.9 kpc range as the typical size of ERQ hosts.
Editorial analysis
A structured set of objections, weighed in public.
Referee Report
Summary. This paper presents JWST NIRSpec IFU observations of six extremely red quasars (ERQs) at z=2.4-2.9 and two obscured quasars at z=0.4 and 1.6. The authors develop a PSF-subtraction approach using dedicated standard-star observations (program 3399) to separate quasar and host continuum, fit single-Sersic models to wavelength-averaged PSF-subtracted images, and use forced photometry plus pPXF fits to BC03 templates to derive rest-frame V-band luminosities and stellar masses for five targets. They report compact host half-light radii of 1.4-2.9 kpc, stellar masses of 10^10.6-10^10.9 Msun, 0.4-1.3 kpc quasar-host offsets, and black hole-to-stellar mass ratios of 0.01-0.04, and compare these with abundance-matching expectations, the local MBH-M* relation, and HST-based measurements.
Significance. If the measurements are robust, the paper would be a valuable step: direct host stellar continuum for obscured quasars at cosmic noon, a test of abundance-matching halo-mass expectations for quasar hosts, and a demonstration that JWST IFU image decomposition can recover host light under high PSF-to-host contrast. The paper has real strengths: independent measurement of masses and radii using external calibrations (BC03 templates, Greene-Ho H-alpha relation), explicit propagation of Sersic-model and 0.3 dex mass-to-light systematics into stellar masses, public data release through MAST, and an appropriately hedged discussion of selection bias in the over-massive black hole conclusion. I find no circularity in the abundance-matching comparison; the measured masses do not use halo predictions. However, the central compact-host and offset claims rest on an unvalidated standard-star PSF model at each target position, and the skeptic's concern that PSF mismatch would create compact, low-Sersic, offset residuals is not addressed in the manuscript.
major comments (3)
- [§2.4, §3.1] The PSF model built from program 3399 standard-star observations is load-bearing for every result in the paper, yet the manuscript shows no validation that this model reproduces the on-source PSF at each target position and wavelength. The reported offsets are 0.4-1.3 kpc, i.e., roughly 1-3 pixels at the 0.05 arcsec pixel scale against a PSF FWHM of about 0.066 arcsec at 2 um; a small systematic PSF centroid or width error would produce exactly the compact, low-Sersic residuals and shifted host centroids reported here. I request injected-source recovery tests, a split-dither bootstrap of the 16-dither PSF construction, comparison with any unresolved in-field source, and explicit uncertainties on the quasar-host offsets. Without such tests, the compact sizes and offsets cannot be distinguished from PSF artifacts.
- [Table 2, Figure 3] Only three targets (J0834+0159, J1232+0912, and J2215-0056) have well-constrained single-Sersic fits, while J0832+1615, J1217+0234, and F2M1106 are flagged in Section 3.1 as poorly constrained, and XID2028 and J1652+1728 are irregular or clumpy. Yet the abstract and Section 4.1 treat compact hosts as a sample-wide result. Moreover, J1232+0912 and J2215-0056 have Sersic indices pinned at the n=0.5 lower limit, and Section 4.1 itself notes that central PSF over-subtraction can bias n low; the "disk-like, low-Sersic" characterization is therefore not supported for these two objects. The comparison with the van der Wel size-mass relations in Figure 5 should be restricted to the reliable subset and should include the systematic effect of the central-pixel mask and PSF residuals on Re and n.
- [§4.2, Table 2] The quasar-host offset is a headline finding, but the offsets are not listed in Table 2 and have no reported uncertainties or significance levels. Because the offsets are small relative to the PSF FWHM and the alternative non-uniform dust obscuration explanation is also invoked, the current presentation cannot support the claim of "significant spatial offsets" as a robust result. Please provide the measured offsets with errors for all eight targets, and demonstrate with simulations that offset recovery is unbiased under the actual PSF model.
minor comments (4)
- [§3.1] The sentence "With the exception of J1217–0056" appears to refer to J1217+0234; please correct the target name.
- [Table 2] The '?' markers for unconstrained fits appear inside the error fields (e.g., '1.1±0.2?'); define the notation clearly in the caption and separate the flag from the value.
- [§2.4] The PSF subtraction method is described as 'Chen et al., in prep.', but since the present paper's conclusions depend on it, the key details (PSF construction, dither combination, GALFIT configuration, masking) should be given in an appendix, or the companion paper should be cited with a preprint identifier.
- [Figure 5] The caption says 'stellar luminosity' while the text and axes describe stellar mass; please make the wording consistent.
Circularity Check
No significant circularity: host masses, radii, and offsets are measured from JWST data with external calibrations; consistency claims are comparisons rather than derivations.
full rationale
I examined the derivation chain for load-bearing reductions of the results to their own inputs. The host morphology measurements (half-light radii, Sersic indices, and quasar-host offsets) come from GALFIT fits to JWST NIRSpec IFU data after subtracting a wavelength-dependent PSF model built from dedicated standard-star observations (Section 2.4). This PSF model is an external calibration; it is not derived from, or fitted to, the target host properties it is used to measure. The quoted compact radii and offsets are therefore empirical outputs, not self-defined quantities. Stellar masses are obtained by fitting Bruzual & Charlot (2003) templates with pPXF to the extracted host spectra (Section 2.6), and black hole masses use the Greene & Ho (2005) virial calibration (Equation 1); neither calibration incorporates the paper's conclusions. The abundance-matching consistency statement in Section 4.1 compares the measured stellar masses to external predictions from clustering and abundance matching and from the Behroozi et al. (2013) stellar-mass-to-halo-mass relation; it does not derive the measured values from those predictions. The comparison to HST-based results (Section 4.4) is a benchmark against independent prior observations, not an input to the fits. Self-citations to Wylezalek et al. (2022), Vayner et al. (2023, 2024), and Zakamska et al. (2019) provide target selection, context, and prior measurements, but none is used to force the central results. The paper itself flags real limitations—residual PSF-subtraction issues, poorly constrained Sersic indices for some targets, marginal detections, and possible central over-subtraction (Sections 2.5, 3.1, 4.1)—but these are empirical systematic uncertainties, not circular logic. The PSF-model accuracy concern raised by the skeptic is a testable technical risk, not a case where the derivation reduces to its inputs. I find no step where a prediction is equivalent by construction to a fitted parameter or where a load-bearing premise is justified only by a self-citation chain.
Assumptions & free parameters
free parameters (6)
- Sersic index n =
0.5 to 1.6 for reliable fits, many at or near the allowed range 0.5-8
- Effective radius Re =
0.7 to 4.9 kpc; central ERQs 1.4-2.9 kpc
- Host galaxy AB magnitude =
21.1 to 24.0 in the chosen rest-frame windows
- PSF centroid and flux =
per image, not tabulated
- Central pixel exclusion radius =
2 to 4 pixels depending on quasar brightness
- Mass-to-light ratio M/L_V =
0.51 to 1.68 solar units
assumptions (5)
- domain assumption The standard-star PSF (program 3399) is representative of the on-source PSF for all science targets, including wavelength dependence and dither sampling.
- domain assumption The host galaxy light outside the masked central 2-4 pixels is well described by a single Sersic profile with free centroid (or quasar-fixed for J1217+0234).
- domain assumption The BC03 stellar population synthesis templates, with the chosen metallicities and with no multiplicative or additive polynomial or dust reddening, cover the true stellar populations of the hosts.
- domain assumption The Greene and Ho (2005) single-epoch H-alpha calibration yields unbiased black hole masses for ERQs at z = 2.4-2.9.
- domain assumption A flat Lambda-CDM cosmology with Omega_m=0.3, Omega_Lambda=0.7, H0=70 km/s/Mpc is adopted for physical scales.
Cite this review
Pith. "Pith review of JWST IFU observations uncover host galaxy continua in extremely red and obscured quasars." pith.science (2026). https://pith.science/paper/XOFPQO7J
@misc{pith2026250612124,
  author       = {Pith},
  title        = {Pith review of: JWST IFU observations uncover host galaxy continua in extremely red and obscured quasars},
  year         = {2026},
  howpublished = {\url{https://pith.science/paper/XOFPQO7J}},
  note         = {Machine review of arXiv:2506.12124}
}
abstract
Uncovering bright quasars' host galaxies at cosmic noon is challenging because of the high contrast between the quasar and its host and redshifted light, making them primarily visible in the infrared. We present JWST NIRSpec integral field unit (IFU) observations of six extremely red quasars (ERQs) at $z=2.4-2.9$ and two dust-obscured quasars at lower redshifts. Using image decomposition across the spectral range, we successfully separate quasar and host galaxy continuum emission, model host morphologies, and extract spectra. The ERQs and obscured quasars have compact host galaxies with half-light radii of 1.4$-$2.9 kpc and stellar masses of 10$^{10.6-10.9}$ $M_{\odot}$. Their stellar masses are consistent with the average stellar mass of quasar hosts as expected from abundance matching and clustering analysis. Most of the quasars in our sample exhibit significant spatial offsets (0.4$-$1.3 kpc) between the quasar and host galaxy, potentially caused by post-merger dynamics or non-uniform dust obscuration. The ERQs reside 0.5$-$2 dex above the local black hole-stellar mass relation, similar to other heavily obscured populations such as HotDOGs, optically selected quasars at cosmic noon, and high-redshift SMBH candidates identified with JWST. However, this "over-massive" feature might be attributed to selection bias. Compared to HST-based studies, our JWST measurements reveal more compact host galaxies, smaller Sersic indices, and lower stellar masses, likely because of improved resolution, more accurate modeling, and minimal line contamination. These findings highlight the unique capabilities of JWST IFU in revealing quasar host galaxy properties and potential evolutionary stages of obscured quasars at cosmic noon.
Figures


Figures from the paper (3 more)


Forward citations
Cited by 1 Pith paper
-
Investigating Little Red Dots with UV Excess: Are They the High-Redshift Siblings of Blue Hot DOGs?
Little Red Dots are not the high-redshift relatives of Blue-excess Hot DOGs; they have less dust obscuration, little hot dust, and likely a different power source.
Reference graph
Works this paper leans on
-
[1]
Assef, R. J., Eisenhardt, P. R. M., Stern, D., et al. 2015, ApJ, 804, 27, doi: 10.1088/0004-637X/804/1/27 Astropy Collaboration, Robitaille, T. P., Tollerud, E. J., et al. 2013, A&A, 558, A33, doi: 10.1051/0004-6361/201322068 Astropy Collaboration, Price-Whelan, A. M., Sip˝ ocz, B. M., et al. 2018, AJ, 156, 123, doi: 10.3847/1538-3881/aabc4f Astropy Colla...
-
[2]
Baggen, J. F. W., van Dokkum, P., Brammer, G., et al. 2024, ApJL, 977, L13, doi: 10.3847/2041-8213/ad90b8
-
[3]
Begelman, M. C., Blandford, R. D., & Rees, M. J. 1980, Nature, 287, 307, doi: 10.1038/287307a0
doi:10.1038/287307a0 1980
-
[4]
Behroozi, P. S., Wechsler, R. H., & Conroy, C. 2013, ApJ, 770, 57, doi: 10.1088/0004-637X/770/1/57
-
[5]
Malkan, M. A. 2011, ApJ, 726, 59, doi: 10.1088/0004-637X/726/2/59
-
[6]
Bennert, V. N., Treu, T., Ding, X., et al. 2021, ApJ, 921, 36, doi: 10.3847/1538-4357/ac151a
-
[7]
Bertemes, C., Wylezalek, D., Rupke, D. S. N., et al. 2025, A&A, 693, A176, doi: 10.1051/0004-6361/202450451
-
[8]
Blecha, L., & Loeb, A. 2008, MNRAS, 390, 1311, doi: 10.1111/j.1365-2966.2008.13790.x B¨ oker, T., Arribas, S., L¨ utzgendorf, N., et al. 2022, A&A, 661, A82, doi: 10.1051/0004-6361/202142589
arXiv 2008
Show all 82 references
-
[9]
Brodwin, M., Dey, A., Brown, M. J. I., et al. 2008, ApJL, 687, L65, doi: 10.1086/593327
2008 doi
-
[10]
2018, A&A, 612, A29, doi: 10.1051/0004-6361/201731641
Brusa, M., Cresci, G., Daddi, E., et al. 2018, A&A, 612, A29, doi: 10.1051/0004-6361/201731641
2018 doi
-
[11]
2003, MNRAS, 344, 1000, doi: 10.1046/j.1365-8711.2003.06897.x
Bruzual, G., & Charlot, S. 2003, MNRAS, 344, 1000, doi: 10.1046/j.1365-8711.2003.06897.x
2003
-
[12]
2024, JWST Calibration Pipeline, 1.14.0, Zenodo, doi: 10.5281/zenodo.6984365
Bushouse, H., Eisenhamer, J., Dencheva, N., et al. 2024, JWST Calibration Pipeline, 1.14.0, Zenodo, doi: 10.5281/zenodo.6984365
2024 doi
-
[13]
2017, MNRAS, 466, 798, doi: 10.1093/mnras/stw3020 —
Cappellari, M. 2017, MNRAS, 466, 798, doi: 10.1093/mnras/stw3020 —. 2023, MNRAS, 526, 3273, doi: 10.1093/mnras/stad2597
2017 doi
-
[14]
C., Blain, A., Ibata, R., et al
Chapman, S. C., Blain, A., Ibata, R., et al. 2009, ApJ, 691, 560, doi: 10.1088/0004-637X/691/1/560
2009 doi
-
[15]
E., & White, M
Conroy, C., Gunn, J. E., & White, M. 2009, ApJ, 699, 486, doi: 10.1088/0004-637X/699/1/486
2009 doi
-
[16]
2015, ApJ, 799, 82, doi: 10.1088/0004-637X/799/1/82
Cresci, G., Mainieri, V., Brusa, M., et al. 2015, ApJ, 799, 82, doi: 10.1088/0004-637X/799/1/82
2015 doi
-
[17]
2023, A&A, 672, A128, doi: 10.1051/0004-6361/202346001
Cresci, G., Tozzi, G., Perna, M., et al. 2023, A&A, 672, A128, doi: 10.1051/0004-6361/202346001
2023 doi
-
[18]
J., Springel, V., White, S
Croton, D. J., Springel, V., White, S. D. M., et al. 2006, MNRAS, 365, 11, doi: 10.1111/j.1365-2966.2005.09675.x Q3D: Host galaxy13
2006
-
[19]
2018, in Society of Photo-Optical Instrumentation Engineers (SPIE) Conference Series, Vol
Deshpande, A., L¨ utzgendorf, N., Ferruit, P., et al. 2018, in Society of Photo-Optical Instrumentation Engineers (SPIE) Conference Series, Vol. 10698, Space Telescopes and Instrumentation 2018: Optical, Infrared, and Millimeter Wave, ed. M. Lystrup, H. A. MacEwen, G. G
2018
-
[20]
Batalha, N
Fazio, N. Batalha, N. Siegler, & E. C. Tong, 106985N, doi: 10.1117/12.2312425 Di Matteo, T., Springel, V., & Hernquist, L. 2005, Nature, 433, 604, doi: 10.1038/nature03335
2005 doi
-
[21]
A., Myers, A
DiPompeo, M. A., Myers, A. D., Hickox, R. C., et al. 2015, MNRAS, 446, 3492, doi: 10.1093/mnras/stu2341
2015 doi
-
[22]
Y., & Wu, X.-B
Dong, X. Y., & Wu, X.-B. 2016, ApJ, 824, 70, doi: 10.3847/0004-637X/824/2/70
2016 doi
-
[23]
D., White, M., et al
Eftekharzadeh, S., Myers, A. D., White, M., et al. 2015, MNRAS, 453, 2779, doi: 10.1093/mnras/stv1763
2015 doi
-
[24]
Eisenhardt, P. R. M., Wu, J., Tsai, C.-W., et al. 2012, ApJ, 755, 173, doi: 10.1088/0004-637X/755/2/173
2012 doi
-
[25]
J., Willott, C., Alberts, S., et al
Eisenstein, D. J., Willott, C., Alberts, S., et al. 2023, arXiv e-prints, arXiv:2306.02465, doi: 10.48550/arXiv.2306.02465 Euclid Collaboration, Bisigello, L., Rodighiero, G., et al. 2025, arXiv e-prints, arXiv:2503.15323, doi: 10.48550/arXiv.2503.15323
-
[26]
Fabian, A. C. 2012, ARA&A, 50, 455, doi: 10.1146/annurev-astro-081811-125521
2012 doi
-
[27]
2016, ApJL, 822, L32, doi: 10.3847/2041-8205/822/2/L32
Fan, L., Han, Y., Fang, G., et al. 2016, ApJL, 822, L32, doi: 10.3847/2041-8205/822/2/L32
2016 doi
-
[28]
2017, ApJ, 844, 106, doi: 10.3847/1538-4357/aa78f2
Farrah, D., Petty, S., Connolly, B., et al. 2017, ApJ, 844, 106, doi: 10.3847/1538-4357/aa78f2
2017 doi
-
[29]
L., Bagley, M
Finkelstein, S. L., Bagley, M. B., Ferguson, H. C., et al. 2023, ApJL, 946, L13, doi: 10.3847/2041-8213/acade4
2023 doi
-
[30]
P., Mather, J
Gardner, J. P., Mather, J. C., Clampin, M., et al. 2006, SSRv, 123, 485, doi: 10.1007/s11214-006-8315-7
2006 doi
-
[31]
W., & Perrotta, S
Gillette, J., Hamann, F., Lau, M. W., & Perrotta, S. 2024, MNRAS, 527, 950, doi: 10.1093/mnras/stad2890
2024 doi
-
[32]
2015, ApJ, 806, 218, doi: 10.1088/0004-637X/806/2/218
Glikman, E., Simmons, B., Mailly, M., et al. 2015, ApJ, 806, 218, doi: 10.1088/0004-637X/806/2/218
2015 doi
- [33]
-
[34]
E., Labbe, I., Goulding, A
Greene, J. E., Labbe, I., Goulding, A. D., et al. 2024, ApJ, 964, 39, doi: 10.3847/1538-4357/ad1e5f
2024 doi
-
[35]
L., Ross, N., et al
Hamann, F., Zakamska, N. L., Ross, N., et al. 2017, MNRAS, 464, 3431, doi: 10.1093/mnras/stw2387
2017 doi
-
[36]
2023, ApJ, 959, 39, doi: 10.3847/1538-4357/ad029e
Harikane, Y., Zhang, Y., Nakajima, K., et al. 2023, ApJ, 959, 39, doi: 10.3847/1538-4357/ad029e
2023 doi
-
[37]
R., Millman, K
Harris, C. R., Millman, K. J., van der Walt, S. J., et al. 2020, Nature, 585, 357, doi: 10.1038/s41586-020-2649-2
2020 doi
-
[38]
C., Wardlow, J
Hickox, R. C., Wardlow, J. L., Smail, I., et al. 2012, MNRAS, 421, 284, doi: 10.1111/j.1365-2966.2011.20303.x
2012
-
[39]
F., Hernquist, L., Cox, T
Hopkins, P. F., Hernquist, L., Cox, T. J., et al. 2006, ApJS, 163, 1, doi: 10.1086/499298
2006 doi
-
[40]
F., Hernquist, L., Cox, T
Hopkins, P. F., Hernquist, L., Cox, T. J., & Kereˇ s, D. 2008, ApJS, 175, 356, doi: 10.1086/524362
2008 doi
-
[41]
2022, A&A, 661, A80, doi: 10.1051/0004-6361/202142663
Jakobsen, P., Ferruit, P., Alves de Oliveira, C., et al. 2022, A&A, 661, A80, doi: 10.1051/0004-6361/202142663
2022 doi
-
[42]
D., Onoue, M., Inayoshi, K., et al
Kocevski, D. D., Onoue, M., Inayoshi, K., et al. 2023, ApJL, 954, L4, doi: 10.3847/2041-8213/ace5a0
2023 doi
-
[43]
Kormendy, J., & Ho, L. C. 2013, ARA&A, 51, 511, doi: 10.1146/annurev-astro-082708-101811
2013 doi
-
[44]
W., Perrotta, S., Hamann, F., et al
Lau, M. W., Perrotta, S., Hamann, F., et al. 2024, MNRAS, 532, 2044, doi: 10.1093/mnras/stae1621
2024 doi
-
[45]
Law, D. R., E. Morrison, J., Argyriou, I., et al. 2023, AJ, 166, 45, doi: 10.3847/1538-3881/acdddc
2023 doi
-
[46]
D., Shen, Y., et al
Li, J., Silverman, J. D., Shen, Y., et al. 2025, ApJ, 981, 19, doi: 10.3847/1538-4357/ada603
2025 doi
-
[47]
Li, J. I. H., Shen, Y., Ho, L. C., et al. 2021, ApJ, 906, 103, doi: 10.3847/1538-4357/abc8e6
2021 doi
-
[48]
2025, ApJ, 980, 31, doi: 10.3847/1538-4357/ada772
Liu, W., Veilleux, S., Sankar, S., et al. 2025, ApJ, 980, 31, doi: 10.3847/1538-4357/ada772
2025 doi
-
[49]
2007, PhRvL, 99, 041103, doi: 10.1103/PhysRevLett.99.041103
Loeb, A. 2007, PhRvL, 99, 041103, doi: 10.1103/PhysRevLett.99.041103
2007 doi
- [50]
-
[51]
2024, A&A, 691, A145, doi: 10.1051/0004-6361/202347640
Maiolino, R., Scholtz, J., Curtis-Lake, E., et al. 2024, A&A, 691, A145, doi: 10.1051/0004-6361/202347640
2024 doi
-
[52]
J., & Ma, C.-P
McConnell, N. J., & Ma, C.-P. 2013, ApJ, 764, 184, doi: 10.1088/0004-637X/764/2/184
2013 doi
-
[53]
A., et al
Mechtley, M., Jahnke, K., Windhorst, R. A., et al. 2016, ApJ, 830, 156, doi: 10.3847/0004-637X/830/2/156
2016 doi
-
[54]
Y., Ho, L
Peng, C. Y., Ho, L. C., Impey, C. D., & Rix, H.-W. 2002, AJ, 124, 266, doi: 10.1086/340952 —. 2010, AJ, 139, 2097, doi: 10.1088/0004-6256/139/6/2097
2002 doi
-
[55]
2015, A&A, 574, A82, doi: 10.1051/0004-6361/201425035
Perna, M., Brusa, M., Cresci, G., et al. 2015, A&A, 574, A82, doi: 10.1051/0004-6361/201425035
2015 doi
-
[56]
L., et al
Perrotta, S., Hamann, F., Zakamska, N. L., et al. 2019, MNRAS, 488, 4126, doi: 10.1093/mnras/stz1993
2019 doi
-
[57]
Rauscher, B. J. 2024, PASP, 136, 015001, doi: 10.1088/1538-3873/ad1b36
2024 doi
-
[58]
E., & Volonteri, M
Reines, A. E., & Volonteri, M. 2015, ApJ, 813, 82, doi: 10.1088/0004-637X/813/2/82 Rodr ´ ıguez-Torres, S. A., Comparat, J., Prada, F., et al. 2017, MNRAS, 468, 728, doi: 10.1093/mnras/stx454
2015 doi
-
[59]
P., Hamann, F., Zakamska, N
Ross, N. P., Hamann, F., Zakamska, N. L., et al. 2015, MNRAS, 453, 3932, doi: 10.1093/mnras/stv1710
2015 doi
-
[60]
2023, q3dfit: PSF decomposition and spectral analysis for JWST-IFU spectroscopy, Astrophysics Source Code Library, record ascl:2310.004 14Chen et al
Rupke, D., Wylezalek, D., Zakamska, N., et al. 2023, q3dfit: PSF decomposition and spectral analysis for JWST-IFU spectroscopy, Astrophysics Source Code Library, record ascl:2310.004 14Chen et al
2023
-
[61]
Rupke, D. S. N. 2014, IFSFIT: Spectral Fitting for Integral Field Spectrographs. http://ascl.net/1409.005
2014
-
[62]
Rupke, D. S. N., G¨ ultekin, K., & Veilleux, S. 2017, ApJ, 850, 40, doi: 10.3847/1538-4357/aa94d1
2017 doi
-
[63]
Rupke, D. S. N., Schweitzer, M., Viola, V., et al. 2021, QUESTFIT: Fitter for mid-infrared galaxy spectra. http://ascl.net/2112.002
2021
-
[64]
B., Soifer, B
Sanders, D. B., Soifer, B. T., Elias, J. H., et al. 1988, ApJ, 325, 74, doi: 10.1086/165983
1988 doi
-
[65]
Sersic, J. L. 1968, Atlas de Galaxias Australes
1968
-
[66]
2023, Science Advances, 9, eadg8287, doi: 10.1126/sciadv.adg8287
Shen, L., Liu, G., He, Z., et al. 2023, Science Advances, 9, eadg8287, doi: 10.1126/sciadv.adg8287
2023 doi
-
[67]
E., Ho, L
Shen, Y., Greene, J. E., Ho, L. C., et al. 2015, ApJ, 805, 96, doi: 10.1088/0004-637X/805/2/96
2015 doi
- [68]
-
[69]
2024, MNRAS, 533, 2948, doi: 10.1093/mnras/stae1970
Stepney, M., Banerji, M., Tang, S., et al. 2024, MNRAS, 533, 2948, doi: 10.1093/mnras/stae1970
2024 doi
-
[70]
2020, ApJ, 889, 32, doi: 10.3847/1538-4357/ab5f5f van der Wel, A., Franx, M., van Dokkum, P
Suh, H., Civano, F., Trakhtenbrot, B., et al. 2020, ApJ, 889, 32, doi: 10.3847/1538-4357/ab5f5f van der Wel, A., Franx, M., van Dokkum, P. G., et al. 2014, ApJ, 788, 28, doi: 10.1088/0004-637X/788/1/28
2020 doi
-
[71]
L., Riffel, R
Vayner, A., Zakamska, N. L., Riffel, R. A., et al. 2021, MNRAS, 504, 4445, doi: 10.1093/mnras/stab1176
2021 doi
-
[72]
L., Ishikawa, Y., et al
Vayner, A., Zakamska, N. L., Ishikawa, Y., et al. 2023, ApJ, 955, 92, doi: 10.3847/1538-4357/ace784 —. 2024, ApJ, 960, 126, doi: 10.3847/1538-4357/ad0be9
2023 doi
-
[73]
2023, ApJ, 953, 56, doi: 10.3847/1538-4357/ace10f
Veilleux, S., Liu, W., Vayner, A., et al. 2023, ApJ, 953, 56, doi: 10.3847/1538-4357/ace10f
2023 doi
-
[74]
2023, MNRAS, 521, 241, doi: 10.1093/mnras/stad499
Volonteri, M., Habouzit, M., & Colpi, M. 2023, MNRAS, 521, 241, doi: 10.1093/mnras/stad499
2023 doi
-
[75]
2012, ApJ, 756, 96, doi: 10.1088/0004-637X/756/1/96
Wu, J., Tsai, C.-W., Sayers, J., et al. 2012, ApJ, 756, 96, doi: 10.1088/0004-637X/756/1/96
2012 doi
-
[76]
2013, ApJ, 769, 79, doi: 10.1088/0004-637X/769/1/79
Wylezalek, D., Galametz, A., Stern, D., et al. 2013, ApJ, 769, 79, doi: 10.1088/0004-637X/769/1/79
2013 doi
-
[77]
2014, ApJ, 786, 17, doi: 10.1088/0004-637X/786/1/17
Wylezalek, D., Vernet, J., De Breuck, C., et al. 2014, ApJ, 786, 17, doi: 10.1088/0004-637X/786/1/17
2014 doi
-
[78]
Wylezalek, D., Vayner, A., Rupke, D. S. N., et al. 2022, ApJL, 940, L7, doi: 10.3847/2041-8213/ac98c3
2022 doi
-
[79]
2002, MNRAS, 331, 935, doi: 10.1046/j.1365-8711.2002.05242.x
Yu, Q. 2002, MNRAS, 331, 935, doi: 10.1046/j.1365-8711.2002.05242.x
2002
-
[80]
L., & Greene, J
Zakamska, N. L., & Greene, J. E. 2014, MNRAS, 442, 784, doi: 10.1093/mnras/stu842
2014 doi
-
[81]
L., Hamann, F., Pˆ aris, I., et al
Zakamska, N. L., Hamann, F., Pˆ aris, I., et al. 2016, MNRAS, 459, 3144, doi: 10.1093/mnras/stw718
2016 doi
-
[82]
L., Sun, A.-L., Strauss, M
Zakamska, N. L., Sun, A.-L., Strauss, M. A., et al. 2019, MNRAS, 489, 497, doi: 10.1093/mnras/stz2071
2019 doi
Reviewed August 7, 2026 · model on record in the stance chip above.
Discussion (0). Sign in to comment.