REVIEW 3 major objections 6 minor 62 references
The Relationship of Stellar Radius Inflation to Rotation and Magnetic Starspots at 10--670 Myr
T0 review · 3 major / 6 minor · reviewed 2026-08-06 · deepseek-v4-flash
Pith's one-line read A study of 261 low-mass stars in four open clusters aged 10–670 Myr shows radius inflation is a strong function of the Rossby number—with linear and saturated regimes breaking at log Ro ≈ −1.4—and that inflation depends directly on the…
desk verdict Strong new inflation-Rossby relation; the direct starspot dependence needs covariance controls before it can be trusted. read the letter →
The pith
A machine-rendered reading of the paper's core claim, the machinery that carries it, and where it could break.
The reading
What carries the argument
The argument runs on four linked objects: the fractional radius inflation measured against the $f_{\rm spot}=0$ non-magnetic isochrone; the Rossby number $\mathrm{Ro} = P_{\rm rot}/\tau_{\rm CZ}$, using rotation periods from the literature and convective overturn timescales $\tau_{\rm CZ}$ taken from the spotted SPOTS models; the starspot filling fraction $f_{\rm spot}$ and two-temperature effective temperature from the spectroscopic fitting of APOGEE H-band spectra; and the SPOTS/ROTEVOL magnetic isochrones that act as the comparison theory. The same two-temperature fit supplies both the temperature that sets the radius (through the SED pseudo-interferometry with Gaia parallaxes) and the spot fraction, so the machinery ties the measurement of inflation to the measurement of its suspected cause.
What would settle it
Measure radii of a subset of the same stars with a route that does not use the two-temperature effective temperature—eclipsing binaries or long-baseline interferometry—and check whether the inflation–Rossby and inflation–spot correlations persist, or recompute Rossby numbers with convective turnover timescales from non-SPOTS models and see whether the log Ro ≈ −1.4 break survives.
Extended reading notes
Core claim
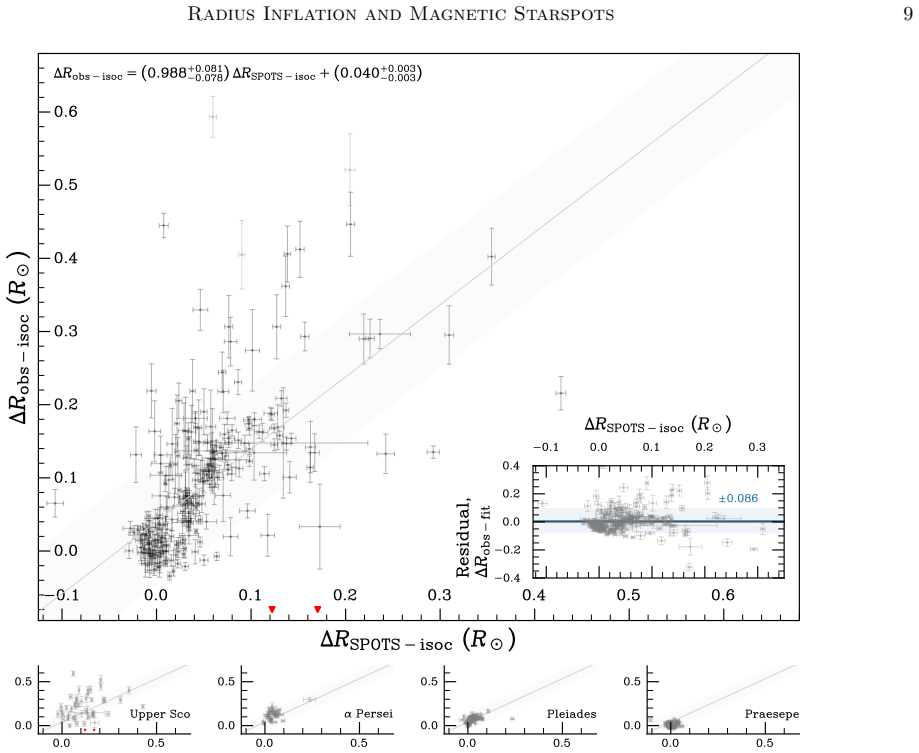
The central claim is that the degree of radius inflation across a large sample of young cluster stars is a universal function of magnetic activity: it rises steeply with decreasing Rossby number, saturates at log Ro ≈ −1.4, and depends directly on the starspot filling fraction $f_{\rm spot}$. The fitted relation is $R_{\rm obs}/R_{\rm isoc} = 0.276\,\exp(1.154(\max(\log \mathrm{Ro}, -1.396)+1.396))$, so the most active stars are about 28 percent larger than non-magnetic isochrones predict, declining by a factor of five by Rossby number unity. Stars' effective temperatures are suppressed as the Rossby number decreases, and the combination of larger radius and lower temperature preserves luminosity, exactly as expected if the core luminosity is radiated through a spotted, less effective surface. The observed inflation correlates with the radii predicted by the spotted SPOTS stellar evolution models at better than 99.9 percent confidence (Kendall's $\tau = 0.492$), with a slope consistent with unity ($0.99 \pm 0.08$) and a small offset of $0.040 \pm 0.003\,R_\odot$; the models capture the inflation but under-predict it by about 0.27 dex for the most active stars. The paper concludes that rotation is the underlying driver, but magnetism—expressed through starspots—is the most likely direct cause.
Load-bearing premise
The inflation and the spot fraction come out of the same two-temperature fit, so any covariance in that fit could manufacture the inflation–spot correlation, and the Rossby numbers lean on convective timescales from the very spotted models the paper is testing.
Editorial extensions
If this is right
- Radii of active young and low-mass stars, and therefore exoplanet radii, carry an activity-dependent bias of up to roughly 25 percent if magnetism is ignored in stellar characterization.
- Radius inflation joins the canonical activity-rotation framework, saturating at a lower Rossby number ($\log \mathrm{Ro} \approx -1.4$) than other activity proxies studied so far.
- Spotted stellar evolution models can predict the radii of inflated pre-main-sequence stars to within about 0.04 solar radii, supporting their routine use in stellar characterization workflows.
- Isochronal age discrepancies reported for pre-main-sequence clusters are largely explained by magnetic starspots rather than by data artifacts, potentially shifting cluster age estimates.
- The inflation signal is a universal function of activity level across 10–670 Myr, not a peculiarity of any one cluster.
Reading between the lines
- If the inflation–spot relation is genuine, radius inflation should vary over individual activity cycles as spot coverage changes, which long-baseline photometric and spectroscopic monitoring of the same stars could test directly.
- The paper's suggestion that different activity proxies saturate at different Rossby numbers could be checked within this same sample using X-ray or H-alpha indices, potentially probing the pressure or depth scale that anchors each magnetic mechanism.
- Applying the fitted inflation relation as a correction factor would remove an activity-dependent bias from exoplanet transit radii and from lithium-based age estimates for young clusters, which the paper points to but does not quantify.
- Because the Rossby numbers use convective timescales from the very spotted models being tested, an independent determination of $\tau_{\rm CZ}$ from non-magnetic models would clarify whether the saturation break at about −1.4 is a physical feature or partly a model artifact.
Signed reviews
Editorial analysis
A structured set of objections, weighed in public.
Referee Report
Summary. This paper analyzes 261 low-mass stars in Upper Sco, alpha Per, the Pleiades, and Praesepe, combining APOGEE two-temperature spectroscopic fits (which yield fspot and Teff), SED-based radii, literature rotation periods, and Gaia parallaxes. The authors report a strong relationship between radius inflation (relative to non-magnetic isochrones) and Rossby number, with a saturated regime for log Ro less than about -1.4 and a declining power-law at larger Ro. They also report a direct dependence of inflation on starspot covering fraction, a temperature suppression that preserves bolometric luminosity, and agreement with the SPOTS magnetic stellar model predictions, albeit with a small offset. The sample and methodology are described in Sections 2 and 3, with MCMC fits in Appendices A and B.
Significance. If the central claims hold, this would be a substantial step toward unifying radius inflation with rotation and magnetic activity across the pre-main sequence to ZAMS, and would provide strong empirical support for starspot-based stellar evolution models. The paper's strengths include a large, homogeneous sample spanning four well-studied clusters; use of empirical rotation periods and Gaia parallaxes; a careful MCMC fitting procedure with variance underestimation; and a multi-criterion binary rejection strategy. However, the validity of the fspot-Rossby-inflation relation rests on assumptions about the two-temperature fits and the choice of convective turnover timescale that are not yet demonstrated.
major comments (3)
- [Section 2.2; Section 3.3] The radius is derived from the flux-weighted Teff produced by the same two-temperature LEOPARD fit that yields fspot. Because R is proportional to Teff^{-2} at fixed bolometric flux and parallax, any covariance between the fitted Teff and fspot--for example, from degeneracies between spot temperature contrast and filling fraction--propagates directly into R and then into R_infl. The claimed direct dependence of radius inflation on starspot covering fraction (Section 3.3, Figures 3-4) could therefore be generated by the measurement pipeline rather than by stellar physics. The paper does not report covariance diagnostics, corner plots for the two-temperature fits, or injection-recovery tests; the error analysis in Section 2.2 assumes Teff and Fbol errors are independent and does not address Teff-fspot covariance. Please add such tests, or recompute radii with an independently determined Teff, to demonstrate that the fspot-inflation relation is not an artifact of the fitting procedure.
- [Section 3.2; Figure 2] The statement that temperature suppression balances radius inflation so as to preserve bolometric luminosity is a tautology of the radius derivation. Since R is computed from the same Fbol and Teff via the Stefan-Boltzmann relation, the luminosity is exactly equal to the measured bolometric flux by construction. Consequently, the observed correlation between R_infl and Teff suppression in Figure 2 (bottom) is not an independent empirical check and cannot be used to support the claim of luminosity preservation. Please reframe this result, and if the goal is to test luminosity conservation, derive radii from independent measurements (e.g., interferometry or eclipsing binaries) or use Teff from a fit that does not adopt the same Fbol.
- [Section 2.2; Section 2.3; Section 3.1] The Rossby number is computed using convective turnover timescales taken from the SPOTS models, which are also the comparison theory in Section 3.3. Any fspot-dependent error in tau_CZ will shift the location of the saturation break and can create or distort a correlation between R_infl and Ro even if rotation is not the underlying driver. To demonstrate that the inflation-Rossby relation is robust, please recompute Ro with an independent tau_CZ calibration (e.g., Noyes et al. 1984 or a non-magnetic standard model) and show that the linear and saturated regimes, and the break near log Ro approximately -1.4, are unchanged. The current approach makes the test of the SPOTS models partly self-referential.
minor comments (6)
- [Figure 2 caption] The equation for the fiducial fit is garbled and appears to have sign errors; the printed expression does not reproduce the stated decline from 28% to 5.5% at Ro = 1. Please correct the equation and the surrounding text.
- [Appendix B] The text says the relation declines by a factor of 5 to 5.5% at a Rossby number of unity; with the stated parameters (saturation y = 0.276 and slope m = 1.154) this only holds if the exponent has a negative sign. Please unify the mathematical expression and the textual description.
- [Section 4] The claim that the inflation signal is a universal function of the stellar activity level is stronger than the data support, since Figure 2 shows systematic vertical offsets between clusters that the authors attribute to age differences; please soften or qualify this statement.
- [Section 2.2] The paper states that errors in Teff and Fbol are assumed to be normally distributed and independent; please also provide the covariances among the LEOPARD output parameters or a reference to where they are published, since these covariances are essential for assessing the fspot-Teef degeneracy.
- [Appendix A] The binary rejection completeness of at least 85% is stated as an assumption; please provide the source of this estimate and consider showing the sensitivity of the main relations to a stricter binary cut.
- [Various] There are several typographical and formatting issues, including 'inreased' in Section 3.2 and the corrupted phrase 'Rspotted SPOTS fspot = 0/RSPOTS fspot = 0' in the Figure 2 caption; please proofread the manuscript.
Circularity Check
Luminosity preservation is a Stefan-Boltzmann identity; the inflation-fspot and SPOTS comparisons reuse the same fitted Teff/fspot, making the spot-driven central claims partly circular.
-
self definitional
[Section 2.2 (radius derivation) and Abstract/Section 3.2]
"In this way, we obtain the empirically measured bolometric flux at Earth (Fbol), which is then converted to an angular diameter, θbol, via the Stefan-Boltzmann relation. For consistency in our analysis, we adopt the best-fit spectroscopic Teff from the flux-weighted two-temperature starspot fits described above. Finally, applying the Gaia DR3 parallax to θbol yields the stellar radius."
The stellar radius is not measured independently; it is computed as R = sqrt(Fbol/(σTeff^4))/parallax. Therefore L = 4πR^2σTeff^4 equals 4πd^2Fbol exactly by construction. The abstract's claim that 'temperature suppression balances the radius inflation so as to preserve the stellar bolometric luminosity' is thus an algebraic restatement of the radius definition, not an independent empirical result. The ΔR versus ΔTeff anti-correlation at fixed Fbol in Figure 2 is forced by this identity.
-
fitted input called prediction
[Section 2.2 and Section 3.3/Abstract]
"Using the two-temperature spectroscopic fitting technique from Cao & Pinsonneault (2022), we obtain starspot filling fractions jointly with six other stellar parameters (microturbulence, vsini, metallicity, Teff, surface gravity, and starspot temperature contrast)... For consistency in our analysis, we adopt the best-fit spectroscopic Teff from the flux-weighted two-temperature starspot fits described above."
The radius inflation signal is derived from the same Teff that is fitted jointly with fspot. At fixed Fbol and parallax, R ∝ Teff^{-2}, so any covariance or degeneracy between the fitted Teff and fspot propagates directly into R and then into R_infl. The paper's headline claim that 'the radius inflation depends directly on the starspot covering fraction' could therefore be generated by the fitting pipeline rather than by stellar physics. No covariance diagnostics or injection-recovery tests are reported to exclude this confound, making the claimed spot-driven correlation load-bearing but not independent.
3 more flagged steps
-
ansatz smuggled in via citation
[Section 2.2 (Rossby conversion) and Section 2.3/Figure 4]
"we convert rotation-period (Prot) measurements from the literature (see Section 2.1) to rotational Rossby number (Ro≡Prot/τCZ). To do this, we require estimates of the convective turnover timescale (τCZ), which we estimate theoretically from SPOTS models (Somers et al. 2020), using observed fspot to lookup appropriate convective overturn timescales."
The independent variable of the paper's central inflation-rotation plot is built using τCZ from the SPOTS model family, whose authors include the present author Cao, and this τCZ depends on the measured fspot. The same SPOTS/ROTEVOL family is then used as the successful 'test case' in Section 2.3 and Figure 4. Thus the model is tested on an abscissa calibrated by the same model and partially determined by the same spot signal that already enters the inflation measurement, weakening the external grounding of the claimed inflation-Rossby relation and the favorable model comparison.
-
self definitional
[Section 3.3, Figure 3 caption and inset]
"We plotted in the inset figures the observed starspot filling factors, and infer a theoretical starspot filling factor from the isochrones by interpolating a starspot value from SPOTS on the Teff–R/R⊙ plane."
The inferred fspot is read off a SPOTS grid using Teff and R, but the observed R is itself computed from the fitted Teff and Fbol, and the observed fspot is fitted jointly with that same Teff in the two-temperature LEOPARD fit. Consequently the observed and inferred fspot values are both functions of the same fitted Teff; their agreement in the insets is partly an internal-consistency check of the fitting method and the SPOTS grid, not an independent confirmation that starspots drive radius inflation.
-
fitted input called prediction
[Section 3.3, Figure 4]
"For a star with a known Teff, age, and starspot filling factor, we compared the SPOTS-predicted radii to those that we observed in Figure 4."
The observed radii were derived from the fitted Teff via the Stefan-Boltzmann relation (Section 2.2), while the SPOTS-predicted radii are computed from the same Teff and from the observed fspot obtained in the same two-temperature fit. Both sides are therefore monotonic functions of the same fitted Teff, so a strong correlation and a slope near unity (0.99±0.08) are expected largely by construction. The reported Kendall's τ and the 1:1 slope do not independently validate the magnetic models unless the radius is measured without using the fitted Teff, which is not the case here.
full rationale
The paper's most novel empirical claims—that radius inflation depends directly on fspot and that temperature suppression preserves bolometric luminosity—are entangled with the measurement pipeline. Radii are not independently measured; they are computed from Fbol and the spectroscopic Teff from the same two-temperature LEOPARD fit that returns fspot. Consequently the luminosity preservation is a Stefan-Boltzmann identity (L = 4πR^2σTeff^4 = 4πd^2Fbol), and the inflation-fspot correlation can be generated by Teff-fspot covariance in the fit. The Rossby axis is also built from SPOTS-model τCZ evaluated at observed fspot, and the same SPOTS/ROTEVOL family is then used as the successful test case; the Figure 3 inset and Figure 4 comparisons feed the same fitted Teff and fspot into both sides. The rotation periods themselves are external, so the inflation-Rossby relation is not wholly circular, but the paper's central spot-driven and model-support conclusions are partially reduced to their own inputs. No injection-recovery or covariance diagnostics are provided to break these degeneracies.
Assumptions & free parameters
free parameters (4)
- log Ro_crit (saturation break) =
-1.396 (+0.076/-0.070)
- saturation amplitude =
0.276 (+0.017/-0.016)
- power-law slope above saturation =
1.154 (+0.087/-0.081)
- linear fit slope and intercept for Figure 4 =
slope 0.988 +/- 0.08, intercept 0.040 +/- 0.003 R_sun
assumptions (7)
- standard math Stefan-Boltzmann relation converts bolometric flux and effective temperature into angular diameter and radius.
- domain assumption NextGen model atmospheres are adequate for SED fitting of these cool stars.
- domain assumption The two-temperature starspot model correctly represents the surface inhomogeneity of spotted stars.
- domain assumption SPOTS model prescriptions for convection suppression and magnetic pressure are a valid description of stellar structure.
- domain assumption Convective turnover timescales from SPOTS models, depending on observed fspot, are appropriate for defining Rossby numbers.
- domain assumption Cluster ages from the literature (10, 80, 112, 670 Myr) are correct.
- domain assumption Binary rejection completeness of ~85% is sufficient; remaining binaries do not drive the signal.
Cite this review
Pith. "Pith review of The Relationship of Stellar Radius Inflation to Rotation and Magnetic Starspots at 10--670 Myr." pith.science (2026). https://pith.science/paper/W5E7KB4A
@misc{pith2026250618972,
  author       = {Pith},
  title        = {Pith review of: The Relationship of Stellar Radius Inflation to Rotation and Magnetic Starspots at 10--670 Myr},
  year         = {2026},
  howpublished = {\url{https://pith.science/paper/W5E7KB4A}},
  note         = {Machine review of arXiv:2506.18972}
}
abstract
Active, low-mass stars are widely observed to have radii that are larger than predicted by standard stellar models. Proposed mechanisms for this radius inflation generally involve stellar magnetism, either in the form of added pressure support in the outer layers and/or suppression of convection via starspots. We have assembled a large sample of 261 low-mass stars in the young clusters Upper Scorpius, $\alpha$ Persei, Pleiades, and Praesepe (spanning ages 10--670 Myr) for which the data exist to empirically measure the stellar radii, rotation periods, and starspot covering fractions. We find a clear, strong relationship between the degree of radius inflation and stellar rotation as represented by the Rossby number; this inflation-rotation relationship bears striking resemblance to canonical activity-rotation relationships, including both the so-called linear and saturated regimes. We also demonstrate here for the first time that the radius inflation depends directly on the starspot covering fraction. We furthermore find that the stars' effective temperatures decrease with decreasing Rossby number as well, and that this temperature suppression balances the radius inflation so as to preserve the stellar bolometric luminosity. These relationships are consistent across the age range sampled here, which spans from the pre--main-sequence to the zero-age main sequence. The favorable comparison of our findings to the predictions of modern starspot-based stellar evolution models suggests that, while rotation is clearly the underlying driver, magnetism may be the most likely direct cause of the radius inflation phenomenon.
Figures


Figures from the paper (1 more)
Reference graph
Works this paper leans on
-
[1]
, " * write output.state after.block = add.period write newline
ENTRY address archivePrefix author booktitle chapter doi edition editor eprint howpublished institution journal key month note number organization pages publisher school series title misctitle type volume year version url label extra.label sort.label short.list INTEGERS output.state before.all mid.sentence after.sentence after.block FUNCTION init.state.co...
-
[2]
write newline
" write newline "" before.all 'output.state := FUNCTION format.doi doi empty "" "doi:" doi * if FUNCTION format.url url empty "" new.block "" url * "" * if FUNCTION format.eprint eprint empty "" archivePrefix empty "" archivePrefix ":" * if eprint field.or.null * if FUNCTION format.pid eprint empty format.doi format.eprint if FUNCTION n.dashify 't := "" t...
-
[3]
thebibliography [1] 20pt to REFERENCES 6pt =0pt \@twocolumntrue 12pt -12pt 10pt plus 3pt =0pt =0pt =1pt plus 1pt =0pt =0pt -12pt =13pt plus 1pt =20pt =13pt plus 1pt \@M =10000 =-1.0em =0pt =0pt 0pt =0pt =1.0em @enumiv\@empty 10000 10000 `\.\@m \@noitemerr \@latex@warning Empty `thebibliography' environment \@ifnextchar \@reference \@latexerr Missing key o...
arXiv 2017
-
[4]
2022, , 259, 35
Abdurro'uf , Accetta , K., Aerts , C., et al. 2022, , 259, 35
2022
-
[5]
Babusiaux , C., Fabricius , C., Khanna , S., et al. 2023, , 674, A32
work page 2023
- [6]
-
[7]
L., Oelkers , R
Beaton , R. L., Oelkers , R. J., Hayes , C. R., et al. 2021, , 162, 302
2021
- [8]
Show all 62 references
-
[9]
M., Garc \' a , R
Brown , T. M., Garc \' a , R. A., Mathur , S., Metcalfe , T. S., & Santos , \^A . R. G. 2021, , 916, 66
2021
-
[10]
Cao , L., & Pinsonneault , M. H. 2022, , 517, 2165
2022
-
[11]
H., Hillenbrand , L
Cao , L., Pinsonneault , M. H., Hillenbrand , L. A., & Kuhn , M. A. 2022, , 924, 84
2022
-
[12]
H., & van Saders , J
Cao , L., Pinsonneault , M. H., & van Saders , J. L. 2023, , 951, L49
2023
-
[13]
2007, , 472, L17
Chabrier , G., Gallardo , J., & Baraffe , I. 2007, , 472, L17
2007
-
[14]
Dahm , S. E. 2015, , 813, 108
2015
-
[15]
G., Mathieu , R
Dixon , D., Stassun , K. G., Mathieu , R. D., Tayar , J., & Cao , L. 2025, arXiv e-prints, arXiv:2504.05561
2025 arXiv
-
[16]
F., & Landstreet , J
Donati , J. F., & Landstreet , J. D. 2009, , 47, 333
2009
-
[17]
F., Cristofari , P
Donati , J. F., Cristofari , P. I., Finociety , B., et al. 2023, , 525, 455
2023
-
[18]
T., Curtis , J
Douglas , S. T., Curtis , J. L., Ag \"u eros , M. A., et al. 2019, , 879, 100
2019
-
[19]
Feiden , G. A. 2016, , 593, A99
2016
-
[20]
A., & Chaboyer , B
Feiden , G. A., & Chaboyer , B. 2013, , 779, 183
2013
-
[21]
2014, , 789, 53
---. 2014, , 789, 53
2014
-
[22]
W., Lang , D., & Goodman , J
Foreman-Mackey , D., Hogg , D. W., Lang , D., & Goodman , J. 2013, , 125, 306
2013
-
[23]
J., Barrado , D., Bouy , H., et al
Galindo-Guil , F. J., Barrado , D., Bouy , H., et al. 2022, , 664, A70
2022
-
[24]
A., Herczeg , G
Gully-Santiago , M. A., Herczeg , G. J., Czekala , I., et al. 2017, , 836, 200
2017
-
[25]
J., Deliyannis , C
Jackson , R. J., Deliyannis , C. P., & Jeffries , R. D. 2018, , 476, 3245
2018
-
[26]
J., & Jeffries , R
Jackson , R. J., & Jeffries , R. D. 2014 a , , 445, 4306
2014
-
[27]
2014 b , , 441, 2111
---. 2014 b , , 441, 2111
2014
-
[28]
J., Jeffries , R
Jackson , R. J., Jeffries , R. D., & Tognelli , E. 2025, , arXiv:2504.18265
2025 arXiv
-
[29]
J., Jeffries , R
Jackson , R. J., Jeffries , R. D., Randich , S., et al. 2016, , 586, A52
2016
-
[30]
Jaehnig , K., Somers , G., & Stassun , K. G. 2019, , 879, 39
2019
-
[31]
Z., Kochanek , C
Jayasinghe , T., Stanek , K. Z., Kochanek , C. S., et al. 2019, , 486, 1907
2019
-
[32]
V., Kiefer , R., & Metcalfe , T
Jeffers , S. V., Kiefer , R., & Metcalfe , T. S. 2023, , 219, 54
2023
-
[33]
2023, , 674, A5
Katz , D., Sartoretti , P., Guerrier , A., et al. 2023, , 674, A5
2023
-
[34]
A., Padgett , D
Koenig , X., Hillenbrand , L. A., Padgett , D. L., & DeFelippis , D. 2015, , 150, 100
2015
-
[35]
2023, AstroJacobLi/smplotlib: v0.0.9, vv0.0.9, Zenodo, doi:10.5281/zenodo.8126529
Li, J. 2023, AstroJacobLi/smplotlib: v0.0.9, vv0.0.9, Zenodo, doi:10.5281/zenodo.8126529. https://doi.org/10.5281/zenodo.8126529
2023 doi
-
[36]
2005, , 631, 1120
L \'o pez-Morales , M., & Ribas , I. 2005, , 631, 1120
2005
-
[37]
Macdonald , J., & Mullan , D. J. 2010, , 723, 1599
2010
-
[38]
Mathur , S., Santos , \^A . R. G., Claytor , Z. R., et al. 2025, , 982, 114
2025
-
[39]
C., Gallardo , J., Ribas , I., et al
Morales , J. C., Gallardo , J., Ribas , I., et al. 2010, , 718, 502
2010
-
[40]
J., & MacDonald , J
Mullan , D. J., & MacDonald , J. 2001, , 559, 353
2001
-
[41]
W., Hartmann , L
Noyes , R. W., Hartmann , L. W., Baliunas , S. L., Duncan , D. K., & Vaughan , A. H. 1984, , 279, 763
1984
-
[42]
Popper , D. M. 1997, , 114, 1195
1997
-
[43]
R., Lockwood , G
Radick , R. R., Lockwood , G. W., Henry , G. W., Hall , J. C., & Pevtsov , A. A. 2018, , 855, 75
2018
-
[44]
M., Stauffer , J
Rebull , L. M., Stauffer , J. R., Cody , A. M., et al. 2018, , 155, 196
2018
-
[45]
M., Stauffer , J
Rebull , L. M., Stauffer , J. R., Hillenbrand , L. A., et al. 2017, , 839, 92
2017
-
[46]
M., Stauffer , J
Rebull , L. M., Stauffer , J. R., Bouvier , J., et al. 2016, , 152, 113
2016
-
[47]
J., et al
Reiners , A., Shulyak , D., K \"a pyl \"a , P. J., et al. 2022, , 662, A41
2022
-
[48]
Somers , G., Cao , L., & Pinsonneault , M. H. 2020, , 891, 29
2020
-
[49]
Somers , G., & Pinsonneault , M. H. 2014, , 790, 72
2014
-
[50]
2015 a , , 449, 4131
---. 2015 a , , 449, 4131
2015
-
[51]
2015 b , , 807, 174
---. 2015 b , , 807, 174
2015
-
[52]
Somers , G., & Stassun , K. G. 2017, , 153, 101
2017
-
[53]
C., & Weiss , A
Spruit , H. C., & Weiss , A. 1986, , 166, 167
1986
-
[54]
G., Collins , K
Stassun , K. G., Collins , K. A., & Gaudi , B. S. 2017, , 153, 136
2017
-
[55]
G., Corsaro , E., Pepper , J
Stassun , K. G., Corsaro , E., Pepper , J. A., & Gaudi , B. S. 2018, , 155, 22
2018
-
[56]
G., Kratter , K
Stassun , K. G., Kratter , K. M., Scholz , A., & Dupuy , T. J. 2012, , 756, 47
2012
-
[57]
G., & Torres , G
Stassun , K. G., & Torres , G. 2016, , 152, 180
2016
-
[58]
2021, , 907, L33
---. 2021, , 907, L33
2021
-
[59]
G., Torres , G., Kounkel , M., et al
Stassun , K. G., Torres , G., Kounkel , M., et al. 2022, , 941, 125
2022
-
[60]
2002, , 567, 1140
Torres , G., & Ribas , I. 2002, , 567, 1140
2002
-
[61]
2023, , 951, 90
Wanderley , F., Cunha , K., Souto , D., et al. 2023, , 951, 90
2023
-
[62]
J., Drake , J
Wright , N. J., Drake , J. J., Mamajek , E. E., & Henry , G. W. 2011, , 743, 48
2011
Reviewed August 6, 2026 · model on record in the stance chip above.
Discussion (0). Continue with ORCID to comment.