REVIEW 3 major objections 6 minor 46 references
Transition of blue-core helicon discharge
T0 review · 3 major / 6 minor · reviewed 2026-08-05 · deepseek-v4-flash
Pith's one-line read At blue-core transition, argon plasma density jumps up by a factor of about 19 while electron temperature falls to about 23% of its previous value, marking a regime change rather than continued heating.
desk verdict Useful experimental transition data, but the EMS 'during transition' run is actually pre-transition, so the modeling section overreaches. read the letter →
The pith
A machine-rendered reading of the paper's core claim, the machinery that carries it, and where it could break.
The reading
What carries the argument
The carrying object is the blue-core transition itself, treated as a threshold event with two synchronized signatures: density multiplication and temperature collapse, quantified by on-axis jump ratios (ne ratio about 19.25, Te ratio about 0.23) and radial localization of the density profile. The numerical half is the EMS full-wave solver, a finite-difference solution of Faraday's and Ampère's laws with a cold-plasma dielectric tensor and a model half-turn helical antenna current, which converts measured ne(r) and Te(r) profiles into wave-field and power-absorption maps across the transition. This solver supplies the otherwise-unmeasured claim that wave-field structures and absorption change
What would settle it
Measure on-axis ne and Te with sub-millisecond time resolution while sweeping RF power through about 930 W: if density and temperature do not jump simultaneously in opposite directions, the central transition claim fails. A complementary check is a movable axial probe scan from z = 0 to 2 m; strong axial gradients would falsify the EMS field maps.
Extended reading notes
Core claim
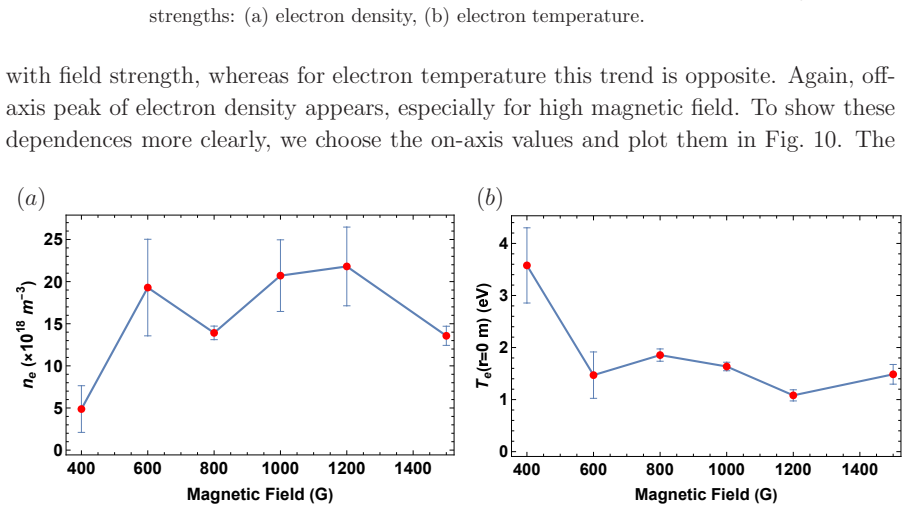
The paper's central claim is that the blue-core transition in MPS-LD is an abrupt, bidirectional regime change: at a threshold input power around 930 W (for 1000 and 1500 G, 0.19 Pa argon), the on-axis electron density sharply rises from low to high by a factor of about 19.25 while the electron temperature sharply falls to about 23% of its pre-transition value, and the density profile becomes localized near the axis with a slightly off-axis peak. The temperature drop is accompanied by a W-shaped radial profile that minimizes at the edge of the blue-core column. The paper further claims that higher magnetic field favors blue-core formation, raising density while lowering temperature; that den
Load-bearing premise
The numerical half of the paper stands on the assumption that the measured radial profiles at one axial position (z = 0.51 m) can be treated as axially uniform over the whole 2 m domain and that a radially averaged constant electron temperature represents the plasma; if axial variation or radial temperature structure matters, the computed wave fields and power absorption in Figs. 20 to 23 are not representative of the actual transition, even though the measured trends may sti
Editorial extensions
If this is right
- Operation of argon helicon sources in blue-core mode should be viewed as a density-multiplication and cooling transition rather than a heating increase; applications needing high flux should target the threshold conditions rather than simply raising power.
- The strong localization of density near the axis means edge and divertor material tests must account for a narrow, intense core with a relatively cool edge.
- Since blue-core plasmas show radial oscillations and azimuthal instabilities, time-averaged probe readings may hide coherent structure; diagnostics with fast temporal resolution are needed to characterize the true state.
- Because the EMS results show most power is absorbed under the antenna and wave fields differ between antenna and downstream, probe measurements at a single downstream location (z = 0.51 m) are not sufficient to infer global wave physics.
- The opposite power dependences of wave magnetic and electric fields imply that conclusions about coupling based on one field component alone can be misleading.
Reading between the lines
- A testable extension would be a two-dimensional (r,z) density and temperature map over the full 2 m domain to check the axial-uniformity assumption; if axial non-uniformity is significant, the EMS wave-field maps would need revision.
- The off-axis density peak and W-shaped temperature minimum may indicate a helically asymmetric or m = 1 mode structure; azimuthal probe arrays or imaging spectroscopy could test whether the transition locks to a particular azimuthal phase.
- If the transition is driven by neutral depletion and ionization runaway, then measuring neutral argon density (e.g., via ArI line ratios or laser absorption) across the threshold should show a sharp drop at blue-core onset, a prediction the paper does not make.
- The reported peak in temperature versus pressure suggests a collisional or resonance condition for optimal absorption; scanning pressure at fixed power and field while measuring wave fields could map this best-match condition more directly.
Editorial analysis
A structured set of objections, weighed in public.
Referee Report
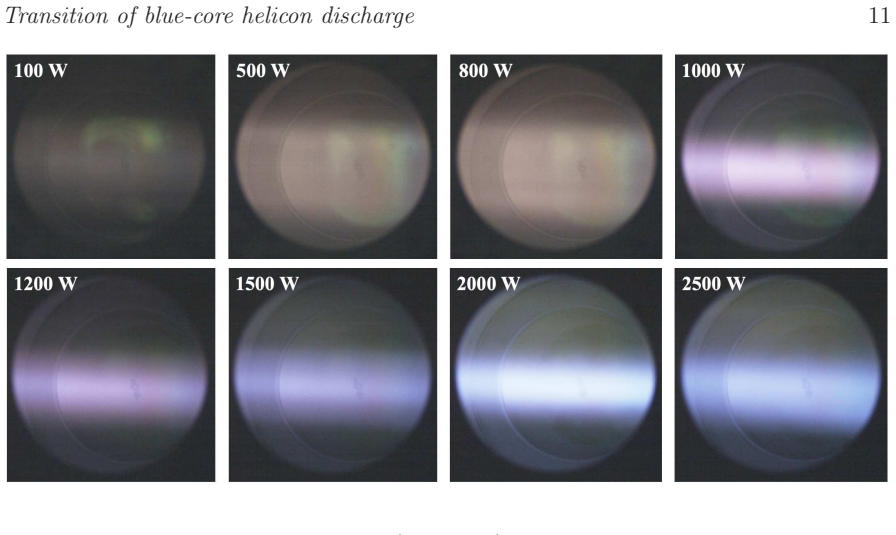
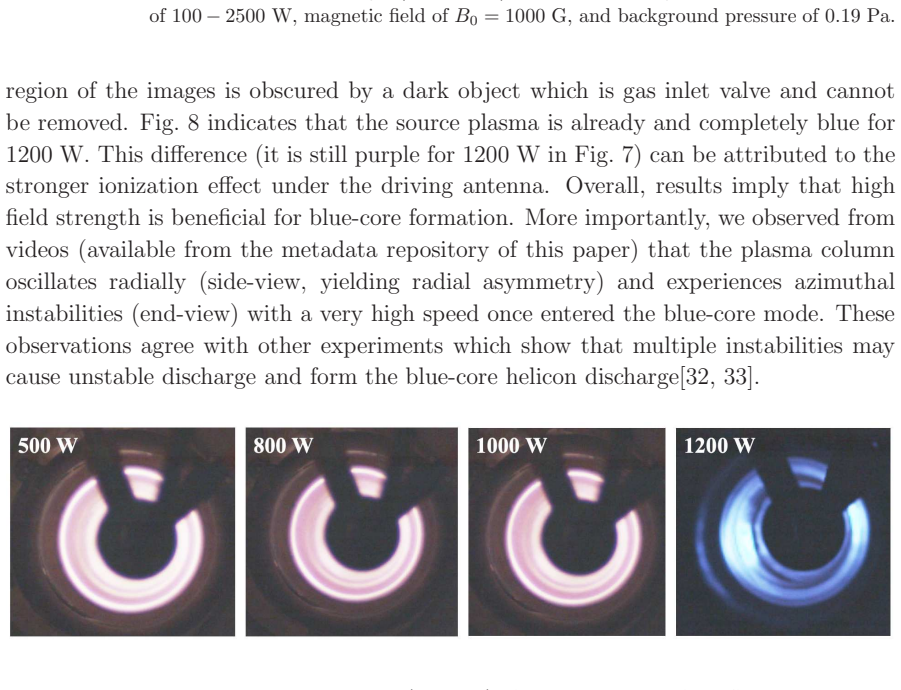
Summary. The paper presents an experimental and numerical characterization of the blue-core transition in the MPS-LD linear helicon device. Experimentally, the authors vary RF power, magnetic field, and background pressure, and use a Langmuir probe, OES, and high-speed imaging to document the transition. They report that the on-axis density jumps up by a factor of about 19.25 while the electron temperature drops by a factor of about 0.23, that the density profile becomes localized near the axis, that the temperature profile develops a 'W' shape, and that the blue-core column undergoes radial and azimuthal instabilities. Numerically, an electromagnetic solver (EMS) based on cold-plasma Maxwell equations is run for three power levels (890, 930, and 990 W) with fitted measured density and temperature profiles as inputs; the computed wave fields and power absorption are used to claim that wave-field structure changes during the transition and that the power dependences of the wave magnetic and electric fields are opposite.
Significance. The experimental part of this work is valuable: the transition from non-blue-core to blue-core mode is not often characterized in this detail on a single device, and the simultaneous density jump and temperature drop, together with the radial localization and observed instabilities, provide a useful dataset for the helicon community. The OES and imaging results add qualitative constraints on the transition. The numerical section is less compelling: because the EMS uses the measured density and temperature profiles as inputs, it cannot independently predict or explain the transition, and the choice of the 'during transition' case appears inconsistent with the experimental data shown. If the experimental trends withstand scrutiny, the paper is a solid characterization study; however, the numerical claims as presented need substantial revision.
major comments (3)
- [§4.2, Figs. 19–23] The EMS study labels 890 W as 'before', 930 W as 'during', and 990 W as 'after' the blue-core transition. However, Fig. 19(b1) shows that the 930 W density profile is essentially identical to the 890 W profile, with on-axis density around 0.5–1.5×10^18 m^-3, while the 990 W profile reaches about 50×10^18 m^-3. Consistently, Figs. 20–22 group the 890 W and 930 W results together. Thus the computation does not actually probe an intermediate or transitional state; it compares two pre-transition states and one post-transition state. The statement that wave fields change significantly 'during the transition' is therefore not supported by the numerical results as presented.
- [§4.2, Fig. 19] The EMS inputs are fitted ne(r) and Te(r) profiles measured at a single axial location (z=0.51 m), assumed uniform over z=0–2 m, with the measured Te profile replaced by a radially averaged constant and the off-axis density peak moved onto the axis. Since the computed wave fields and power absorption in Figs. 20–23 are direct outputs of these chosen profiles, the differences between 890 W and 990 W partly reflect input assumptions rather than a self-consistent prediction. The paper should either add sensitivity studies (e.g., varying the Te radial shape, checking axial-profile sensitivity) or explicitly reframe §4.3 as an illustrative computation. As it stands, the numerical conclusions are not load-bearing evidence for the transitional physics.
- [§3.1, Fig. 2] The paper reports a density jump ratio of about 19.25 and a temperature ratio of about 0.23, yet no error bars are shown in Fig. 2 and the stated 'errors below 10%' are not propagated into these ratios. Given that the quantitative jump ratios are part of the central claim, the authors should provide the measurement uncertainty or at least state the reproducibility bounds from the multiple collection averages mentioned in §2.2. This is needed to assess whether the quoted ratios are meaningful beyond the obvious qualitative jump.
minor comments (6)
- [§2.2] The Langmuir probe is described as both 'RF compensated' and a 'triple-probe system'; these are distinct techniques, and the RF-compensation mechanism should be clarified. Also, the 'errors below 10%' claim would benefit from a statement of what the error includes (random, systematic, spatial positioning).
- [Figures 9, 10, 14, 15] Several axis labels and symbols appear garbled in the preprint (e.g., Te units and radial coordinates). Please check the production files so that all axes are readable.
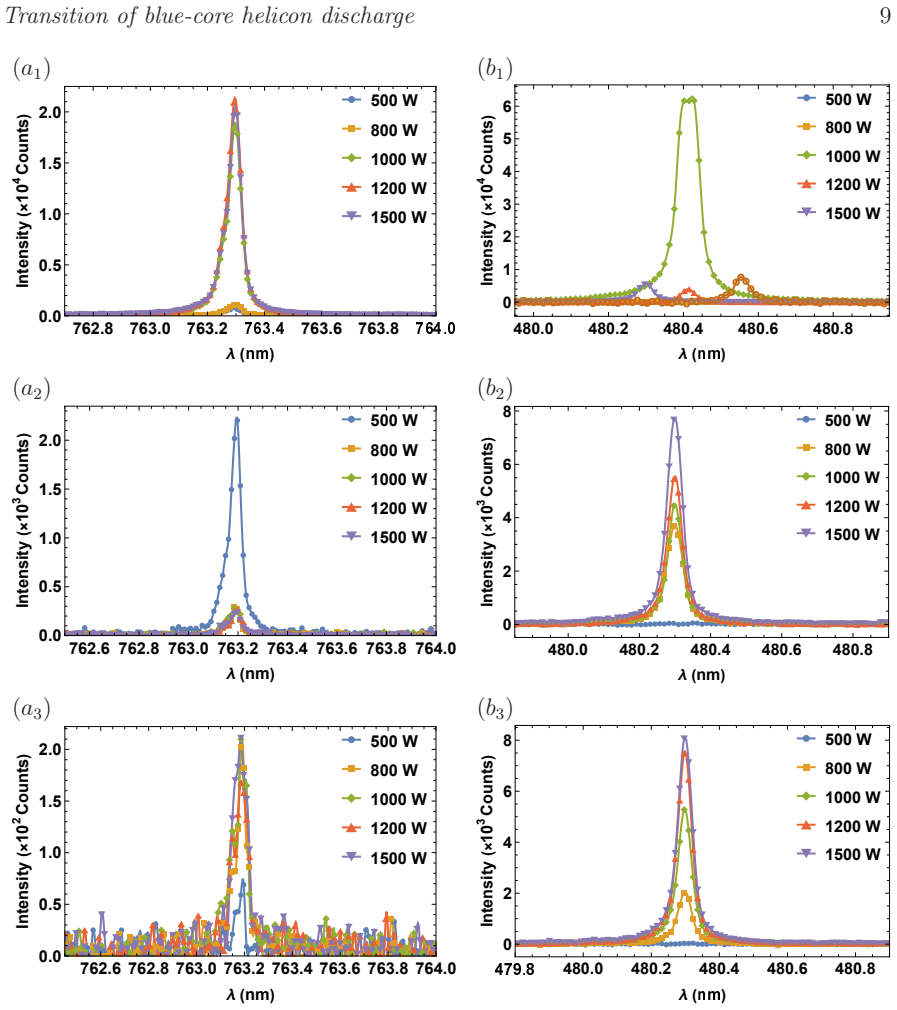
- [§3.1 and §3.3] The interpretation of OES intensities as direct measures of ion and atom density is oversimplified; ArI and ArII emission intensities also depend on excitation rates and electron temperature. Add a caveat or a brief justification.
- [§3.3, Fig. 14(b)] The claimed 'W' shape of the temperature profile is difficult to discern from the compressed radial scale. Please quantify the off-axis minima (radial locations and temperatures) or add an inset so the reader can verify the feature.
- [Data Availability, §3.1] The text states that high-speed videos are available from the metadata repository, but the Data Availability statement says data are available from the corresponding authors upon request. Please make these statements consistent.
- [Introduction and Conclusion] The phrase 'to our knowledge, it is the first research particularly focusing on the transition of blue-core helicon discharge' is a strong claim. It may be better to say 'we are not aware of a previous study focused specifically on this transition' and cite the related works already listed.
Circularity Check
EMS wave-field 'transition' is fed by the same ne/Te profiles whose jump defines the transition; experimental findings remain independent.
-
fitted input called prediction
[Sec. 4.2 (Input Parameters, Fig. 19) and Sec. 4.3 (Computed Results, Figs. 20-23)]
"The radial profiles of electron density and temperature for these three power levels are shown in Fig. 19 and input directly to the EMS code, i.e. fitted lines (solid and dashed) with the experimental data in Fig. 3(a) and Fig. 4(a). ... It can be seen that wave fields for 890 W and 930 W are similar but significantly different from that of 990 W."
The EMS result is presented as showing that the wave field 'changes significantly during the transition.' But the three cases are distinguished only by the measured ne(r) and Te(r) profiles that are directly input to the code in Sec. 4.2. A cold-plasma Maxwell solver is deterministic: if the input density jumps from ~1×10^18 m^-3 (890/930 W) to ~5×10^19 m^-3 (990 W) as in Fig. 19, the computed fields must differ. Thus the qualitative claim of a transition in the wave field is a propagation of the fitted input profiles, not an independent prediction. The detailed radial/axial structure and the opposite B/E power dependence are nontrivial computations, so the circularity is partial.
full rationale
The experimental sections (3.1-3.3) are self-contained: Langmuir probe, OES, and high-speed camera measurements stand on their own, with no fitted parameter renamed as a prediction. The EMS is a forward solution of Maxwell's equations with the cold-plasma dielectric tensor; the governing equations are given, so there is no load-bearing circular self-citation or imported uniqueness theorem. The only significant circularity concern is the presentation of the EMS computation as revealing 'transitional physics': the input ne(r) and Te(r) profiles are exactly the measured quantities that jump at the transition, so the before/after difference in the computed wave field is a projection of those inputs, not an independent test. This is a partial circularity because the field structure details are genuinely computed. Separately, the labeling of 930 W as 'during transition' appears inconsistent with Fig. 19(b1), which shows a low-density profile similar to 890 W; that is a representativeness/correctness concern, not a circularity, and does not affect the measured transition trends.
Assumptions & free parameters
free parameters (4)
- ne(r) and Te(r) fit profiles for 890 W, 930 W, 990 W =
fitted lines in Fig. 19, values not tabulated
- phenomenological collision frequency nu_alpha =
not given
- antenna current Ia =
set accordingly for each power case; value not stated
- axial and azimuthal mode numbers k, m =
not specified
assumptions (6)
- standard math Maxwell's equations describe the wave fields
- domain assumption Cold-plasma dielectric tensor with species collision frequencies is valid
- domain assumption Axial uniformity of plasma density and temperature over z=0 to 2 m
- domain assumption Electron temperature can be represented by a radially averaged constant in EMS
- domain assumption Langmuir triple-probe ne and Te are accurate to within 10%
- standard math Tangential electric field vanishes on conducting boundaries
Cite this review
Pith. "Pith review of Transition of blue-core helicon discharge." pith.science (2026). https://pith.science/paper/MWAGZ7CB
@misc{pith2026250819662,
  author       = {Pith},
  title        = {Pith review of: Transition of blue-core helicon discharge},
  year         = {2026},
  howpublished = {\url{https://pith.science/paper/MWAGZ7CB}},
  note         = {Machine review of arXiv:2508.19662}
}
read the original abstract
This study explores the transitional characteristics of blue-core helicon discharge, which to our knowledge was not particularly focused on before. Parameters are measured on recently built advanced linear plasma device, i.e. Multiple Plasma Simulation Linear Device (MPS-LD) by various diagnostics including Langmuir probe, optical emission spectrometer, and standard high-speed camera. It is found that the jump direction of electron density (from low level to high level) is opposite to that of electron temperature (from high level to low level). Electron density increases significantly and the radial profile becomes localized near the axis when the blue-core transition occurs. With increased field strength, electron density increases whereas electron temperature drops. The radial profile of electron temperature looks like a ``W" shape, i.e. minimizing around the edge of blue-core column. Electron density increases with background pressure, while electron temperature peaks around certain pressure value. High-speed videos show that the plasma column oscillates radially and experiences azimuthal instabilities with high rate once entered blue-core mode. An electromagnetic solver (EMS) based on Maxwell's equations and a cold-plasma dielectric tensor is also employed to compute the wave field and power absorption during blue-core transition, to provide more details that are valuable for understanding the transitional physics but not yet available in experiment. The results show that wave field in both radial and axial directions changes significantly during the transition, its structure differs from antenna to downstream, and the power dependence of wave magnetic field is overall opposite to that of wave electric field. This work presents comprehensive characteristics of the transitional blue-core discharge and is important to both physics understanding and practical applications.
Figures


Figures from the paper (20 more)





Reference graph
Works this paper leans on
-
[1]
R. W. Boswell. Plasma production using a standing helicon wave. Physics Letters A , 33(7):457–458, 1970
work page 1970
-
[2]
R. W. Boswell and F. F. Chen. Helicons-the early years. IEEE Transactions on Plasma Science , 25(6):1229–1244, 1997
work page 1997
-
[3]
F. F. Chen and R. W. Boswell. Helicons-the past decade. IEEE Transactions on Plasma Science, 25(6):1245–1257, 1997
work page 1997
-
[4]
Takuma Yamada, Sanae-I. Itoh, Takashi Maruta, Naohiro Kas uya, Yoshihiko Nagashima, Shunjiro Shinohara, Kenichiro Terasaka, Masatoshi Yagi, Shigeru Inagaki, Yoshinobu Kawai, Akihide Fujisawa, and Kimitaka Itoh. Anatomy of plasma turbulence. Nature Physics, 4(9):721–725, July 2008
work page 2008
-
[5]
F. F. Chen. Helicon discharges and sources: a review. Plasma Sources Science and Technology , 24(1):014001, 2015
work page 2015
- [6]
- [7]
-
[8]
High-Density Helicon Plasma Science: From Basics to Applic ations
Shunjiro Shinohara. High-Density Helicon Plasma Science: From Basics to Applic ations. Springer Nature Singapore, 2022
work page 2022
Show all 46 references
-
[9]
Chang, R
L. Chang, R. Boswell, and G. N. Luo. First helicon plasma physics an d applications workshop. Frontiers in Physics , 9:808971, 2022
2022
-
[10]
Chang, R
L. Chang, R. Boswell, E. Scime, S. Shinohara, K. Takahashi, S. T hakur, F. Filleul, A. Caldarelli, S. Isayama, Y. Yu, M. Xu, H. B. Zhang, T. Y. Huang, M. Y. Wu, J. T. Wu, B. H. Xia, L. F. Lu, A. P. Sun, D. Du, Z. Y. Zhang, R. X. Yuan, A. D. Xu, X. Yang, D. Jing, Y. Xia, C. Wan...
2024
-
[11]
Coupling between multiple co axial antennas surrounding a plasma column produced by helicon antenna
Lupeng Zhang, Lei Chang, Xiaogang Yuan, Yunju Chang, Jinhe ng Zhang, Xin Yang, Yong Wang, Haishan Zhou, and Guangnan Luo. Coupling between multiple co axial antennas surrounding a plasma column produced by helicon antenna. Contributions to Plasma Physics , 62(9), July 2022. Tr...
2022
-
[12]
Development of a compa ct high-density blue core helicon plasma device under 2000 g magnetic field of ring permane nt magnets
Zhikang LU, Guosheng XU, Chi-Shung YIP, Dehong CHEN, Xingqu an WU, Wei ZHANG, Guanghai HU, Chenyao JIN, and Di JIANG. Development of a compa ct high-density blue core helicon plasma device under 2000 g magnetic field of ring permane nt magnets. Plasma Science and Technology, 24...
2000
-
[13]
Development of a compact helic on plasma source with two sets of ring array permanent magnets for the study of blue co re plasma
Ying Xia, Xin Yang, Lei Chang, Hua Zhou, Jin-Heng Zhang, Dong J ing, Qian Xu, Guo-Jian Niu, Hai-Shan Zhou, and Guang-Nan Luo. Development of a compact helic on plasma source with two sets of ring array permanent magnets for the study of blue co re plasma. Review of Scientific I...
2023
-
[14]
Effect of neutral pressure on the blue core in ar helic on plasma under an inhomogeneous magnetic field
Chenwen W ANG, Yang LIU, Meng SUN, Tianliang ZHANG, Junfa XIE , Qiang CHEN, and Haibao ZHANG. Effect of neutral pressure on the blue core in ar helic on plasma under an inhomogeneous magnetic field. Plasma Science and Technology , 25(4):045403, February 2023
2023
-
[15]
Influence of species kinetics on discharge chara cteristics in oxygen helicon plasma
Tianliang Zhang, Zhangyu Xia, Ying Cui, Feng He, Zhongwei Liu, Ha ibao Zhang, Qiang Chen, and Jiting Ouyang. Influence of species kinetics on discharge chara cteristics in oxygen helicon plasma. Plasma Sources Science and Technology , 33(11):115017, November 2024
2024
-
[16]
Effects of cavity resonance and antenna resonance on mode transitions in helicon plasma
Tianliang Zhang, Ying Cui, Zhangyu Xia, Bocong Zheng, Feng He, a nd Jiting Ouyang. Effects of cavity resonance and antenna resonance on mode transitions in helicon plasma. Plasma Sources Science and Technology , 33(4):045016, April 2024
2024
-
[17]
The wave mode transition of argon helicon plasma
Ruilin Cui, Tianliang Zhang, Feng He, Bocong Zheng, and Jiting Ouya ng. The wave mode transition of argon helicon plasma. Plasma Sources Science and Technology , 33(2):025021, February 2024
2024
-
[18]
Rf antenna helicity dependent particle heating in a helico n source
K J Stevenson, T J Gilbert, T N Good, M Paul, P Shi, R Nirwan, P Sriva stav, T E Steinberger, and E E Scime. Rf antenna helicity dependent particle heating in a helico n source. Plasma Sources Science and Technology , 33(4):045009, April 2024
2024
-
[19]
J. Rapp, T. M. Biewer, T. S. Bigelow, J. B. O. Caughman, R. C. Du ckworth, R. J. Ellis, D. R. Giuliano, R. H. Goulding, D. L. Hillis, R. H. Howard, T. L. Lessard, J. D. Lore, A. Lumsdaine, E. J. Martin, W. D. McGinnis, S. J. Meitner, L. W. Owen, H. B. Ray, G. C. Shaw, and V. K...
2016
-
[20]
J. Rapp, C. Lau, A. Lumsdaine, C. J. Beers, T. S. Bigelow, T. M. Biewer, T. Boyd, J. F. Caneses, J. B. O. Caughman, R. Duckworth, R. H. Goulding, W. R. H icks, N. Kafle, P. A. Piotrowicz, and D. West. The materials plasma exposure eXperiment : Status of the physics basis togeth...
2020
-
[21]
F. R. Chang-Diaz. The vasimr rocket. Scientific American, 283(5):90–97, 2000
2000
-
[22]
G. Chen, A. V. Arefiev, R. D. Bengtson, B. N. Breizman, C. A. L ee, and L. L. Raja. Resonant power absorption in helicon plasma sources. Physics of Plasmas , 13(12):123507, 2006
2006
-
[23]
The design of multiple plasma s imulation linear device
Changjiang Sun;Chaofeng Sang;Hao Ye;Qi Wang;Hao Liu;Zhanhui W ang;Huajie Wang;Rui Ke;Yue Wang;Yanjie Zhang;Dezhen Wang. The design of multiple plasma s imulation linear device. Fusion Engineering and Design , 162(112074), 2021
2021
-
[24]
Experimental and simulation study of ar gon helicon discharge in multiple plasma simulation linear device (mps-ld)
Jintao Wu;Chaofeng Sang;Changjiang Sun;Bin Sun;Shuaishuai Gao ;Yu Bian;Yao Peng;Qi Wang;Dezhen Wang. Experimental and simulation study of ar gon helicon discharge in multiple plasma simulation linear device (mps-ld). Plasma Sources Sci. Technol. , 33(085007), 2024
2024
-
[25]
Spectroscopic invest igations of electron heating in a high-density helicon discharge
B Clarenbach, M Kr¨ amer, and B Lorenz. Spectroscopic invest igations of electron heating in a high-density helicon discharge. Journal of Physics D: Applied Physics , 40(17):5117–5129, August 2007
2007
-
[26]
Large-area helicon plasma source with permanent magnets
Francis F Chen and Humberto Torreblanca. Large-area helicon plasma source with permanent magnets. Plasma Physics and Controlled Fusion , 49(5A):A81–A93, March 2007
2007
-
[27]
Francis F. Chen. Performance of a permanent-magnet helicon source at 27 and 13 mhz. Physics of Plasmas , 19(9), 2012
2012
-
[28]
A novel antenna for sub-atmospheric radio-frequency discharge
Xinyue Hu, Lei Chang, Xiaogang Yuan, Xin Yang, Yunju Chang, L upeng Zhang, Haishan Zhou, Transition of blue-core helicon discharge 25 Guangnan Luo, Jia Dai, Jia Liu, and Guanrong Hang. A novel antenna for sub-atmospheric radio-frequency discharge. Contributions to Plasma Physi...
2020
-
[29]
X. G. Yuan, L. Chang, X. Y. Hu, X. Yang, H. S. Zhou, and G. N. L uo. Concept of SUb-atmospheric radio frequency engine (SURE) for near-space environment. IEEE Transactions on Plasma Science , 48(12):4326–4330, 2020
2020
-
[30]
Numerical study on the tempora l evolution of a helicon discharge
Yunju Chang, Lei Chang, Xiaogang Yuan, Xin Yang, Qian Xu, Yon g Wang, Guojian Niu, Haishan Zhou, and Guangnan Luo. Numerical study on the tempora l evolution of a helicon discharge. IEEE Transactions on Plasma Science , 49(11):3733–3744, nov 2021
2021
-
[31]
Relationship of mode trans itions and standing waves in helicon plasmas
Mingyang WU, Chijie XIAO, Xiaogang W ANG, Yue LIU, Min XU, Chang TAN, Tianchao XU, Xiuming YU, Renchuan HE, and Andong XU. Relationship of mode trans itions and standing waves in helicon plasmas. Plasma Science and Technology , 24(055002), 2022
2022
-
[32]
S. C. Thakur, C. Brandt, L. Cui, J. J. Gosselin, A. D. Light, and G. R. Tynan. Multi-instability plasma dynamics during the route to fully developed turbulence in a he licon plasma. Plasma Sources Science and Technology , 23(4):044006, 2014
2014
-
[33]
S. C. Thakur, C. Brandt, L. Cui, J. J. Gosselin, and G. R. Tynan . Formation of the blue core in argon helicon plasma. IEEE Transactions on Plasma Science , 43(8):2754–2759, 2015
2015
-
[34]
Chang, J
L. Chang, J. F. Caneses, and S. C. Thakur. Wave propagation and power deposition in blue-core helicon plasma. Frontiers in Physics , 10, October 2022
2022
-
[35]
Zhang, W
Y. Zhang, W. W. Heidbrink, H. Boehmer, R. McWilliams, G. Chen, B. N. Breizman, S. Vincena, T. Carter, D. Leneman, W. Gekelman, P. Pribyl, and B. Brugman. Sp ectral gap of shear Alfv´ en waves in a periodic array of magnetic mirrors. Physics of Plasmas , 15(1):012103, 2008
2008
-
[36]
C. A. Lee, G. Chen, A. V. Arefiev, R. D. Bengtson, and B. N. Br eizman. Measurements and modeling of radio frequency field structures in a helicon plasma. Physics of Plasmas , 18(1):013501, 2011
2011
-
[37]
Chang, M
L. Chang, M. J. Hole, J. F. Caneses, G. Chen, B. D. Blackwell, an d C. S. Corr. Wave modeling in a cylindrical non-uniform helicon discharge. Physics of Plasmas , 19(8):083511, 2012
2012
-
[38]
L. P. Zhang;L. Chang;X. G. Yuan;J. H. Zhang;H. S. Zhou;G. N. Luo . A rf plasma source with focused magnetic field for material treatment. Plasma Chemistry and Plasma Processing , 43:329–345, 2023
2023
-
[39]
V. L. Ginzburg. The propagation of electromagnetic waves in plasmas . Pergamon Press, second edition, 1970
1970
-
[40]
Compact h igh-density plasma source produced by using standing helicon waves
Mudtorlep Nisoa, Youichi Sakawa, and Tatsuo Shoji. Compact h igh-density plasma source produced by using standing helicon waves. Japanese Journal of Applied Physics , 38(7A):L777, 1999
1999
-
[41]
L. Chang. The impact of magnetic geometry on wave modes in cylindrical plasmas. PhD thesis, Australian National University, Canberra, 2014
2014
-
[42]
Chang, Q
L. Chang, Q. C. Li, H. J. Zhang, Y. H. Li, Y. Wu, B. L. Zhang, and Z. Zhuang. Effect of radial density configuration on wave field and energy flow in axially uniform he licon plasma. Plasma Science and Technology, 18(8):848–854, 2016
2016
-
[43]
L. Chang. Preliminary computation of the gap eigenmode of shea r alfv´ en waves on the LAPD. Chinese Physics B , 27(12):125201, 2018
2018
-
[44]
R. L. Wang, L. Chang, X. Y. Hu, L. L. Ping, N. Hu, X. M. Wu, J. Y. Yao, X. F. Sun, and T. P. Zhang. The role of second-order radial density gradient for helico n power absorption. Contributions to Plasma Physics , 59(9):e201900032, 2019
2019
-
[45]
Chang, J
L. Chang, J. Liu, X. G. Yuan, X. Yang, H. S. Zhou, G. N. Luo, X. J. Zhang, Y. K. Peng, J. Dai, and G. R. Hang. Helicon plasma in a magnetic shuttle. AIP Advances, 10(10):105114, 2020
2020
-
[46]
Wave field structure and power coupling features of blue-core helicon plasma driven by various antenna geometries and frequencies
Chao Wang, Jia Liu, Lei Chang, Ling-Feng Lu, Shi-Jie Zhang, and Fan-Tao Zhou. Wave field structure and power coupling features of blue-core helicon plasma driven by various antenna geometries and frequencies. Chinese Physics B , 33(3):035201, 2024
2024
Reviewed August 5, 2026 · model on record in the stance chip above.
Discussion (0). Continue with ORCID to comment.