Causal Variance Decompositions for Measuring Health Inequalities
Pith reviewed 2026-05-18 05:58 UTC · model grok-4.3
The pith
A new causal framework decomposes observed variance in healthcare outcomes into eight components to quantify sources of inequalities.
A machine-rendered reading of the paper's core claim, the machinery that carries it, and where it could break.
Core claim
The observed variance in outcomes is attributed to eight components that include the marginal effects of hospitals and groups plus novel terms for effect modification by sociodemographic membership, hospital access or selection, and the correlation between these heterogeneity sources, each carrying a causal interpretation under standard identification assumptions.
What carries the argument
Causal variance decomposition framework that partitions total outcome variance into eight additive components capturing direct effects, modification, selection, and correlations.
If this is right
- Quantifies the share of outcome variation due to hospital effects that differ across sociodemographic groups.
- Separates the contribution of differential hospital access or selection from treatment differences.
- Supports both model-based and nonparametric estimation of the eight terms.
- Applies directly to polytomous hospital and group settings common in health data.
- Enables decomposition of disparities in real datasets such as SEER cancer records.
Where Pith is reading between the lines
- The same variance decomposition could be applied to other multi-category settings such as schools and student subgroups.
- Policy work could use the components to prioritize interventions on access versus quality differences.
- Sensitivity analyses for unmeasured confounding would be needed before treating the components as fully causal.
Load-bearing premise
Standard identification assumptions such as conditional ignorability and positivity allow the eight variance components to be interpreted as reflecting causal modification, selection, and correlation.
What would settle it
In simulated data with known zero modification and selection, the corresponding variance components should estimate near zero; large nonzero estimates would indicate the decomposition fails to isolate those sources.
Figures


read the original abstract
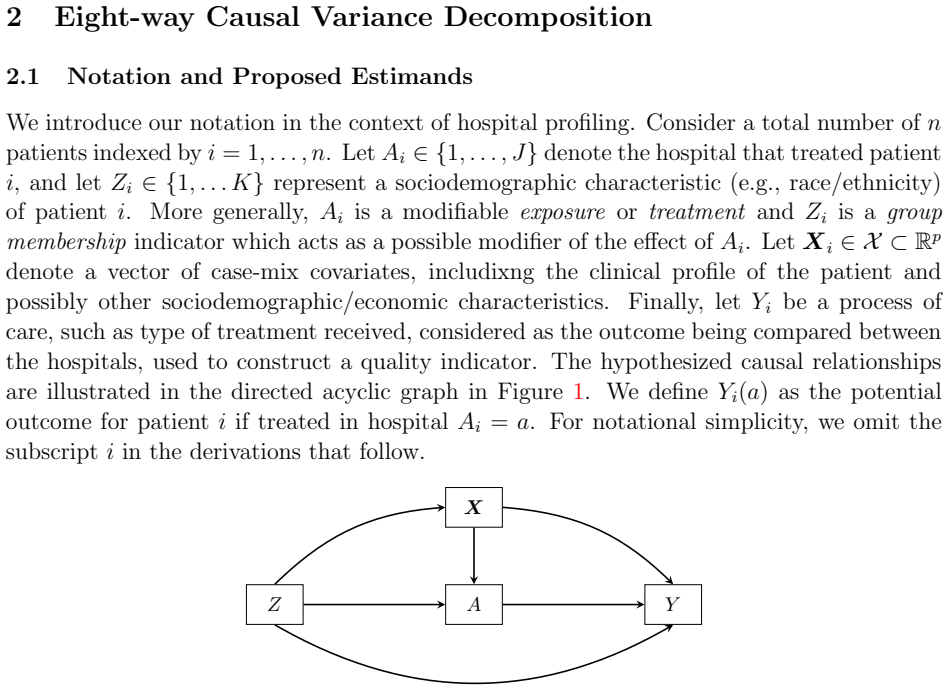
Recent causal inference literature has introduced causal effect decompositions to quantify sources of observed inequalities or disparities in outcomes, but these approaches are typically limited to pairwise comparisons. In healthcare delivery settings, both the exposure of interest-hospital or healthcare unit-and sociodemographic group membership may be polytomous, making pairwise contrasts inadequate. We therefore take the observed variance in care delivery outcomes as the quantity of interest and develop a new causal variance decomposition framework for this setting. The proposed framework attributes the observed variation to eight components, including novel terms characterizing modification of hospital effects by sociodemographic group membership, hospital access or selection, and the correlation between these two sources of heterogeneity. We discuss the causal interpretation of these components, propose both parametric and nonparametric model-based estimators, and study their performance through simulation. Finally, we illustrate the method using data from the SEER program in an application to cervical cancer care delivery.
Editorial analysis
A structured set of objections, weighed in public.
Referee Report
Summary. The manuscript develops a causal variance decomposition framework to attribute observed variation in care delivery outcomes to eight components in settings where both hospital units and sociodemographic groups are polytomous. It introduces novel terms for effect modification of hospital effects by group membership, hospital access/selection, and the correlation between these sources of heterogeneity. The authors discuss causal interpretations under standard assumptions, propose parametric and nonparametric estimators, evaluate performance in simulations, and illustrate the method with SEER data on cervical cancer care delivery.
Significance. If the identification strategy and estimators are shown to be valid, the framework extends pairwise causal decompositions to a variance-based attribution that can handle multi-category exposures and groups, potentially aiding nuanced analysis of health inequalities. The simulation study and empirical application are positive features that ground the method, though the distinct value of the new correlation term relative to existing variance decompositions remains to be fully demonstrated.
major comments (3)
- [§3] §3 (Causal Interpretation): The formal statement and extension of conditional ignorability (no unmeasured confounding) to the joint polytomous distribution of hospital assignment and sociodemographic group is not provided; without explicit counterfactual definitions isolating the novel correlation term, it is unclear whether this component carries independent causal meaning or reduces to associational quantities.
- [§4] §4 (Estimation): The nonparametric estimator invokes positivity over the joint support of hospital and group indicators, but no discussion addresses how this is maintained or diagnosed when the number of hospitals is large and sociodemographic strata are sparse; violation for even one stratum would undermine causal attribution to the modification-selection-correlation terms.
- [§5, Table 1] Simulation study (§5, Table 1): Scenarios do not include violations of the identification assumptions (e.g., unmeasured confounding between outcome, hospital, and group); this limits the ability to assess whether the eight-component attribution remains reliable when the causal claims are stressed.
minor comments (2)
- [Abstract] Abstract: The eight components are referenced but not enumerated; adding a short list would clarify the scope for readers.
- [§2] Notation: The distinction between observed variance and counterfactual variance components could be made more explicit in the main equations to avoid potential confusion with standard ANOVA decompositions.
Simulated Author's Rebuttal
We thank the referee for their constructive comments, which help clarify important aspects of the causal variance decomposition. We respond to each major comment below and indicate planned revisions.
read point-by-point responses
-
Referee: [§3] §3 (Causal Interpretation): The formal statement and extension of conditional ignorability (no unmeasured confounding) to the joint polytomous distribution of hospital assignment and sociodemographic group is not provided; without explicit counterfactual definitions isolating the novel correlation term, it is unclear whether this component carries independent causal meaning or reduces to associational quantities.
Authors: We agree that greater formality would strengthen the presentation. In the revision we will add an explicit statement of the conditional ignorability assumption extended to the joint distribution of hospital assignment and sociodemographic group. We will also supply counterfactual definitions for all eight components that isolate the correlation term, showing that it represents the counterfactual covariance between group-specific hospital effects and group-specific selection probabilities and therefore retains independent causal content under the maintained assumptions. revision: yes
-
Referee: [§4] §4 (Estimation): The nonparametric estimator invokes positivity over the joint support of hospital and group indicators, but no discussion addresses how this is maintained or diagnosed when the number of hospitals is large and sociodemographic strata are sparse; violation for even one stratum would undermine causal attribution to the modification-selection-correlation terms.
Authors: The referee correctly notes a practical gap. We will revise §4 to discuss the positivity requirement for the joint support, including diagnostics (e.g., empirical support checks and overlap plots) and remedies such as trimming or sensitivity analyses when strata are sparse or the number of hospitals is large. These additions will directly address the risk that positivity violations could affect attribution to the modification, selection, and correlation terms. revision: yes
-
Referee: [§5, Table 1] Simulation study (§5, Table 1): Scenarios do not include violations of the identification assumptions (e.g., unmeasured confounding between outcome, hospital, and group); this limits the ability to assess whether the eight-component attribution remains reliable when the causal claims are stressed.
Authors: We accept that the current simulations evaluate performance only under correct specification. In the revised version we will augment the simulation study with scenarios that introduce unmeasured confounding between the outcome, hospital assignment, and sociodemographic group. These new scenarios will quantify the sensitivity of the eight-component decomposition and thereby demonstrate the conditions under which the attribution remains reliable. revision: yes
Circularity Check
No significant circularity in causal variance decomposition framework
full rationale
The paper constructs a new causal variance decomposition that attributes observed outcome variation to eight components derived from standard causal models under conditional ignorability and positivity. No derivation step reduces by construction to fitted parameters renamed as predictions, self-citations that bear the central load, or ansatzes imported from prior author work. The novel terms for effect modification, hospital selection, and their correlation follow directly from the polytomous causal structure and counterfactual definitions rather than tautological re-expression of inputs. The framework is self-contained against external benchmarks in causal inference literature, with estimators proposed and evaluated via simulation independent of the target application data.
Axiom & Free-Parameter Ledger
axioms (1)
- domain assumption Standard causal identification assumptions including conditional ignorability and positivity hold so that variance components can be interpreted as causal quantities.
Lean theorems connected to this paper
-
IndisputableMonolith/Foundation/RealityFromDistinction.leanreality_from_one_distinction unclear?
unclearRelation between the paper passage and the cited Recognition theorem.
we propose a causal variance decomposition approach... eight-way causal variance decomposition... (1) Group indirect effect (2) Group direct effect (3) Group covariance (4) Main hospital effect (5) Effect modification (6) Differential selection (7) Case-mix (8) Residual
-
IndisputableMonolith/Cost/FunctionalEquation.leanwashburn_uniqueness_aczel unclear?
unclearRelation between the paper passage and the cited Recognition theorem.
Under the previously mentioned consistency and conditional exchangeability assumptions, as well as positivity assumption P(A=a|Z=z,X=x)>0
What do these tags mean?
- matches
- The paper's claim is directly supported by a theorem in the formal canon.
- supports
- The theorem supports part of the paper's argument, but the paper may add assumptions or extra steps.
- extends
- The paper goes beyond the formal theorem; the theorem is a base layer rather than the whole result.
- uses
- The paper appears to rely on the theorem as machinery.
- contradicts
- The paper's claim conflicts with a theorem or certificate in the canon.
- unclear
- Pith found a possible connection, but the passage is too broad, indirect, or ambiguous to say the theorem truly supports the claim.
Reference graph
Works this paper leans on
-
[1]
Paula A Braveman, Shiriki Kumanyika, Jonathan Fielding, Thomas LaVeist, Luisa N Borrell, Ron Manderscheid, and Adewale Troutman. Health disparities and health eq- uity: the issue is justice.American journal of public health, 101(S1):S149–S155, 2011
work page 2011
-
[2]
Kevin Fiscella and Mechelle R Sanders. Racial and ethnic disparities in the quality of health care.Annual review of public health, 37(1):375–394, 2016
work page 2016
-
[3]
John W Jackson. Meaningful causal decompositions in health equity research: definition, identification, and estimation through a weighting framework.Epidemiology, 32(2):282– 290, 2021
work page 2021
-
[4]
Soojin Park, Suyeon Kang, and Chioun Lee. Choosing an optimal method for causal decomposition analysis: A better practice for identifying contributing factors to health disparities.arXiv preprint arXiv:2109.06940, 2021
-
[5]
Nonparametric causal decomposition of group disparities
Ang Yu and Felix Elwert. Nonparametric causal decomposition of group disparities. The Annals of Applied Statistics, 19(1):821–845, 2025
work page 2025
- [6]
-
[7]
Sharon-Lise T Normand, Mark E Glickman, and Constantine A Gatsonis. Statistical methods for profiling providers of medical care: issues and applications.Journal of the American Statistical Association, 92(439):803–814, 1997
work page 1997
-
[8]
On shrinkage and model extrapolation in the evaluation of clinical center performance
Machteld Varewyck, Els Goetghebeur, Marie Eriksson, and Stijn Vansteelandt. On shrinkage and model extrapolation in the evaluation of clinical center performance. Biostatistics, 15(4):651–664, 2014
work page 2014
-
[9]
Katherine Daignault and Olli Saarela. Doubly robust estimator for indirectly standard- ized mortality ratios.Epidemiologic methods, 6(1):20160016, 2017
work page 2017
-
[10]
Causal medi- ation analysis for standardized mortality ratios.Epidemiology, 30(4):532–540, 2019
Katherine Daignault, Keith A Lawson, Antonio Finelli, and Olli Saarela. Causal medi- ation analysis for standardized mortality ratios.Epidemiology, 30(4):532–540, 2019
work page 2019
-
[11]
Nicholas Hartman and Claudia Dahlerus. Evaluating medical providers in terms of pa- tient health disparities: a statistical framework.Health Services and Outcomes Research Methodology, 24(4):440–457, 2024
work page 2024
-
[12]
Bo Chen, Keith A Lawson, Antonio Finelli, and Olli Saarela. Causal variance decom- positions for institutional comparisons in healthcare.Statistical methods in medical research, 29(7):1972–1986, 2020
work page 1972
-
[13]
Bo Chen, Kristen McAlpine, Keith A Lawson, Antonio Finelli, and Olli Saarela. Hi- erarchical causal variance decomposition for institution and provider comparisons in healthcare.Health Services and Outcomes Research Methodology, 23(4):391–415, 2023. 22
work page 2023
-
[14]
Bo Chen, Keith A Lawson, Antonio Finelli, and Olli Saarela. Causal mediation analysis decomposition of between-hospital variance.Health Services and Outcomes Research Methodology, pages 1–27, 2022
work page 2022
-
[15]
Tyler J VanderWeele, Stijn Vansteelandt, and James M Robins. Effect decomposition in the presence of an exposure-induced mediator-outcome confounder.Epidemiology, 25 (2):300–306, 2014
work page 2014
-
[16]
Philipp Probst, Marvin N Wright, and Anne-Laure Boulesteix. Hyperparameters and tuning strategies for random forest.Wiley Interdisciplinary Reviews: data mining and knowledge discovery, 9(3):e1301, 2019
work page 2019
-
[17]
Surveillance, epidemiology, and end results (SEER) program
National Cancer Institute. Surveillance, epidemiology, and end results (SEER) program. https://seer.cancer.gov/, 2025. Accessed: 2025-08-13
work page 2025
-
[18]
Benjamin F Hankey, Lynn A Ries, and Brenda K Edwards. The surveillance, epidemi- ology, and end results program: a national resource.Cancer Epidemiology Biomarkers & Prevention, 8(12):1117–1121, 1999
work page 1999
-
[19]
Kathy Han, Darien Colson-Fearon, Zhihui Amy Liu, and Akila N Viswanathan. Updated trends in the utilization of brachytherapy in cervical cancer in the united states: A surveillance, epidemiology, and end-results study.International Journal of Radiation Oncology* Biology* Physics, 119(1):143–153, 2024
work page 2024
-
[20]
Linda Valeri, Cecile Proust-Lima, Weijia Fan, Jarvis T Chen, and Helene Jacqmin- Gadda. A multistate approach for the study of interventions on an intermediate time- to-event in health disparities research.Statistical methods in medical research, 32(8): 1445–1460, 2023
work page 2023
-
[21]
Ashley I Naimi, Mireille E Schnitzer, Erica EM Moodie, and Lisa M Bodnar. Mediation analysis for health disparities research.American journal of epidemiology, 184(4):315– 324, 2016
work page 2016
-
[22]
Simulating counterfactuals.Journal of Artificial Intelligence Research, 80:835–857, 2024
Juha Karvanen, Santtu Tikka, and Matti Vihola. Simulating counterfactuals.Journal of Artificial Intelligence Research, 80:835–857, 2024
work page 2024
-
[23]
A novel measure of effect size for mediation analysis.Psychological methods, 23(2):244, 2018
Mark J Lachowicz, Kristopher J Preacher, and Ken Kelley. A novel measure of effect size for mediation analysis.Psychological methods, 23(2):244, 2018
work page 2018
-
[24]
Bayesian mediation analysis.Psychological meth- ods, 14(4):301, 2009
Ying Yuan and David P MacKinnon. Bayesian mediation analysis.Psychological meth- ods, 14(4):301, 2009
work page 2009
-
[25]
Victor Chernozhukov, Denis Chetverikov, Mert Demirer, Esther Duflo, Christian Hansen, Whitney Newey, and James Robins. Double/debiased machine learning for treatment and structural parameters.The Econometrics Journal, 21(1):C1–C68, 2018
work page 2018
-
[26]
Alan Yiu, Edwin Fong, Chris Holmes, and Judith Rousseau. Semiparametric posterior corrections.Journal of the Royal Statistical Society Series B: Statistical Methodology, page qkaf005, 2025. 23
work page 2025
-
[27]
Kyunghwa Han and Inkyung Jung. Restricted mean survival time for survival analysis: a quick guide for clinical researchers.Korean Journal of Radiology, 23(5):495, 2022
work page 2022
-
[28]
Dominique Muller, Charles M Judd, and Vincent Y Yzerbyt. When moderation is mediated and mediation is moderated.Journal of personality and social psychology, 89 (6):852, 2005
work page 2005
-
[29]
Mohammad Kaviul Anam Khan, Olli Saarela, and Rafal Kustra. Marginal and condi- tional importance measures from machine learning models and their relationship with conditional average treatment effect.arXiv preprint arXiv:2501.16988, 2025
-
[30]
µ(z, z,X)− X z∗ µ(z, z∗,X)P(Z=z ∗ |X) # P(Z=z|X) = X z
Judea Pearl.Causality. Cambridge university press, 2009. 24 Appendix A Proof of Equation(2) The variance ofY(A) conditional on the vector of case-mix covariatesXcan be expressed using the law of total variance conditioning onZas follows: V[Y(A)|X] =V Z|X [E(Y(A)|Z,X)] +E Z|X [V(Y(A)|Z,X)].(11) The inner expectation in the first term of Equation (11) can b...
work page 2009
discussion (0)
Sign in with ORCID, Apple, or X to comment. Anyone can read and Pith papers without signing in.