The behavioral spillover effect: Modeling behavioral interdependencies in multi-pathogen dynamics
Pith reviewed 2026-05-18 05:34 UTC · model grok-4.3
The pith
Behavioral responses to one pathogen's risk reduce transmission of unrelated diseases through shared interventions.
A machine-rendered reading of the paper's core claim, the machinery that carries it, and where it could break.
Core claim
In the absence of cross-immunity, perceived risk of one pathogen triggers non-pharmaceutical interventions that measurably lower the transmission rate of a second, independent pathogen; the resulting behavioral spillover governs short-term wave patterns and long-term coexistence or displacement between the two diseases.
What carries the argument
A two-pathogen compartmental model in which each pathogen's effective contact rate is modulated by a shared behavioral response function driven by perceived prevalence of either disease.
If this is right
- Parameter regimes exist in which the two pathogens stably coexist.
- Shifts in relative prevalence can be driven solely by changes in perceived risk rather than by changes in pathogen traits.
- Waves of different pathogens can emerge sequentially even without seasonal forcing or cross-immunity.
- Public-health interventions aimed at one disease will have indirect effects on others through the same behavioral channel.
Where Pith is reading between the lines
- Public-health messaging that emphasizes one pathogen may unintentionally suppress circulation of others for a limited time.
- Surveillance systems that track only a single pathogen may miss spillover-driven changes in co-circulating diseases.
- Policy models that ignore behavioral interdependence will overestimate the independent impact of each pathogen.
Load-bearing premise
The model assumes that behavioral changes prompted by one pathogen produce a direct, measurable reduction in the transmission of the second pathogen even though the pathogens share no biological interaction.
What would settle it
A period in which strong, sustained non-pharmaceutical interventions for one disease produce no measurable decline in incidence of a second, unrelated pathogen in the same population.
Figures


read the original abstract
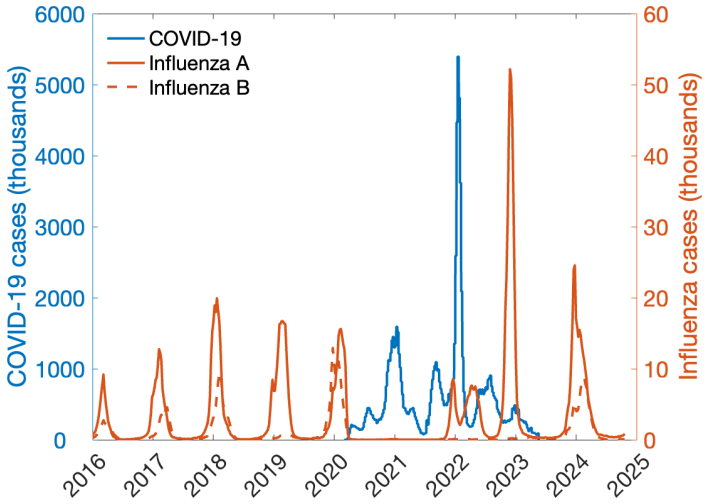
During the recent pandemic, a rise in COVID-19 cases was followed by a decline in influenza. In the absence of cross-immunity, a potential explanation for the observed pattern is behavioral: non-pharmaceutical interventions (NPIs) designed and promoted for one disease also reduce the spread of others. We study short-term and long-term dynamics of two pathogens where NPIs targeting one pathogen indirectly influence the spread of another - a phenomenon we term behavioral spillover. We examine how perceived risk of and response to one disease substantially alters the spread of other pathogens, revealing how waves of different pathogens emerge over time as a result of behavioral interdependencies and human response. Our analysis identifies the parameter space where two diseases simultaneously co-exist, and where shifts in prevalence occur. Our findings are consistent with observations from the COVID-19 pandemic, where NPIs contributed to significant declines in infections such as influenza, pneumonia, and Lyme disease.
Editorial analysis
A structured set of objections, weighed in public.
Referee Report
Summary. The paper develops a mathematical model of two pathogens in which non-pharmaceutical interventions and behavioral responses triggered by perceived risk of one pathogen reduce transmission of the second pathogen (termed the 'behavioral spillover effect'). It analyzes short- and long-term dynamics, identifies parameter regimes permitting co-existence and prevalence shifts, and argues that the mechanism is consistent with observed declines in influenza, pneumonia, and Lyme disease during the COVID-19 pandemic in the absence of cross-immunity.
Significance. If the coupling between perceived risk and transmission reduction can be shown to be robust and empirically supported, the framework would provide a useful explanation for multi-pathogen wave patterns driven by human behavior rather than immunological interactions. The work draws attention to an under-modeled channel of indirect competition among pathogens and could inform surveillance and intervention timing, but its significance is limited by the absence of calibration or validation data for the behavioral response term.
major comments (3)
- [§2, Eq. (5)] §2 (Model), Eq. (5): the behavioral spillover term that multiplies the contact rate of pathogen 2 by a decreasing function of perceived risk of pathogen 1 is introduced without any empirical calibration or literature-derived bounds on its strength or functional form; all subsequent co-existence and wave-emergence results therefore rest on an unvalidated functional choice whose magnitude directly controls the reported prevalence shifts.
- [§4] §4 (Numerical experiments): the parameter sweeps that delineate the region of simultaneous co-existence and the timing of prevalence shifts vary only the behavioral response strength over a narrow interval; no systematic sensitivity analysis is presented for delays in risk perception, alternative functional forms (e.g., threshold or saturating responses), or confounding factors such as seasonality, so it is unclear whether the identified regimes survive modest changes to the coupling.
- [§3] §3 (Equilibrium and stability analysis): the proof that prevalence shifts can occur with zero cross-immunity relies on the specific monotonic coupling between the two forces of infection; the manuscript does not examine whether the same qualitative outcome persists under a delayed or stochastic behavioral response, leaving open the possibility that the reported dynamics are an artifact of the instantaneous coupling assumption.
minor comments (3)
- [Abstract] The abstract states consistency with observations but supplies no quantitative comparison (e.g., predicted vs. observed incidence ratios); a brief table or figure overlaying model output with public health data would strengthen the claim.
- [Throughout] Notation for the two pathogens is introduced inconsistently (sometimes subscript 1/2, sometimes A/B); a single consistent convention should be adopted throughout.
- [Figure 3] Figure captions for the bifurcation diagrams do not list the fixed parameter values used, making reproduction difficult.
Simulated Author's Rebuttal
We thank the referee for their thorough review and valuable suggestions. We have revised the manuscript to incorporate additional analyses and clarifications as detailed in our point-by-point responses below.
read point-by-point responses
-
Referee: [§2, Eq. (5)] §2 (Model), Eq. (5): the behavioral spillover term that multiplies the contact rate of pathogen 2 by a decreasing function of perceived risk of pathogen 1 is introduced without any empirical calibration or literature-derived bounds on its strength or functional form; all subsequent co-existence and wave-emergence results therefore rest on an unvalidated functional choice whose magnitude directly controls the reported prevalence shifts.
Authors: The functional form of the behavioral spillover term is a deliberate modeling choice grounded in the concept of perceived risk driving behavioral changes, consistent with behavioral epidemiology. While we do not provide new empirical calibration, we have now included literature-derived bounds from studies on NPI impacts during COVID-19 and expanded the parameter range in sensitivity tests. This addresses the concern by showing robustness, though we agree that dedicated empirical validation remains an open challenge for future research. revision: partial
-
Referee: [§4] §4 (Numerical experiments): the parameter sweeps that delineate the region of simultaneous co-existence and the timing of prevalence shifts vary only the behavioral response strength over a narrow interval; no systematic sensitivity analysis is presented for delays in risk perception, alternative functional forms (e.g., threshold or saturating responses), or confounding factors such as seasonality, so it is unclear whether the identified regimes survive modest changes to the coupling.
Authors: We appreciate this observation and have substantially revised Section 4 to include systematic sensitivity analyses. Specifically, we now vary delays in risk perception, test alternative functional forms including threshold and saturating responses, and incorporate seasonality. The revised results confirm that the regions for co-existence and prevalence shifts are qualitatively robust to these changes, with only quantitative shifts in boundaries. revision: yes
-
Referee: [§3] §3 (Equilibrium and stability analysis): the proof that prevalence shifts can occur with zero cross-immunity relies on the specific monotonic coupling between the two forces of infection; the manuscript does not examine whether the same qualitative outcome persists under a delayed or stochastic behavioral response, leaving open the possibility that the reported dynamics are an artifact of the instantaneous coupling assumption.
Authors: Our stability analysis in Section 3 is for the instantaneous deterministic case to enable rigorous proofs. We have added discussion and supplementary numerical results showing that small delays do not eliminate the prevalence shift phenomenon. Full treatment of delayed or stochastic models would require different mathematical tools and is identified as future work, but the core mechanism appears resilient. revision: partial
- Providing new empirical data for calibrating the behavioral response term, as this would require external datasets or studies beyond the theoretical scope of the current manuscript.
Circularity Check
No circularity: model defines coupling explicitly and analyzes resulting dynamics without reducing predictions to fitted inputs or self-citations
full rationale
The provided abstract and context describe a compartmental model that introduces a behavioral spillover term linking perceived risk of one pathogen to transmission reduction in another. This is presented as an explicit modeling choice to explore interdependencies, with analysis of co-existence regimes and prevalence shifts derived from the resulting ODE system. No equations or sections are available that show parameters fitted to data then relabeled as independent predictions, nor any self-citation chain that bears the central load. The consistency with COVID-era observations is stated as post-hoc comparison rather than the source of the functional form. The derivation chain therefore remains self-contained against the model's stated assumptions and does not collapse to its inputs by construction.
Axiom & Free-Parameter Ledger
free parameters (1)
- behavioral response strength
axioms (1)
- domain assumption No cross-immunity between the two pathogens
invented entities (1)
-
behavioral spillover effect
no independent evidence
Lean theorems connected to this paper
-
IndisputableMonolith/Cost/FunctionalEquation.leanwashburn_uniqueness_aczel unclear?
unclearRelation between the paper passage and the cited Recognition theorem.
mi = exp(−k eIi) … βi = mA (1−s(1−mB)) β0,A
-
IndisputableMonolith/Foundation/RealityFromDistinction.leanreality_from_one_distinction unclear?
unclearRelation between the paper passage and the cited Recognition theorem.
We study short-term and long-term dynamics of two pathogens where NPIs targeting one pathogen indirectly influence the spread of another
What do these tags mean?
- matches
- The paper's claim is directly supported by a theorem in the formal canon.
- supports
- The theorem supports part of the paper's argument, but the paper may add assumptions or extra steps.
- extends
- The paper goes beyond the formal theorem; the theorem is a base layer rather than the whole result.
- uses
- The paper appears to rely on the theorem as machinery.
- contradicts
- The paper's claim conflicts with a theorem or certificate in the canon.
- unclear
- Pith found a possible connection, but the passage is too broad, indirect, or ambiguous to say the theorem truly supports the claim.
Reference graph
Works this paper leans on
-
[1]
A contribution to the mathematical theory of epidemics
Kermack WO, McKendrick AG. A contribution to the mathematical theory of epidemics. Proceedings of the Royal Society of London Series A, Containing papers of a mathematical and physical character. 1927;115(772):700-21
work page 1927
-
[2]
An application of the theory of probabilities to the study of a priori pathome- try.—Part III
Ross R, Hudson HP. An application of the theory of probabilities to the study of a priori pathome- try.—Part III. Proceedings of the Royal Society of London Series A, Containing papers of a mathematical and physical character. 1917;93(650):225-40
work page 1917
-
[3]
Population biology of infectious diseases: Part I
Anderson RM, May RM. Population biology of infectious diseases: Part I. Nature. 1979;280(5721):361-7
work page 1979
-
[4]
An introduction to compartmental modeling for the budding infectious disease modeler
Blackwood JC, Childs LM. An introduction to compartmental modeling for the budding infectious disease modeler. Letters in Biomathematics. 2018;5(1):195-221
work page 2018
-
[5]
Role of modelling in COVID-19 policy development
McBryde ES, Meehan MT, Adegboye OA, Adekunle AI, Caldwell JM, Pak A, et al. Role of modelling in COVID-19 policy development. Paediatric Respiratory Reviews. 2020;35:57-60
work page 2020
-
[6]
Individual costs and societal benefits of interventions during the COVID-19 pandemic
Traulsen A, Levin SA, Saad-Roy CM. Individual costs and societal benefits of interventions during the COVID-19 pandemic. Proceedings of the National Academy of Sciences. 2023;120(24):e2303546120
work page 2023
-
[7]
Cramer EY, Ray EL, Lopez VK, Bracher J, Brennen A, Castro Rivadeneira AJ, et al. Evaluation of individual and ensemble probabilistic forecasts of COVID-19 mortality in the United States. Proceedings of the National Academy of Sciences. 2022;119(15):e2113561119
work page 2022
-
[8]
Enhancing long-term forecasting: Learning from COVID-19 models
Rahmandad H, Xu R, Ghaffarzadegan N. Enhancing long-term forecasting: Learning from COVID-19 models. PLOS Computational Biology. 2022;18(5):e1010100
work page 2022
-
[9]
Formulating human risk response in epidemic models: exogenous vs endogenous approaches
LeJeune L, Ghaffarzadegan N, Childs LM, Saucedo O. Formulating human risk response in epidemic models: exogenous vs endogenous approaches. European Journal of Operational Research. 2025
work page 2025
-
[10]
Modeling influenza epidemics and pandemics: insights into the future of swine flu (H1N1)
Coburn BJ, Wagner BG, Blower S. Modeling influenza epidemics and pandemics: insights into the future of swine flu (H1N1). BMC Medicine. 2009;7:1-8
work page 2009
-
[11]
Li R, Pei S, Chen B, Song Y, Zhang T, Yang W, et al. Substantial undocumented infection facilitates the rapid dissemination of novel coronavirus (SARS-CoV-2). Science. 2020;368(6490):489-93
work page 2020
-
[12]
SEIR modeling of the COVID-19 and its dynamics
He S, Peng Y, Sun K. SEIR modeling of the COVID-19 and its dynamics. Nonlinear Dynamics. 2020;101:1667-80
work page 2020
-
[13]
Seasonality of influenza and other respiratory viruses
Neumann G, Kawaoka Y. Seasonality of influenza and other respiratory viruses. EMBO Molecular Medicine. 2022;14(4):e15352
work page 2022
-
[14]
Influenza seasonality: underlying causes and modeling theories
Lofgren E, Fefferman NH, Naumov YN, Gorski J, Naumova EN. Influenza seasonality: underlying causes and modeling theories. Journal of Virology. 2007;81(11):5429-36
work page 2007
-
[15]
Meteorological influences on the seasonality of Lyme disease in the United States
Moore SM, Eisen RJ, Monaghan A, Mead P. Meteorological influences on the seasonality of Lyme disease in the United States. The American Journal of Tropical Medicine and Hygiene. 2014;90(3):486
work page 2014
-
[16]
What happens when COVID-19 collides with flu season? JAMA
Rubin R. What happens when COVID-19 collides with flu season? JAMA. 2020;324(10):923-5
work page 2020
-
[17]
How COVID-19 is changing the cold and flu season
Jones N, et al. How COVID-19 is changing the cold and flu season. Nature. 2020;588(7838):388-90
work page 2020
-
[18]
Solomon DA, Sherman AC, Kanjilal S. Influenza in the COVID-19 Era. JAMA. 2020;324(13):1342-3
work page 2020
-
[19]
Dramatic decrease of laboratory- confirmed influenza A after school closure in response to COVID-19
Perez-Lopez A, Hasan M, Iqbal M, Janahi M, Roscoe D, Tang P. Dramatic decrease of laboratory- confirmed influenza A after school closure in response to COVID-19. Pediatric Pulmonology. 2020;55(9):2233
work page 2020
-
[20]
COVID-19 shuts doors to flu but keeps them open to rhinoviruses
Kiseleva I, Ksenafontov A. COVID-19 shuts doors to flu but keeps them open to rhinoviruses. Biology. 2021;10(8):733. 19
work page 2021
-
[21]
No one is naive: the significance of heterologous T-cell immunity
Welsh RM, Selin LK. No one is naive: the significance of heterologous T-cell immunity. Nature Reviews Immunology. 2002;2(6):417-26
work page 2002
-
[22]
Cross-immunity between strains explains the dynamical pattern of paramyxoviruses
Bhattacharyya S, Gesteland PH, Korgenski K, Bjørnstad ON, Adler FR. Cross-immunity between strains explains the dynamical pattern of paramyxoviruses. Proceedings of the National Academy of Sciences. 2015;112(43):13396-400
work page 2015
-
[23]
Dynamics and selection of many-strain pathogens
Gog JR, Grenfell BT. Dynamics and selection of many-strain pathogens. Proceedings of the National Academy of Sciences. 2002;99(26):17209-14
work page 2002
-
[24]
Effect of cross-immunity in a two-strain cholera model with aquatic component
LeJeune L, Browne C. Effect of cross-immunity in a two-strain cholera model with aquatic component. Mathematical Biosciences. 2023;365:109086
work page 2023
-
[25]
Heterologous immunity between viruses
Welsh RM, Che JW, Brehm MA, Selin LK. Heterologous immunity between viruses. Immunological Reviews. 2010;235(1):244-66
work page 2010
-
[26]
Cross-immunity between respiratory coronaviruses may limit COVID-19 fatalities
Yaqinuddin A. Cross-immunity between respiratory coronaviruses may limit COVID-19 fatalities. Med- ical Hypotheses. 2020;144:110049
work page 2020
-
[27]
Kryazhimskiy S, Dieckmann U, Levin SA, Dushoff J. On state-space reduction in multi-strain pathogen models, with an application to antigenic drift in influenza A. PLoS Computational Biol- ogy. 2007;3(8):e159
work page 2007
-
[28]
The effects of evolutionary adaptations on spreading processes in complex networks
Eletreby R, Zhuang Y, Carley KM, Ya˘ gan O, Poor HV. The effects of evolutionary adaptations on spreading processes in complex networks. Proceedings of the National Academy of Sciences. 2020;117(11):5664-70
work page 2020
-
[29]
Unraveling within-host signatures of dengue infection at the population level
Nikin-Beers R, Blackwood JC, Childs LM, Ciupe SM. Unraveling within-host signatures of dengue infection at the population level. Journal of Theoretical Biology. 2018;446:79-86
work page 2018
-
[30]
Modelling the influence of human behaviour on the spread of infectious diseases: a review
Funk S, Salath´ e M, Jansen VA. Modelling the influence of human behaviour on the spread of infectious diseases: a review. Journal of the Royal Society Interface. 2010;7(50):1247-56
work page 2010
-
[31]
Nine challenges in incorpo- rating the dynamics of behaviour in infectious diseases models
Funk S, Bansal S, Bauch CT, Eames KT, Edmunds WJ, Galvani AP, et al. Nine challenges in incorpo- rating the dynamics of behaviour in infectious diseases models. Epidemics. 2015;10:21-5
work page 2015
-
[32]
Behavioural change models for infectious disease transmission: a systematic review (2010–2015)
Verelst F, Willem L, Beutels P. Behavioural change models for infectious disease transmission: a systematic review (2010–2015). Journal of The Royal Society Interface. 2016;13(125):20160820
work page 2010
-
[33]
Lim TY, Xu R, Ruktanonchai N, Saucedo O, Childs LM, Jalali MS, et al. Why Similar Policies Resulted In Different COVID-19 Outcomes: How Responsiveness And Culture Influenced Mortality Rates: Study examines why similar policies resulted in different COVID-19 outcomes in using data from more than 100 countries. Health Affairs. 2023;42(12):1637-46
work page 2023
-
[34]
A missing behavioural feedback in COVID-19 models is the key to several puzzles
Rahmandad H, Xu R, Ghaffarzadegan N. A missing behavioural feedback in COVID-19 models is the key to several puzzles. BMJ Global Health. 2022;7(10):e010463
work page 2022
-
[35]
Mathematical analysis of simple behavioral epidemic models
LeJeune L, Ghaffarzadegan N, Childs LM, Saucedo O. Mathematical analysis of simple behavioral epidemic models. Mathematical Biosciences. 2024;375:109250
work page 2024
-
[36]
Evolution and consequences of individual responses during the COVID-19 outbreak
Abbas W, MA M, Park A, Parveen S, Kim S. Evolution and consequences of individual responses during the COVID-19 outbreak. PLoS One. 2022;17(9):e0273964
work page 2022
-
[37]
Pant B, Safdar S, Santillana M, Gumel AB. Mathematical assessment of the role of human behavior changes on SARS-CoV-2 transmission dynamics in the united states. Bulletin of Mathematical Biology. 2024;86(8):92
work page 2024
-
[38]
Saad-Roy CM, Traulsen A. Dynamics in a behavioral–epidemiological model for individual ad- herence to a nonpharmaceutical intervention. Proceedings of the National Academy of Sciences. 2023;120(44):e2311584120. 20
work page 2023
-
[39]
Espinoza B, Saad-Roy CM, Grenfell BT, Levin SA, Marathe M. Adaptive human behaviour modulates the impact of immune life history and vaccination on long-term epidemic dynamics. Proceedings B. 2024;291(2033):20241772
work page 2024
-
[40]
Triple contagion: a two-fears epidemic model
Epstein JM, Hatna E, Crodelle J. Triple contagion: a two-fears epidemic model. Journal of the Royal Society Interface. 2021;18(181):20210186
work page 2021
-
[41]
Understanding the coevolution of mask wearing and epidemics: A network perspective
Qiu Z, Espinoza B, Vasconcelos VV, Chen C, Constantino SM, Crabtree SA, et al. Understanding the coevolution of mask wearing and epidemics: A network perspective. Proceedings of the National Academy of Sciences. 2022;119(26):e2123355119
work page 2022
-
[42]
Osi A, Ghaffarzadegan N. A simultaneous simulation of human behavior dynamics and epidemic spread: A multi-country study amidst the COVID-19 pandemic. Mathematical Biosciences. 2025;380:109368
work page 2025
-
[43]
FluView: A Weekly Influenza Surveillance Re- port
Centers for Disease Control and Prevention (CDC). FluView: A Weekly Influenza Surveillance Re- port. CDC; 2025. Accessed: July 30, 2025. Available athttps://gis.cdc.gov/grasp/fluview/ fluportaldashboard.html
work page 2025
-
[44]
An interactive web-based dashboard to track COVID-19 in real time
Dong E, Du H, Gardner L. An interactive web-based dashboard to track COVID-19 in real time. The Lancet Infectious Diseases. 2020;20(5):533-4
work page 2020
-
[45]
MATLAB version: 9.10.0 (R2021a)
Inc TM. MATLAB version: 9.10.0 (R2021a). Natick, Massachusetts, United States: The MathWorks Inc.; 2021. Available from:https://www.mathworks.com
work page 2021
-
[46]
Controllability and accessibility analysis of nonlinear biosys- tems
D´ ıaz-Seoane S, Blas AB, Villaverde AF. Controllability and accessibility analysis of nonlinear biosys- tems. Computer methods and programs in biomedicine. 2023;242:107837
work page 2023
-
[47]
Structural identifiability of dynamic systems biology models
Villaverde AF, Barreiro A, Papachristodoulou A. Structural identifiability of dynamic systems biology models. PLoS computational biology. 2016;12(10):e1005153
work page 2016
-
[48]
Dong R, Goodbrake C, Harrington HA, Pogudin G. Differential elimination for dynamical models via projections with applications to structural identifiability. SIAM Journal on Applied Algebra and Geometry. 2023;7(1):194-235
work page 2023
-
[49]
DAISY: a new software tool to test global identifiability of biological and physiological systems
Bellu G, Saccomani MP, Audoly S, D’Angi` o L. DAISY: a new software tool to test global identifiability of biological and physiological systems. Computer Methods and Programs in Biomedicine. 2007;88(1):52- 61
work page 2007
-
[50]
Comparative analysis of practical identifiability methods for an SEIR model
Saucedo O, Laubmeier A, Tang T, Levy B, Asik L, Pollington T, et al. Comparative analysis of practical identifiability methods for an SEIR model. AIMS Mathematics. 2024;9(9):24722-61
work page 2024
-
[51]
On identifiability of nonlinear ODE models and applications in viral dynamics
Miao H, Xia X, Perelson AS, Wu H. On identifiability of nonlinear ODE models and applications in viral dynamics. SIAM Review. 2011;53(1):3-39
work page 2011
-
[52]
Threshold parameters and metapopulation persistence
Hern´ andez-Su´ arez CM, Marquet PA, Velasco-Hern´ andez JX. Threshold parameters and metapopulation persistence. Bulletin of Mathematical Biology. 1999;61(2):341-53
work page 1999
-
[53]
Structural and practical identifiability analysis of outbreak models
Tuncer N, Le TT. Structural and practical identifiability analysis of outbreak models. Mathematical biosciences. 2018;299:1-18
work page 2018
-
[54]
Dynamics of COVID-19: Exploring Behavioral Responsiveness
Mashayekhi A, Gordon D, Tomoaia-Cotisel A, Bahaddin B, Kim H, Luna-Reyes LF, et al. Dynamics of COVID-19: Exploring Behavioral Responsiveness. System Dynamics Review. 2025;41(3):e70006
work page 2025
-
[55]
An Introduction to Mathematical Biology
Allen LJS. An Introduction to Mathematical Biology. Upper Saddle River, NJ: Pearson/Prentice Hall; 2007. 21 A1 Appendix A1.1 SIRS system for each scenario: No spillover (s= 0): dSA dt =−β 0,A exp(−keIA)SAIA + RA τR , dIA dt =β 0,A exp(−keIA)SAIA − IA τI , dRA dt = IA τI − RA τR , deIA dt = IA −eIA τP dSB dt =−β 0,B exp(−keIB)SBIB + RB τR , dIB dt =β 0,B e...
work page 2007
-
[56]
Disease-free equilibrium:For each of the three scenarios, whenI A =I B = 0, we have the disease-free equilibrium given by (1,0,0,0,1,0,0,0)
-
[57]
Disease-B-free, disease-A-endemic boundary equilibrium:For each of the three scenarios, when IB = 0 andI A >0, thenβ A(·) =β 0,A exp(−keIA). The equilibrium is given byS B = 1,I B =R B =eIB = 0 andS A = 1−I A −R A,R A = τR τI IA, eIA =I A whereI A satisfies 0 =β 0,A exp(−kIA)SA − 1 τI . SinceS A depends onI A, we cannot obtain a closed-form expression for...
-
[58]
Disease-A-free, disease-B-endemic boundary equilibrium:Similar reasoning to the disease-B-free, disease-A-endemic setting shows thatE ∗ B, ˆEB, and ¯EB exist if and only ifβ 0,BτI >1. When these equilibria exist, it follows thatβ 0,BτI >exp(kI ∗ B),β 0,BτI >exp(k ˆIB), andβ 0,BτI >exp(k ¯IB). 24 (a) No boundary equilibrium (b) No boundary equilibrium (c) ...
-
[59]
Endemic equilibrium:WhenI A >0 andI B >0, we consider the general case of imperfect spillover (0< s <1). Results from this case can be extended to the cases of no spillover and perfect spillover by considerings= 0 ors= 1, respectively. Imperfect spillover:If bothI A ̸= 0 andI B ̸= 0, then the following two equations are simultaneously satisfied: 0 =β 0,A ...
-
[60]
Solve the system of ordinary differential equations using the true parameter vector ˆpto obtain an output vectorg(x(t),ˆp) at discrete time points{t i}n i=1
-
[61]
ConstructN= 1,000 datasets using an assigned measurement error. In other words, the data are described by yi =g(x(t i),ˆp) +g(x(ti),ˆp)ϵ, whereϵ∼ N(0, σ) beginning withσ= 0
-
[62]
Estimate the parameter setp j with respect to the generated datasets of prevalence and recognized prevalence. The minimizing function is the sum of squared errors between the model output and the datasets constructed in Step 2. We used the functionfminsearchbndin MATLAB to estimate parameters
-
[63]
After the optimization procedure, we computed the ARE values via ARE p(k) = 100%× 1 N NX j=1 p(k) −p (k) j p(k) ,(A16)
-
[64]
After the procedure is completed forσ= 0, the process is repeated by increasing the measurement error byσ={1%,5%,10%,20%,30%}. A1.4 Practical Identifiability Results Table A1: MC approach results for prevalence data with no spillover (s= 0). The values in the table represent the average relative error (ARE) for each parameter with respect to the noise lev...
work page 2016
discussion (0)
Sign in with ORCID, Apple, or X to comment. Anyone can read and Pith papers without signing in.