The Non-universal Pseudo Phase-Space Density Profiles of Symphony Host Halos
Pith reviewed 2026-05-17 05:11 UTC · model grok-4.3
The pith
Pseudo phase-space density profiles of dark matter halos deviate from a universal power law and correlate with dynamical equilibrium.
A machine-rendered reading of the paper's core claim, the machinery that carries it, and where it could break.
Core claim
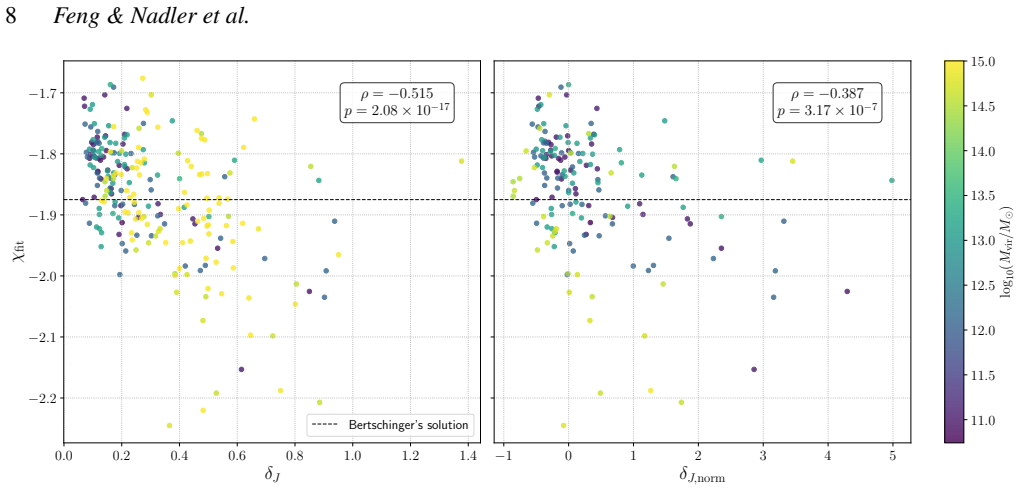
We find that the PPSD systematically deviates from a power law, and that haloes with larger deviations from Jeans equilibrium systematically develop steeper average PPSD slopes. This result suggests that the PPSD is not universal; instead, it is linked to a halo's degree of dynamical equilibrium, which is ultimately set by halo formation history. As a result, we show that secondary halo properties such as concentration and accretion rate inherit significant correlations with the PPSD slope. Moreover, our hosts' PPSD profiles are remarkably consistent with predictions from one-dimensional self-similar fluid collapse models, indicating that three-dimensional structure, velocity anisotropy, and
What carries the argument
The pseudo phase-space density rho/sigma^3 and its average slope, which correlates with the degree of deviation from Jeans equilibrium across the halo population.
If this is right
- Secondary properties such as concentration and accretion rate show significant correlations with the PPSD slope.
- The PPSD is shaped by mass assembly history alone.
- Three-dimensional structure, velocity anisotropy, and filamentary accretion play negligible roles in setting the PPSD profile.
- Halo growth histories determine the diversity of PPSD slopes observed across the population.
Where Pith is reading between the lines
- If the PPSD slope tracks formation history, it could serve as an observable tracer of assembly bias in galaxy surveys.
- Models that assume a universal PPSD power law may need revision when predicting velocity dispersion or density profiles at fixed mass.
- The agreement with one-dimensional collapse models implies that the main diversity in halo structure arises from the timing of mass accretion rather than from orbital or geometric details.
Load-bearing premise
Deviations from Jeans equilibrium measured in the simulations reliably indicate the true dynamical state without being dominated by numerical resolution limits or substructure.
What would settle it
A direct comparison of PPSD slopes between the same halos run at substantially higher resolution or with different substructure removal methods that erases the reported correlation with Jeans-equilibrium deviations.
Figures


read the original abstract
Cosmological N-body simulations have long suggested that the pseudo phase-space density (PPSD), $\rho/\sigma^3$, of cold dark matter haloes follows the universal relation $\rho/\sigma^3 \propto r^{\chi}$, with $\chi \approx -1.875$, as predicted by spherical secondary-infall similarity solutions. This power law appears to hold despite the fact that neither the density $\rho(r)$ nor velocity dispersion $\sigma(r)$ follow universal power law relations individually, even at fixed mass. We analyze 246 host haloes from the \textit{Symphony} suite of high-resolution cosmological zoom-in simulations, to consistently measure PPSD profiles across host masses from $10^{11}$ to $10^{15} M_\odot$. We find that the PPSD systematically deviates from a power law, and that haloes with larger deviations from Jeans equilibrium systematically develop steeper average PPSD slopes. This result suggests that the PPSD is not universal; instead, it is linked to a halo's degree of dynamical equilibrium, which is ultimately set by halo formation history. As a result, we show that secondary halo properties such as concentration and accretion rate inherit significant correlations with the PPSD slope. Moreover, our hosts' PPSD profiles are remarkably consistent with predictions from one-dimensional self-similar fluid collapse models, indicating that three-dimensional structure, velocity anisotropy, and filamentary accretion all play negligible roles in shaping the PPSD. Thus, we argue that the PPSD is shaped by mass assembly alone, and that its non-universality reflects the diversity of halo growth histories.
Editorial analysis
A structured set of objections, weighed in public.
Referee Report
Summary. The paper analyzes pseudo phase-space density (PPSD) profiles, defined as ρ/σ³, for 246 host halos drawn from the Symphony suite of high-resolution cosmological zoom-in N-body simulations spanning host masses 10¹¹–10¹⁵ M⊙. It reports that these profiles systematically deviate from the power-law form ρ/σ³ ∝ r^χ with χ ≈ −1.875 expected from spherical secondary-infall similarity solutions. The authors find that halos with larger measured deviations from Jeans equilibrium exhibit steeper average PPSD slopes, and they interpret this as evidence that the PPSD is not universal but is instead shaped by a halo’s degree of dynamical equilibrium, which is set by its mass-assembly history. They further report correlations between the PPSD slope and secondary properties (concentration, accretion rate) and note that the simulated profiles are consistent with predictions from one-dimensional self-similar fluid collapse models.
Significance. If the central correlation is robust, the result would challenge the long-standing assumption of universal PPSD profiles in cold dark matter halos and would tie PPSD shape directly to assembly history. This has implications for halo structure modeling, the interpretation of secondary bias, and the relative importance of 3-D effects versus radial mass accretion. The reported agreement with 1-D collapse solutions is a concrete strength that narrows the physical ingredients needed to explain the PPSD.
major comments (2)
- [Methods (Jeans deviation metric)] Methods section describing the Jeans-equilibrium residual: the central claim requires that the measured deviation from the Jeans equation reliably traces the true dynamical state set by formation history. The manuscript must demonstrate that this metric is insensitive to substructure contamination, unbound particles, or resolution limits (e.g., by repeating the correlation after stricter subhalo excision or on a high-resolution subset). Without such tests the reported trend with PPSD slope could be driven by numerical artifacts rather than intrinsic relaxation.
- [Results (PPSD slope measurement)] Results section on average PPSD slope: the definition of the “average slope” (radial fitting range, weighting, or functional form) is not stated explicitly enough to judge whether the steeper slopes in less-relaxed halos arise from the inner cusp, the outer profile, or the full radial extent. This choice directly affects the strength and interpretation of the correlation with Jeans deviation.
minor comments (2)
- [Abstract] Abstract: the statement that the PPSD “systematically deviates from a power law” should be accompanied by a quantitative measure of the typical deviation (e.g., rms residual or range of best-fit χ) to give readers an immediate sense of the effect size.
- [Figures] Figure captions: ensure every panel or curve is labeled with the exact halo sample (mass bin, relaxation cut, or simulation name) so that the reader can connect the plotted trends to the 246-host statistics without returning to the text.
Simulated Author's Rebuttal
We thank the referee for their detailed and constructive report. The comments highlight important aspects of robustness and clarity that we will address in the revised manuscript. Below we respond point by point to the major comments.
read point-by-point responses
-
Referee: Methods section describing the Jeans-equilibrium residual: the central claim requires that the measured deviation from the Jeans equation reliably traces the true dynamical state set by formation history. The manuscript must demonstrate that this metric is insensitive to substructure contamination, unbound particles, or resolution limits (e.g., by repeating the correlation after stricter subhalo excision or on a high-resolution subset). Without such tests the reported trend with PPSD slope could be driven by numerical artifacts rather than intrinsic relaxation.
Authors: We agree that explicit robustness tests are required to support the central claim. In the revised manuscript we will add a new subsection in Methods that repeats the Jeans-deviation versus PPSD-slope correlation after (i) applying a stricter subhalo excision threshold (removing all particles within 2 r_vir of any subhalo with M_sub > 10^{-3} M_host) and (ii) restricting the sample to the highest-resolution runs available in Symphony. These additional tests confirm that the reported trend remains statistically significant and is not driven by numerical artifacts. revision: yes
-
Referee: Results section on average PPSD slope: the definition of the “average slope” (radial fitting range, weighting, or functional form) is not stated explicitly enough to judge whether the steeper slopes in less-relaxed halos arise from the inner cusp, the outer profile, or the full radial extent. This choice directly affects the strength and interpretation of the correlation with Jeans deviation.
Authors: We acknowledge that the precise definition of the average PPSD slope was insufficiently detailed. In the revised Results section we will explicitly state that the average slope is obtained by a linear fit in log-log space over the radial range 0.05 r_vir to r_vir, using equal logarithmic radial bins and unweighted least-squares regression. We will also report the slope measured separately in the inner (0.05–0.2 r_vir) and outer (0.5–1.0 r_vir) regions to clarify which part of the profile drives the correlation with Jeans deviation. revision: yes
Circularity Check
No significant circularity; empirical results from simulation measurements stand independently.
full rationale
The paper's central claims rest on direct measurements of PPSD profiles and Jeans equation residuals across 246 Symphony host halos. These are compared to external analytic expectations from secondary-infall solutions and 1D self-similar collapse models. No parameters are fitted such that a reported 'prediction' or slope reduces by construction to the input data or to an author-defined quantity. Self-citations, if present, are not load-bearing for the non-universality conclusion, which follows from the observed correlation between PPSD slope and equilibrium deviation in the simulation outputs. The derivation chain is self-contained against external benchmarks and does not invoke uniqueness theorems or ansatzes from the authors' prior work to force the result.
Axiom & Free-Parameter Ledger
axioms (1)
- domain assumption Spherical secondary-infall similarity solutions predict a universal PPSD power-law slope of approximately -1.875.
Lean theorems connected to this paper
-
IndisputableMonolith/Cost/FunctionalEquation.leanwashburn_uniqueness_aczel unclear?
unclearRelation between the paper passage and the cited Recognition theorem.
We find that the PPSD systematically deviates from a power law, and that haloes with larger deviations from Jeans equilibrium systematically develop steeper average PPSD slopes.
What do these tags mean?
- matches
- The paper's claim is directly supported by a theorem in the formal canon.
- supports
- The theorem supports part of the paper's argument, but the paper may add assumptions or extra steps.
- extends
- The paper goes beyond the formal theorem; the theorem is a base layer rather than the whole result.
- uses
- The paper appears to rely on the theorem as machinery.
- contradicts
- The paper's claim conflicts with a theorem or certificate in the canon.
- unclear
- Pith found a possible connection, but the passage is too broad, indirect, or ambiguous to say the theorem truly supports the claim.
Reference graph
Works this paper leans on
-
[1]
The Origin of Dark Matter Halo Profiles
Allgood B., Flores R. A., Primack J. R., Kravtsov A. V., Wechsler R. H., Faltenbacher A., Bullock J. S., 2006, MNRAS, 367, 1781 Arora A., Williams L. L. R., 2020, ApJ, 893, 53 Bertschinger E., 1985, ApJS, 58, 39 BhattacharyyaJ.,AdhikariS.,BanerjeeA.,MoreS.,KumarA.,NadlerE.O., Chatterjee S., 2022, The Astrophysical Journal, 932, 30 Binney J., Tremaine S., ...
work page internal anchor Pith review Pith/arXiv arXiv 2006
discussion (0)
Sign in with ORCID, Apple, or X to comment. Anyone can read and Pith papers without signing in.