Rapid sinking and efficient mergers of supermassive black holes in compact high-redshift galaxies
Pith reviewed 2026-05-21 18:10 UTC · model grok-4.3
The pith
Supermassive black holes merge in 4 to 35 million years after becoming bound in dense early galaxies
A machine-rendered reading of the paper's core claim, the machinery that carries it, and where it could break.
Core claim
Due to the very high central stellar densities of 10 to the 13 solar masses per cubic kiloparsec or greater that form during the early compaction phase, supermassive black hole binaries in these compact high-redshift galaxies merge rapidly, typically only 4 to 35 million years after the binaries become bound.
What carries the argument
The KETJU code, which uses regularised integration for massive black holes combined with a dynamical friction subgrid model for lower-mass black holes to follow orbital decay and coalescence down to gravitational wave emission.
If this is right
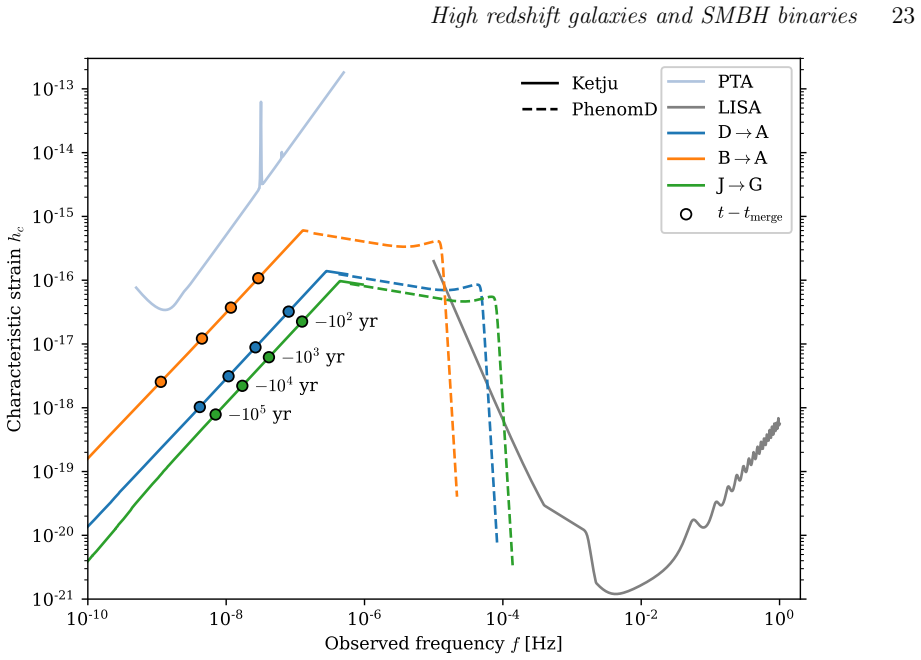
- The complete gravitational wave signal from each merger can be followed continuously from pulsar timing array frequencies through to the final orbits detectable by LISA.
- The simulated compact galaxies at redshifts 5 to 9 match the observed sizes, masses, and fluxes of JWST Little Red Dots.
- Central gas fractions drop sharply once the compaction phase ends while outer regions stay gas-rich and drive later size growth.
- Black hole coalescence occurs early enough to shape the assembly and mass growth of the host galaxies.
Where Pith is reading between the lines
- Rapid high-redshift mergers may add a larger share to the nanohertz gravitational wave background than models with longer binary lifetimes predict.
- The short timescales imply that direct black hole coalescence, rather than prolonged binary hardening, dominates early black hole growth in dense environments.
- Future LISA detections could include a population of these quick high-redshift events if the simulated densities are typical.
Load-bearing premise
The subgrid dynamical friction model for lower-mass black holes combined with regularized integration accurately captures the orbital decay and merger timescales at sub-parsec scales in these high-density environments.
What would settle it
Finding a supermassive black hole binary in a comparable high-redshift compact galaxy that remains unbound or unmerged for longer than 100 million years after the two black holes become bound would contradict the short merger timescale.
Figures


read the original abstract
We present a cosmological zoom-in simulation targeting the high redshift compact progenitor phase of massive galaxies, with the most massive galaxy reaching a stellar mass of $M_{\star}=8.5\times 10^{10} \ M_{\odot}$ at $z=5$. The dynamics of supermassive black holes (SMBHs) is modelled from seeding down to their coalescence at sub-parsec scales due to gravitational wave (GW) emission by utilising a new version of the KETJU code, which combines regularised integration of sufficiently massive SMBHs with a dynamical friction subgrid model for lower-mass SMBHs. All nine massive galaxies included in this study go through a gas-dominated phase of early compaction in the redshift range of $z\sim 7-9$, starting at stellar masses of $M_\star\gtrsim 10^8\ \mathrm{M}_\odot$ and ending at a few times $M_{\star}\sim 10^9\ \mathrm{M}_\odot$. The sizes, masses and broad band fluxes of these compact systems are in general agreement with the population of systems observed with JWST known as `Little Red Dots'. In the compact phase, the stellar and SMBH masses grow rapidly, leading to a sharp decline in the central gas fractions. The outer regions, however, remain relatively gas-rich, leading to subsequent off-centre star formation and size growth. Due to the very high central stellar densities ($\rho_{\star}\gtrsim 10^{13}\,\mathrm{M_\odot/kpc^3}$), the SMBHs merge rapidly, typically just $\sim 4-35\ \mathrm{Myr}$ after the SMBH binaries have become bound. Combining KETJU with the phenomenological PhenomD model resolves the complete evolution of the GW emission from SMBH binaries through the Pulsar Timing Array frequency waveband up to the final few orbits that produce GWs observable with the future LISA mission.
Editorial analysis
A structured set of objections, weighed in public.
Referee Report
Summary. The paper presents cosmological zoom-in simulations of nine high-redshift galaxies reaching stellar masses up to 8.5e10 M⊙ at z=5, using an updated KETJU code that combines regularized N-body integration for massive SMBHs with a subgrid dynamical friction model for lower-mass SMBHs. The galaxies undergo gas-dominated compaction at z~7-9, forming compact systems whose sizes, masses, and fluxes align with JWST-observed 'Little Red Dots'. Due to central stellar densities ρ⋆ ≳ 10^13 M⊙/kpc³, SMBH binaries are reported to merge in 4-35 Myr after becoming bound. The work extends GW modeling from PTA frequencies to LISA using the PhenomD prescription.
Significance. If the merger timescales prove robust, the results would be significant for models of early SMBH assembly, expected LISA event rates, and the role of dense stellar environments in driving rapid coalescence. The hybrid KETJU scheme to bridge parsec to sub-parsec scales, the sample of nine galaxies, and the direct link to observed compact high-z systems are clear strengths that enhance the work's impact.
major comments (2)
- [Abstract and Methods] Abstract and Methods (KETJU implementation): The central claim of 4-35 Myr merger times after binary binding is load-bearing and emerges from the subgrid dynamical friction model translating the reported ρ⋆ ≳ 10^13 M⊙/kpc³ into rapid orbital decay. No resolution convergence tests, parameter sensitivity studies for the friction coefficients, or validation against the extreme densities and velocity dispersions are mentioned, leaving the quantitative result sensitive to the Chandrasekhar-like assumptions in the subgrid prescription.
- [Results] Results (merger timescale reporting): The 4-35 Myr range is presented without per-galaxy values, medians, or scatter across the nine systems, which weakens the ability to assess whether the rapid-merger conclusion holds uniformly or depends on specific realizations of the compaction phase.
minor comments (3)
- [Abstract] Abstract: The description of the transition from compact phase to subsequent size growth via off-centre star formation would benefit from a short physical explanation of the driving mechanism.
- [Abstract] Abstract: Include explicit citations to the original KETJU papers and the PhenomD model to provide immediate context for the numerical and GW modeling choices.
- The reported decline in central gas fraction during the compact phase should be accompanied by a brief note on whether this is measured within a fixed aperture or adaptive radius for clarity.
Simulated Author's Rebuttal
We thank the referee for their careful and constructive review of our manuscript. We address each major comment below and have revised the paper accordingly to improve the robustness and clarity of our presentation.
read point-by-point responses
-
Referee: [Abstract and Methods] Abstract and Methods (KETJU implementation): The central claim of 4-35 Myr merger times after binary binding is load-bearing and emerges from the subgrid dynamical friction model translating the reported ρ⋆ ≳ 10^13 M⊙/kpc³ into rapid orbital decay. No resolution convergence tests, parameter sensitivity studies for the friction coefficients, or validation against the extreme densities and velocity dispersions are mentioned, leaving the quantitative result sensitive to the Chandrasekhar-like assumptions in the subgrid prescription.
Authors: We acknowledge that the current manuscript does not present new resolution convergence tests or dedicated parameter sensitivity studies for the subgrid dynamical friction coefficients at the extreme densities encountered here. The KETJU hybrid scheme and the underlying Chandrasekhar-type dynamical friction prescription have been tested and validated against direct N-body integrations in prior work at somewhat lower (but still high) densities. At the central stellar densities ρ⋆ ≳ 10^13 M⊙/kpc³ reported in our galaxies, the dynamical friction timescale remains short even when the Coulomb logarithm is varied by factors of a few or when modest changes are made to the velocity dispersion scaling. Nevertheless, we agree that an explicit discussion of these assumptions is warranted. In the revised manuscript we have added a dedicated paragraph in the Methods section that (i) recalls the calibration of the subgrid model, (ii) estimates the sensitivity of the merger time to plausible variations in the friction coefficient, and (iii) notes that full convergence at these densities would require substantially higher resolution than is computationally feasible in the present cosmological zoom-in runs. We believe this addition addresses the referee’s concern without altering the central conclusion. revision: partial
-
Referee: [Results] Results (merger timescale reporting): The 4-35 Myr range is presented without per-galaxy values, medians, or scatter across the nine systems, which weakens the ability to assess whether the rapid-merger conclusion holds uniformly or depends on specific realizations of the compaction phase.
Authors: We agree that reporting only the aggregate 4–35 Myr range limits the reader’s ability to judge uniformity across the sample. In the revised manuscript we have added a new table (Table 2) that lists, for each of the nine galaxies, the time from binary binding to coalescence, the central stellar density at binding, and the stellar mass at that epoch. We also report the median merger time (∼15 Myr) and the 16th–84th percentile range. A short accompanying paragraph discusses the modest scatter, which correlates primarily with small differences in the central density profiles established during the compaction phase. These additions make the rapid-merger result quantitatively transparent while preserving the original conclusion. revision: yes
Circularity Check
No significant circularity; merger timescales are direct simulation outputs
full rationale
The paper's central result—that SMBHs merge in ∼4-35 Myr after binary binding due to ρ⋆ ≳ 10^{13} M_⊙/kpc³—arises as an emergent numerical outcome from integrating the orbital dynamics in the KETJU hybrid scheme (regularized integration for massive SMBHs plus subgrid dynamical friction for lower-mass ones) applied to the compact cores formed in the zoom-in runs. No equation or step reduces by construction to its own inputs: the reported timescales are computed outputs, not fitted parameters or self-defined quantities. Self-citations to prior KETJU implementations describe the code framework but do not bear the load of the quantitative merger claim, which remains falsifiable against the simulated density profiles and external benchmarks. The subgrid friction prescription is an explicit modeling assumption whose validity is separate from circularity.
Axiom & Free-Parameter Ledger
free parameters (2)
- SMBH seeding masses
- Subgrid dynamical friction coefficients
axioms (2)
- standard math Lambda-CDM cosmological model with standard parameters
- domain assumption Accuracy of KETJU regularized integration and dynamical friction subgrid model for SMBH dynamics
Lean theorems connected to this paper
-
IndisputableMonolith/Cost/FunctionalEquation.leanwashburn_uniqueness_aczel unclear?
unclearRelation between the paper passage and the cited Recognition theorem.
Due to the very high central stellar densities (ρ⋆ ≳ 10^13 M⊙/kpc³), the SMBHs merge rapidly, typically just ∼4-35 Myr after the SMBH binaries have become bound.
-
IndisputableMonolith/Foundation/RealityFromDistinction.leanreality_from_one_distinction unclear?
unclearRelation between the paper passage and the cited Recognition theorem.
combines regularised integration of sufficiently massive SMBHs with a dynamical friction subgrid model
What do these tags mean?
- matches
- The paper's claim is directly supported by a theorem in the formal canon.
- supports
- The theorem supports part of the paper's argument, but the paper may add assumptions or extra steps.
- extends
- The paper goes beyond the formal theorem; the theorem is a base layer rather than the whole result.
- uses
- The paper appears to rely on the theorem as machinery.
- contradicts
- The paper's claim conflicts with a theorem or certificate in the canon.
- unclear
- Pith found a possible connection, but the passage is too broad, indirect, or ambiguous to say the theorem truly supports the claim.
Reference graph
Works this paper leans on
-
[1]
Modelling the uv/x-ray cosmic background with CUBA
Abac A. G., et al., 2025, ApJ, 993, L25 Abbott R., et al., 2023, Physical Review X, 13, 041039 Agazie G., et al., 2023, ApJ, 951, L9 Akins H. B., et al., 2023, ApJ, 956, 61 Akins H. B., et al., 2025a, ApJ, 980, L29 Akins H. B., et al., 2025b, ApJ, 991, 37 Amaro-Seoane P., Sesana A., Hoffman L., Benacquista M., Eich- horn C., Makino J., Spurzem R., 2010, M...
work page internal anchor Pith review doi:10.48550/arxiv.astro-ph/0106018 2025
-
[2]
and the choice of code and integration parameters (Frenk et al. 1999). Therefore it is not too unexpected that the location of galaxies begins to deviate between the simu- lations with different SMBH dynamics modelling schemes. APPENDIX B: CHARACTERISTIC STRAIN CALCULA TION Following Amaro-Seoane et al. (2010) and Kelley et al. (2017b), the GW strain ampl...
work page 1999
-
[3]
Note that we use equation B4 withfh =f r/n, while Berentzen et al
hc,n(f) = p N(f)h s,n(f) = 37 √ 5 64 √ 6π2/3 (GM)5/6 c3/2d(z) p g(n, e)f −1/6, (B4) withMbeing the chirp mass of the binary,d(z)the comoving distance from the observer and g(n, e) = n4 32 Jn−2(ne)−2eJ n−1(ne) + 2 n Jn(ne) + 2eJn+1 −J n+2(ne) 2 + (1−e) 2 (Jn−2(ne)−2J n(ne) +J n+2(ne))2 + 4 3n2 J2 n(ne) (B5) is a function describing the relative contributio...
work page 1963
-
[4]
da dt =− 64 5 G3(m1 +m 2)m1m2 c5a3(1−e 2)7/2 1 + 73 24 e2 + 37 96 e4 (B7) and de dt =− 304 15 G3(m1 +m 2)m1m2 c5a4(1−e 2)5/2 1 + 121 304 e2 e.(B8) This paper has been typeset from a TEX/LATEX file prepared by the author. MNRAS000, 1–29 (2025) 30A. Keitaanranta et al. BA Zoom-K+DF BA Zoom-DF BA Zoom-G Figure A1.Snapshot showing the gas surface density of g...
work page 2025
discussion (0)
Sign in with ORCID, Apple, or X to comment. Anyone can read and Pith papers without signing in.