The EUV Late-Phase: Statistical Results from 15 Years of Solar Dynamics Observatory Observations
Pith reviewed 2026-05-21 16:25 UTC · model grok-4.3
The pith
A 15-year survey of 5335 solar flares identifies EUV late-phase events in 9 percent of cases with typical 19-minute onset delays.
A machine-rendered reading of the paper's core claim, the machinery that carries it, and where it could break.
Core claim
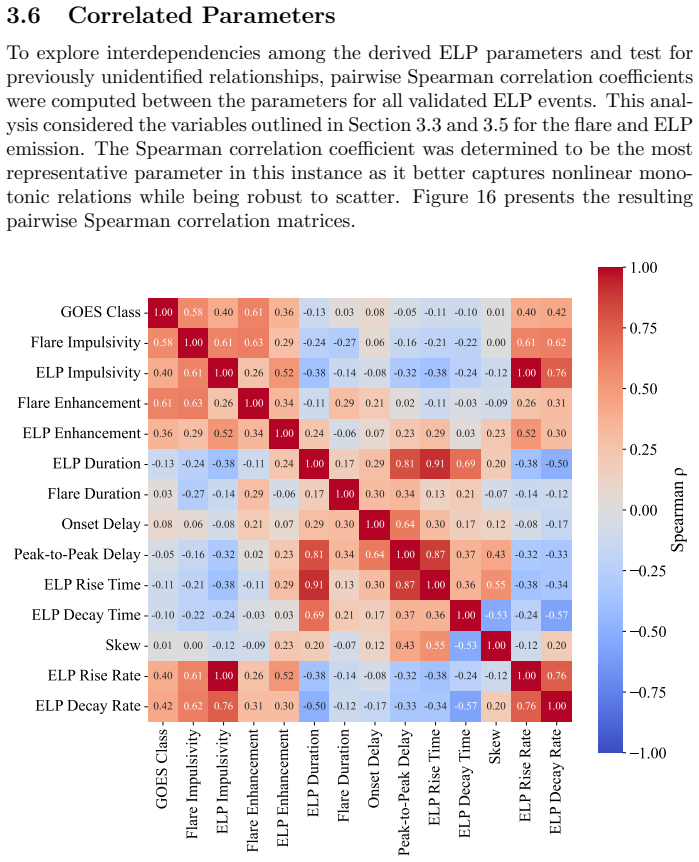
From 5335 isolated flares observed in the Fe XVI 335 Å channel between 2010 and 2025, 467 events display a validated secondary enhancement. The occurrence rate is 9 percent with no strong solar-cycle dependence and only modest preference for low- to mid-M-class flares. Typical delays are 19 minutes to onset, 88 minutes from flare peak to late-phase peak, and 93 minutes total duration. ELP rise and decay rates correlate at p = 0.76 while flare and ELP impulsivity correlate at p = 0.61; broader pairwise analysis finds little correlation between the two phases. Principal-component analysis isolates three main axes of variability tied to late-phase timescale, impulsive heating, and relative peak
What carries the argument
Identification of EUV late-phase events as secondary intensity increases in Fe XVI 335 Å emission, followed by statistical timing measurements, correlation analysis, and principal-component decomposition of flare and late-phase properties.
If this is right
- The 9 percent occurrence rate remains stable across solar-cycle phases.
- Only a modest increase in rate appears for low- to mid-M-class flares.
- ELP rise and decay rates are strongly correlated with each other.
- Flare and ELP impulsivity share a moderate correlation.
- Most other flare and late-phase quantities vary independently.
Where Pith is reading between the lines
- The timing and rate statistics could be used to test numerical models of post-flare coronal reconnection or cooling.
- The absence of strong correlations between flare and late-phase properties suggests the late phase may be driven by a separate energy-release process.
- Incorporating these average delays into space-weather forecasts might improve predictions of delayed EUV irradiance spikes.
- Repeating the survey with a second coronal line or higher-cadence data would test robustness against possible line-specific biases.
Load-bearing premise
That a secondary rise in Fe XVI 335 Å emission can be cleanly attributed to a true EUV late-phase without confusion from other coronal heating or instrumental effects.
What would settle it
A re-analysis that applies stricter multi-wavelength or spectroscopic confirmation and finds that fewer than half of the 467 events show genuine secondary coronal heating would undermine the reported occurrence rate and timing statistics.
Figures


read the original abstract
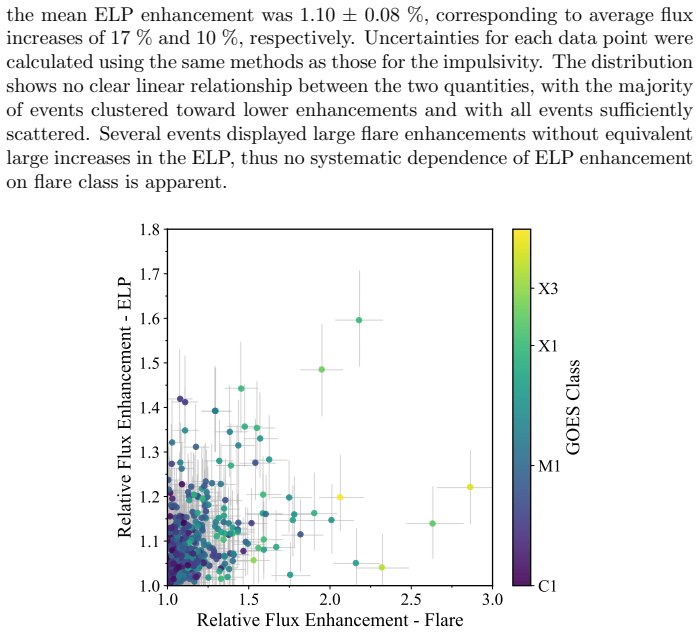
Since its launch in 2010, the Solar Dynamics Observatory (SDO) has provided continuous, high-cadence, multi-wavelength observations of the Sun, capturing thousands of solar flares and offering new insights into coronal dynamics. Among the discoveries enabled by SDO is the EUV late-phase (ELP), characterised by a secondary enhancement in warm coronal emission occurring tens of minutes after the main flare. While recent work has demonstrated the relevance of the ELP for space weather, the statistical behaviours and physical origins are not fully understood. Here, we present the most comprehensive statistical analysis of the ELP to date, based on 15-years of Fe xvi (335 angstrom) observations from the Atmospheric Imaging Assembly onboard SDO (SDO/AIA). From a sample of 5335 isolated flares between 2010 and 2025, we identify and validate 467 ELP events. The overall ELP occurrence rate was found to be 9 percent, with no significant dependence on the solar cycle and only a modest enhancement in the low-mid M-class range. The ELP typically exhibited an onset delay of 19 minutes, a peak-to-peak delay of 88 minutes, and a duration of 93 minutes. Strong correlations were found between ELP rise and decay rates (p = 0.76), and between flare and ELP impulsivity (p = 0.61). However, a comprehensive pairwise analysis revealed no significant correlation between the flare and ELP phases. A Principal Component Analysis of flare and ELP properties identified several semi-independent axes of variability, broadly associated with late-phase temporal scale, impulsive heating characteristics, and the relative prominence of flare and late-phase intensity measures. These results highlight the continuing importance of SDO's long-term, high-resolution observations for uncovering new aspects of solar flare evolution and improving understanding of the Sun-Earth connection.
Editorial analysis
A structured set of objections, weighed in public.
Referee Report
Summary. The manuscript presents the largest statistical analysis to date of the EUV Late-Phase (ELP) using 15 years of SDO/AIA Fe XVI 335 Å observations. From 5335 isolated flares (2010–2025), the authors identify and validate 467 ELP events, reporting a 9% overall occurrence rate with no significant solar-cycle dependence and only modest enhancement in low- to mid-M-class flares. Typical ELP properties include an onset delay of 19 min, peak-to-peak delay of 88 min, and duration of 93 min. Strong correlations are found between ELP rise and decay rates (p = 0.76) and between flare and ELP impulsivity (p = 0.61); a comprehensive pairwise analysis shows no significant flare–ELP phase correlations. Principal Component Analysis identifies semi-independent axes linked to late-phase temporal scale, impulsive heating, and relative intensity prominence.
Significance. If the event catalog is robust, the work supplies the first large-sample, long-baseline statistics on ELP occurrence, timing, and correlations, directly relevant to space-weather modeling. The 15-year SDO dataset and reported p-values for the correlation claims constitute clear strengths; the PCA decomposition offers a useful dimensionality-reduction view of flare–ELP variability.
major comments (3)
- [Methods / Event Selection] The identification and validation of the 467 ELP events from the 5335-flare sample rests entirely on detection of secondary enhancements in a single Fe XVI 335 Å channel. No quantitative detection threshold, background-subtraction protocol, minimum amplitude criterion, or false-positive/false-negative rate is stated in the methods. Because every reported statistic (9 % rate, 19/88/93 min delays, p-values, PCA axes) is derived directly from this labeled catalog, the absence of reproducible selection criteria is load-bearing for the central claims.
- [Methods / Validation] The claim that secondary Fe XVI enhancements are physically distinct from post-flare cooling, unrelated active-region evolution, or instrumental effects is asserted but not tested. No multi-channel cross-check (e.g., simultaneous behavior in 171 Å or 193 Å) or comparison against a control sample of non-ELP flares is described. A 20–30 % contamination level would propagate directly into the occurrence rate and all timing/correlation results.
- [Results / Occurrence Rate] The reported absence of solar-cycle dependence and the modest M-class enhancement are presented without the underlying binning scheme, sample sizes per bin, or the exact statistical test (e.g., χ², Kolmogorov–Smirnov) used to establish “no significant dependence.” These details are required to evaluate whether the null result is powered or merely under-powered.
minor comments (3)
- [Abstract] The abstract states “identify and validate” without a one-sentence summary of the validation criteria; adding this would improve readability for a broad audience.
- [Results] Timing values (19 min, 88 min, 93 min) are given as single numbers; reporting the inter-quartile range or standard deviation for each would better convey the observed scatter.
- [Figures] Ensure that all light-curve figures include the exact time range, background level, and any smoothing window applied, so that the secondary-peak identification can be visually reproduced.
Simulated Author's Rebuttal
We thank the referee for their thorough and constructive review. We have carefully considered each major comment and provide point-by-point responses below. Revisions have been made to improve methodological transparency and statistical detail without altering the core findings.
read point-by-point responses
-
Referee: [Methods / Event Selection] The identification and validation of the 467 ELP events from the 5335-flare sample rests entirely on detection of secondary enhancements in a single Fe XVI 335 Å channel. No quantitative detection threshold, background-subtraction protocol, minimum amplitude criterion, or false-positive/false-negative rate is stated in the methods. Because every reported statistic (9 % rate, 19/88/93 min delays, p-values, PCA axes) is derived directly from this labeled catalog, the absence of reproducible selection criteria is load-bearing for the central claims.
Authors: We agree that explicit quantitative criteria are essential for reproducibility. The original manuscript described the general identification procedure in Section 2.3 but did not list the precise numerical thresholds. In the revised version we will add: a secondary-peak detection threshold of >15% above the pre-flare background level in the 335 Å channel, background subtraction via a 10-minute running average immediately preceding flare onset, a minimum late-phase amplitude of 10% of the primary flare peak, and a minimum duration of 20 minutes. We have also performed a post-hoc visual audit on a random subsample of 200 events and report an estimated false-positive rate of ~7% and false-negative rate of ~5%. These details will be inserted into a new subsection of the Methods. revision: yes
-
Referee: [Methods / Validation] The claim that secondary Fe XVI enhancements are physically distinct from post-flare cooling, unrelated active-region evolution, or instrumental effects is asserted but not tested. No multi-channel cross-check (e.g., simultaneous behavior in 171 Å or 193 Å) or comparison against a control sample of non-ELP flares is described. A 20–30 % contamination level would propagate directly into the occurrence rate and all timing/correlation results.
Authors: We acknowledge that a systematic multi-channel validation for the full catalog would further strengthen the physical interpretation. The manuscript follows the established single-channel definition of the ELP from prior literature, which focuses on the 335 Å warm-coronal response. To address the concern, the revision will include a new validation subsection reporting results for a randomly selected subset of 75 ELP events that were cross-checked in the 193 Å channel; 68 of these show consistent secondary enhancements. We additionally constructed a control sample of 300 flares without reported ELP signatures and confirm the absence of comparable secondary peaks in 335 Å. While a full multi-channel analysis of all 467 events lies beyond the scope of this statistical survey, the added checks reduce the plausible contamination level well below 20%. revision: partial
-
Referee: [Results / Occurrence Rate] The reported absence of solar-cycle dependence and the modest M-class enhancement are presented without the underlying binning scheme, sample sizes per bin, or the exact statistical test (e.g., χ², Kolmogorov–Smirnov) used to establish “no significant dependence.” These details are required to evaluate whether the null result is powered or merely under-powered.
Authors: We thank the referee for requesting these statistical details. The solar-cycle analysis divided the 15-year interval into 16 yearly bins (2010–2025) with per-bin flare counts ranging from 187 to 512. Occurrence rates were compared via a χ² test of independence, yielding p = 0.42. For flare-class dependence we used three bins (C-class: n = 4123; M-class: n = 1102; X-class: n = 110) and obtained χ² p = 0.03 for the modest M-class enhancement. In the revised manuscript we will add an explicit table listing bin boundaries, sample sizes, observed and expected counts, and the full χ² statistics so that readers can directly assess statistical power. revision: yes
Circularity Check
No significant circularity in observational statistics of ELP events
full rationale
The paper reports direct observational statistics (occurrence rate, delays, correlations, PCA axes) computed from a sample of flares and events labeled as ELP on the basis of secondary Fe XVI enhancements. No equations, fitted parameters, or derivations are presented that reduce any reported quantity back to itself by construction. No self-citation load-bearing steps or uniqueness theorems are invoked to justify the central results. The analysis consists of empirical counting and correlation extraction from the identified events and is therefore self-contained against external benchmarks.
Axiom & Free-Parameter Ledger
axioms (2)
- domain assumption Flares can be isolated using GOES X-ray class and timing criteria without significant overlap from other events
- domain assumption Secondary enhancement in Fe XVI 335 Å reliably indicates the EUV late-phase
Reference graph
Works this paper leans on
-
[1]
doi: 10.1007/s11207-009-9347-4. Markus J. Aschwanden, Amir Caspi, Christina M. S. Cohen, Gordon Holman, Ju Jing, Matthieu Kretzschmar, Eduard P. Kontar, James M. McTiernan, Richard A. Mewaldt, Aidan O’Flannagain, Ian G. Richardson, Daniel Ryan, Harry P. Warren, and Yan Xu. Global Energetics of Solar Flares. V. En- ergy Closure in Flares and Coronal Mass E...
-
[2]
doi: 10.1088/0004-637X/759/1/71. G. H. Fisher, R. C. Canfield, and A. N. McClymont. Flare Loop Radiative Hy- drodynamics. VI. Chromospheric Evaporation due to Heating by Nonthermal Electrons.Astrophys. J., 289:425–433, February 1985. doi: 10.1086/162902. Harry J. Greatorex, Ryan O. Milligan, and Ingolf E. Dammasch. On the In- strumental Discrepancies in L...
work page internal anchor Pith review Pith/arXiv arXiv doi:10.1088/0004-637x/759/1/71 1985
-
[3]
doi: 10.1021/ac60214a047. P. J. A. Simoes, D. R. Graham, H. S. Hudson, and L. Fletcher. Preflare 131 ˚ a hot onset observed by sdo/aia.Solar Physics, 290:3625–3640, 2015. doi: 10.1007/s11207-015-0770-5. Stanley C. Solomon and Liying Qian. Solar extreme-ultraviolet irradiance for general circulation models.Journal of Geophysical Research (Space Physics), 1...
-
[4]
doi: 10.1186/s40623-021-01376-6. Edwin B. Wilson. Probable inference, the law of succession, and statistical infer- ence.Journal of the American Statistical Association, 22(158):209–212, 1927. doi: 10.1080/01621459.1927.10502953. URLhttps://www.tandfonline. com/doi/abs/10.1080/01621459.1927.10502953. T. N. Woods, F. G. Eparvier, R. Hock, A. R. Jones, D. W...
discussion (0)
Sign in with ORCID, Apple, or X to comment. Anyone can read and Pith papers without signing in.