Multiple Testing of One-Sided Hypotheses with Conservative p-values
Pith reviewed 2026-05-16 19:27 UTC · model grok-4.3
The pith
Estimating the marginal null distribution via empirical Bayes produces refined p-values that plug directly into standard multiple testing procedures for one-sided hypotheses.
A machine-rendered reading of the paper's core claim, the machinery that carries it, and where it could break.
Core claim
We estimate the marginal null distribution of the test statistics within an empirical Bayes framework and construct refined p-values based on this estimated distribution. These refined p-values can then be directly used in standard multiple testing procedures without modification.
What carries the argument
Empirical Bayes estimate of the marginal null distribution of the test statistics, used to build exact p-values under the composite null.
If this is right
- Standard procedures such as Benjamini-Hochberg can be applied to the refined p-values with no further adjustment.
- Power increases substantially whenever conventional p-values are conservative because of negative null means.
- Performance matches that of existing specialized methods when the conventional p-values are already exact.
- The approach applies directly to real high-throughput data such as phosphorylation measurements.
Where Pith is reading between the lines
- The same empirical-Bayes correction could be explored for other composite nulls beyond the normal location family.
- Correcting the p-values rather than the multiple-testing rule may simplify implementation for practitioners already using off-the-shelf software.
- Accurate estimation of the null distribution will require sufficiently many tests; performance in moderate dimensions remains to be quantified.
Load-bearing premise
The marginal null distribution of the test statistics can be accurately recovered from the observed data by empirical Bayes under the maintained normality and unit-variance assumption.
What would settle it
Apply the refined p-values to simulated data in which a known fraction of null means are strictly negative and check whether false-discovery rate is controlled at the nominal level while power exceeds that of conventional p-values.
Figures




read the original abstract
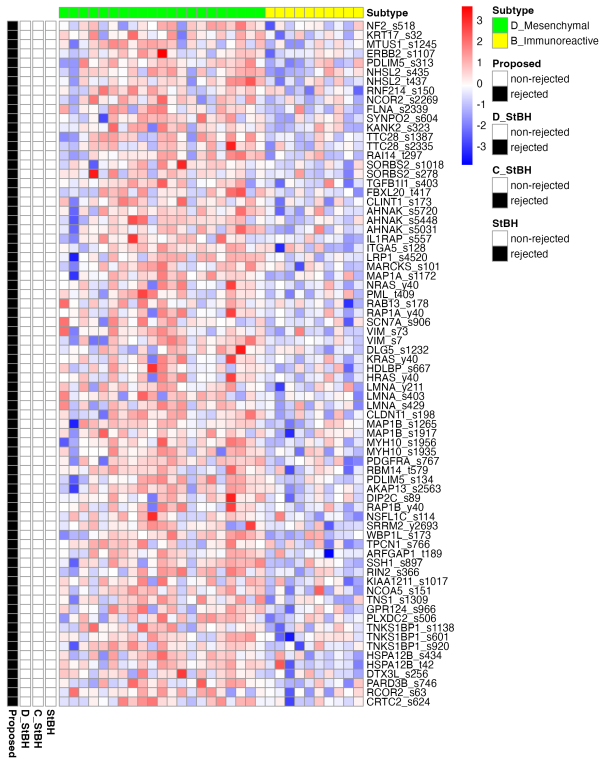
We study a large-scale one-sided multiple testing problem in which test statistics follow normal distributions with unit variance, and the goal is to identify signals with positive mean effects. A conventional approach is to compute $p$-values under the assumption that all null means are exactly zero and then apply standard multiple testing procedures such as the Benjamini-Hochberg (BH) or Storey-BH method. However, because the null hypothesis is composite, some null means may be strictly negative. In this case, the resulting $p$-values are conservative, leading to a substantial loss of power. Existing methods address this issue by modifying the multiple testing procedure itself, for example through conditioning strategies or discarding rules. In contrast, we focus on correcting the $p$-values so that they are exact under the null. Specifically, we estimate the marginal null distribution of the test statistics within an empirical Bayes framework and construct refined $p$-values based on this estimated distribution. These refined $p$-values can then be directly used in standard multiple testing procedures without modification. Extensive simulation studies show that the proposed method substantially improves power when conventional $p$-values are conservative, while achieving comparable performance to existing methods when conventional $p$-values are exact. An application to phosphorylation data further demonstrates the practical effectiveness of our approach.
Editorial analysis
A structured set of objections, weighed in public.
Referee Report
Summary. The paper studies one-sided multiple testing where Z_i ~ N(μ_i, 1) and the null is composite (μ_i ≤ 0). It estimates the marginal null cdf F_0 via empirical Bayes applied to the observed mixture of all Z_i, defines refined p-values as 1 - F̂_0(Z_i), and shows via simulations that these p-values can be plugged directly into BH or Storey-BH to recover power lost when conventional (point-null) p-values are conservative, while performing comparably when they are exact; an application to phosphorylation data is included.
Significance. If the refined p-values remain valid for FDR control, the method supplies a simple, procedure-agnostic correction for composite-null conservatism that avoids ad-hoc modifications to BH. The simulation evidence of power gains under correctly specified models is a positive indicator of practical utility in large-scale testing settings such as genomics. However, the absence of consistency rates, finite-sample bounds, or FDR proofs limits the result's immediate impact and generalizability.
major comments (3)
- [Section 3 (empirical Bayes estimation of the null distribution)] The central construction estimates F̂_0 from the full mixture (nulls with μ ≤ 0 plus alternatives with μ > 0). No bound or rate is given on sup |F̂_0 - F_0| or on the resulting bias in the right tail; this directly affects whether the refined p-values remain super-uniform under the composite null (see the definition of refined p-values and the EB fitting step).
- [Section 4 (theoretical properties) and the abstract] No theorem, proposition, or even heuristic argument establishes that the plug-in refined p-values preserve FDR control for BH or Storey-BH. The claim that they 'can be directly used in standard multiple testing procedures without modification' therefore rests only on simulation evidence under correct model specification.
- [Simulation studies section] The simulation design assumes the normal-unit-variance model is correctly specified and does not include cases with strong positive alternatives that could contaminate the left-tail identification of the null prior G on (-∞,0]. Additional robustness checks under misspecification would be required to support the power-gain claims.
minor comments (2)
- [Abstract] The abstract states that simulations show 'substantial power gains' but supplies no numerical details (replications, grid of μ values, exact EB implementation).
- [Notation and method sections] Notation for the estimated null cdf should be introduced explicitly and distinguished from the true F_0 at first use to avoid ambiguity in later sections.
Simulated Author's Rebuttal
We thank the referee for the detailed and constructive comments on our manuscript. We address each major point below and have revised the paper accordingly to improve clarity on estimation properties, add discussion of theoretical aspects, and expand the simulations for robustness.
read point-by-point responses
-
Referee: The central construction estimates F̂_0 from the full mixture (nulls with μ ≤ 0 plus alternatives with μ > 0). No bound or rate is given on sup |F̂_0 - F_0| or on the resulting bias in the right tail; this directly affects whether the refined p-values remain super-uniform under the composite null (see the definition of refined p-values and the EB fitting step).
Authors: We agree that explicit bounds on the uniform error of F̂_0 are not derived in the manuscript. The estimator relies on nonparametric empirical Bayes deconvolution of the observed mixture, using the fact that positive-mean alternatives have negligible mass in the far left tail to identify the null component G on (-∞,0]. While we do not provide new rates here, the procedure follows standard EB methods for which consistency of the estimated marginal null cdf has been established in the literature under bounded null proportion and smoothness conditions on G. In the revision we will add a paragraph in Section 3 discussing this connection and citing relevant consistency results for EB null estimation, along with a brief heuristic on why right-tail bias remains controlled when the alternative proportion is moderate. revision: yes
-
Referee: No theorem, proposition, or even heuristic argument establishes that the plug-in refined p-values preserve FDR control for BH or Storey-BH. The claim that they 'can be directly used in standard multiple testing procedures without modification' therefore rests only on simulation evidence under correct model specification.
Authors: We acknowledge the absence of a formal FDR proof. The refined p-values are constructed so that, when F̂_0 converges to the true marginal null cdf, they become asymptotically super-uniform under the composite null; the simulations then confirm that BH and Storey-BH applied to these p-values maintain FDR control while recovering power. In the revised manuscript we will (i) add a short heuristic argument in Section 4 linking consistency of F̂_0 to approximate uniformity and the known robustness properties of BH, and (ii) moderate the abstract and introduction claims to emphasize that validity is supported by both the construction and extensive simulation evidence rather than a complete theorem. revision: partial
-
Referee: The simulation design assumes the normal-unit-variance model is correctly specified and does not include cases with strong positive alternatives that could contaminate the left-tail identification of the null prior G on (-∞,0]. Additional robustness checks under misspecification would be required to support the power-gain claims.
Authors: The main simulation suite is intentionally conducted under the correctly specified model to isolate the power loss due to conservative conventional p-values. We agree that additional checks with strong positive alternatives are valuable. In the revision we will augment the simulation section with new experiments that include 10–30% alternatives with means μ_i ≥ 3 (and even larger), report the resulting bias in the estimated left tail of F̂_0, and verify that FDR control and power gains remain intact. These results will be summarized in a new robustness subsection. revision: yes
Circularity Check
No circularity in the empirical Bayes estimation of the marginal null distribution
full rationale
The derivation proceeds by positing normal unit-variance test statistics, estimating the marginal null CDF F_0 via empirical Bayes applied to the observed mixture of all Z_i, and defining refined p-values as 1 - F_hat_0(Z_i). This estimation is performed once on the full data set and is statistically independent of the subsequent plug-in into BH or Storey-BH; the resulting p-values are not algebraically identical to any fitted quantity by construction, nor does any step invoke a self-citation chain, uniqueness theorem, or ansatz that reduces the claim to its own inputs. The procedure is therefore self-contained against external benchmarks of FDR control once the EB estimator is accepted, with no load-bearing circular reductions present.
Axiom & Free-Parameter Ledger
free parameters (1)
- parameters of the estimated null distribution
axioms (2)
- domain assumption Test statistics follow normal distributions with unit variance
- domain assumption The marginal null distribution can be consistently estimated via empirical Bayes from the observed data
Reference graph
Works this paper leans on
-
[1]
Azzalini, A. (1985). A class of distributions which includes the normal ones.Scandinavian Journal of Statistics 12(2), 171–178
work page 1985
-
[2]
Barber, R. F. and E. J. Cand` es (2019). A knockoff filter for high-dimensional selective inference
work page 2019
-
[3]
Benjamini, Y. and Y. Hochberg (1995). Controlling the false discovery rate: a practical and powerful approach to multiple testing.Journal of the Royal statistical society: series B (Method- ological) 57(1), 289–300
work page 1995
-
[4]
Brent, R. P. (2013).Algorithms for minimization without derivatives. Courier Corporation
work page 2013
- [5]
-
[6]
Efron, B. (2004). Large-scale simultaneous hypothesis testing: the choice of a null hypothesis. Journal of the American Statistical Association 99(465), 96–104
work page 2004
-
[7]
Ellis, J. L., J. Pecanka, and J. J. Goeman (2020). Gaining power in multiple testing of interval hypotheses via conditionalization.Biostatistics 21(2), e65–e79
work page 2020
-
[8]
Genovese, C. R. and L. Wasserman (2006). Exceedance control of the false discovery proportion. Journal of the American Statistical Association 101(476), 1408–1417
work page 2006
-
[9]
Kim, J., J. Lim, and J. S. Lee (2022). Semi-parametric hidden markov model for large-scale multiple testing under dependency.Statistical Modelling, 1471082X221121235
work page 2022
-
[10]
Kim, Y., P. Carbonetto, M. Stephens, and M. Anitescu (2020). A fast algorithm for maximum likelihood estimation of mixture proportions using sequential quadratic programming.Journal of Computational and Graphical Statistics 29(2), 261–273
work page 2020
-
[11]
Mart´ ınez-Camblor, P. (2014). On correlated z-values distribution in hypothesis testing.Com- putational Statistics & Data Analysis 79, 30–43
work page 2014
-
[12]
O’Hagan, A. and T. Leonard (1976). Bayes estimation subject to uncertainty about parameter constraints.Biometrika 63(1), 201–203
work page 1976
-
[13]
Storey, J. D. (2002). A direct approach to false discovery rates.Journal of the Royal Statistical Society: Series B (Statistical Methodology) 64(3), 479–498
work page 2002
-
[14]
Storey, J. D., J. E. Taylor, and D. Siegmund (2004). Strong control, conservative point esti- mation and simultaneous conservative consistency of false discovery rates: a unified approach. Journal of the Royal Statistical Society Series B: Statistical Methodology 66(1), 187–205
work page 2004
-
[15]
Sun, W. and T. T. Cai (2007). Oracle and adaptive compound decision rules for false discovery rate control.Journal of the American Statistical Association 102(479), 901–912
work page 2007
-
[16]
Tian, J. and A. Ramdas (2019). Addis: an adaptive discarding algorithm for online fdr control with conservative nulls. InAdvances in Neural Information Processing Systems, Volume 32. 29
work page 2019
-
[17]
Zhang, H., T. Liu, Z. Zhang, S. H. Payne, B. Zhang, J. E. McDermott, J.-Y. Zhou, V. A. Petyuk, L. Chen, D. Ray, et al. (2016). Integrated proteogenomic characterization of human high-grade serous ovarian cancer.Cell 166(3), 755–765
work page 2016
-
[18]
Zhao, Q., D. S. Small, and W. Su (2019). Multiple testing when many p-values are uni- formly conservative, with application to testing qualitative interaction in educational interven- tions.Journal of the American Statistical Association 114(527), 1291–1304. A Proof of Lemma 1 Proof of Lemma 1.For a fixed null indexj, we want to show thatp j = 1−Φ(Z j) is...
work page 2019
discussion (0)
Sign in with ORCID, Apple, or X to comment. Anyone can read and Pith papers without signing in.