REVIEW 4 major objections 4 minor 6 references
Bi-level Multi-criteria Optimization for Risk-informed Radiotherapy
T0 review · 4 major / 4 minor · reviewed 2026-08-03 · deepseek-v4-flash
Pith's one-line read Risk-guided optimization cuts predicted radiation pneumonitis risk by 7.7% on average in a 19-patient lung cancer cohort.
desk verdict The optimization framework is a legitimate proof-of-concept, but the 7.7% RP risk reduction is an evaluation of the model's own objective, not clinical efficacy; the paper needs a softened claim and clearer validation status. read the letter →
The pith
A machine-rendered reading of the paper's core claim, the machinery that carries it, and where it could break.
The reading
What carries the argument
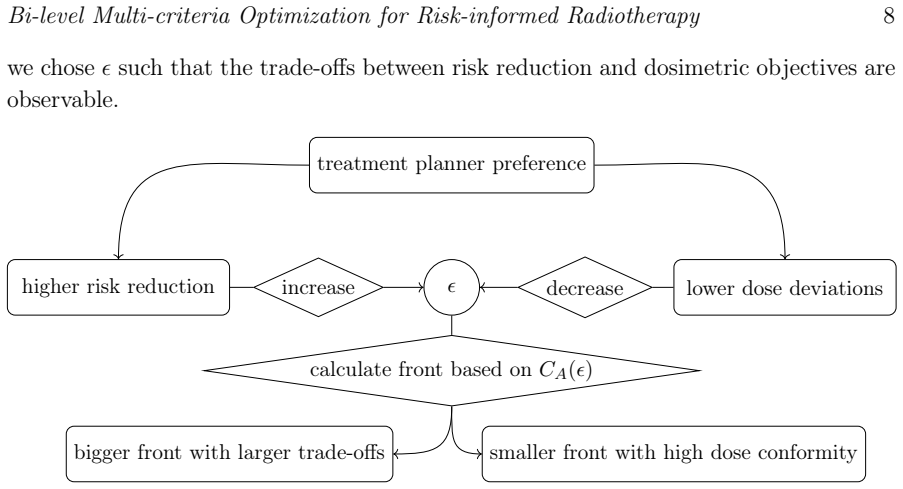
The load-bearing mechanism is a modified domination cone in objective space. Instead of treating the risk objective as equally important as the dose objectives, the cone CA (defined by a matrix Q with epsilon entries) imposes a lexicographic-like ordering: a plan is only considered better if it improves risk without worsening dose objectives beyond a relative fraction epsilon. Because the cone is polyhedral, the standard Sandwiching algorithm for convex multi-criteria optimization can approximate the risk-guided Pareto front directly, which turns the bi-level problem into a one-shot computation. The planner tunes epsilon to choose how aggressively to chase risk reduction.
What would settle it
Check whether the 19-patient evaluation set overlaps the 69-patient training set for the RP risk model; any overlap would mean the 'risk reduction' is in-sample. More decisively, run a prospective or external validation where risk-guided plans and standard plans are compared on actual observed grade 2+ radiation pneumonitis: if the risk-guided arm does not show lower toxicity, the central claim would be refuted.
Extended reading notes
Core claim
The central claim is that any risk model that maps a dose distribution to a patient-specific outcome probability can be integrated into conventional multi-criteria radiotherapy planning as a strictly secondary objective. The authors define a domination cone CA with a parameter epsilon that encodes the maximum acceptable relative worsening of each dose objective for a given risk improvement, and they show, building on prior work, that the resulting bi-level problem can be solved as a single MCO problem. Applying this to 19 NSCLC patients using a logistic regression model for grade 2+ radiation pneumonitis, they report a mean predicted risk reduction of 7.7%, achieved mainly by lowering right-
Load-bearing premise
The reported risk reduction is only as valid as the logistic regression model that predicts radiation pneumonitis from lung V5/V20, smoking, and breathing function; if that model is overfit or the 19 evaluation patients are not independent of the 69 training patients, the improvement could be an artifact of optimizing the same function used to score the plans.
Editorial extensions
If this is right
- For patients whose risk model responds to lung dose, the method automatically finds plans with lower predicted pneumonitis risk while keeping dose objectives near the conventional Pareto front.
- The planner can tune epsilon to reflect trust in the model: smaller epsilon keeps plans close to established dose protocols; larger epsilon allows wider risk–dose trade-offs.
- Conventional MCO is recovered in the limit epsilon to infinity, so the method is a strict generalization rather than a replacement.
- The framework extends to any number of dose objectives, with the caveat that the Sandwiching algorithm's complexity grows quickly with dimensionality.
- Because it produces a full front in one run, it supports navigation and interpolation between plans rather than a single sequential re-optimization.
Reading between the lines
- If the risk model were replaced by a validated multimodal predictor (e.g., imaging or molecular markers), the same machinery would carry patient-specific biology into planning; the method's value lies in being model-agnostic.
- The same bi-level trick could balance multiple competing risk outcomes (e.g., pneumonitis vs. esophagitis) by making the secondary layer an MCO problem itself — the authors note this is feasible but do not test it.
- A testable extension: measure whether the epsilon-tuned fronts actually shift the chosen clinical plan in the direction of lower predicted risk for patients who are predicted high-risk; that would give a direct decision-support use.
- A risky consequence left implicit: if clinicians trust the secondary risk model too much and raise epsilon, plans can drift from evidence-based dose constraints; the paper's selection protocol for the 19-patient comparison partially masks this.
Signed reviews
Editorial analysis
A structured set of objections, weighed in public.
Referee Report
Summary. The paper proposes a multi-criteria optimization (MCO) framework that incorporates a patient-specific risk model as a secondary objective while keeping conventional dose-based objectives primary. The authors encode this priority structure through a modified domination cone with a tunable parameter epsilon and apply a sandwiching algorithm to approximate the resulting front. They retrospectively test the method on 19 NSCLC patients, using a bootstrapped logistic regression model of grade>=2 radiation pneumonitis trained on 69 patients. The main reported result is a mean 7.7% reduction in model-predicted RP risk, along with reductions in lung V5/V20 and small changes in target coverage, from which the authors conclude that risk-guided MCO can reduce RP risk while preserving target coverage.
Significance. The algorithmic idea is interesting: replacing the standard Pareto dominance relation by a cone that makes risk strictly secondary to dose objectives, with epsilon controlling the trade-off, is a clean way to fuse bi-level prioritization with established MCO machinery. The paper gives a formal cone construction, demonstrates extension to three objectives, and provides a detailed retrospective plan comparison on 19 patients. Its clinical significance, however, is not established: the primary endpoint is the prediction of the very model that is minimized during plan generation, so the reported 7.7% risk reduction is a mathematical consequence of the lung dose changes rather than independent evidence of reduced pneumonitis. The manuscript itself concedes that external validation is still needed, and that concession should be reflected in the abstract and conclusions.
major comments (4)
- [§3.2.4 and Eq. (10)] The reported primary outcome is the value r(d) of the logistic model (Eq. 10), which is exactly the secondary objective minimized in problem (9). Since Table 3 lists positive coefficients for right-lung V5 and total-lung V20, the observed reductions in these metrics mechanically lower r(d); the 7.7% mean 'RP risk reduction' is therefore a restatement of the dosimetric changes, not an independent estimate of clinical benefit. The abstract conclusion that the method 'can reduce the risk of RP' is not supported by this evaluation. Please reframe all such statements as reductions in model-predicted risk, or provide an evaluation using observed outcomes or a validated/cross-validated risk model.
- [§3.1.1 and §3.1.3] The risk model was trained on a cohort of 69 NSCLC patients and the evaluation uses 19 patients from 'the NSCLC data set described in Section 3.1.1,' but the manuscript never states whether the 19 are a subset of the 69 or an independent cohort. This distinction is load-bearing: with overlap, the predicted risk reductions are in-sample and would be optimistically biased. The authors must state the cohort relation explicitly; if there is overlap, the risk model should be refit on a disjoint training set or evaluated by cross-validation.
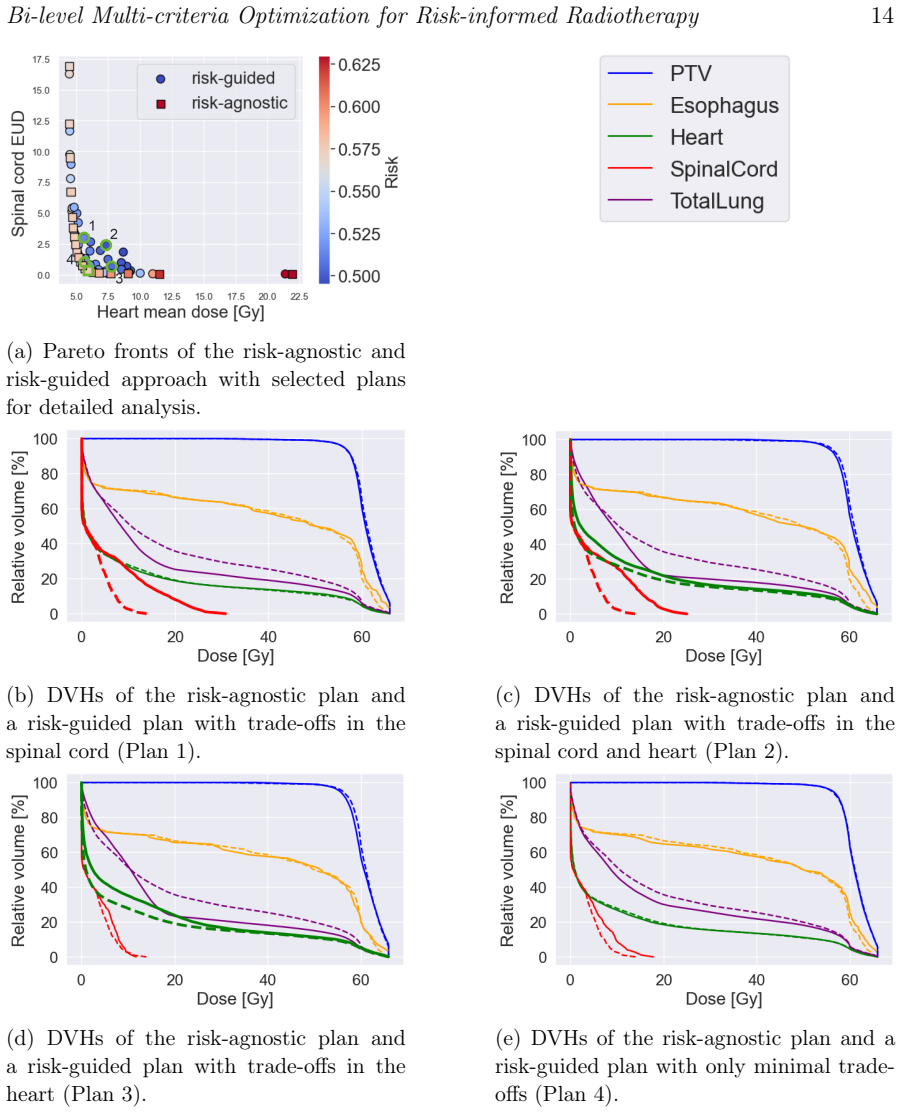
- [§3.1.4] The paired-comparison protocol selects the risk-guided plan as the candidate with the lowest predicted risk among plans within ±30% of the risk-agnostic dose objectives, after a discretionary epsilon filter. This selection rule ensures a nonnegative risk difference by construction, so the mean reduction of 7.73% and range 0.27–20.07% in Table 2 reflect the selection rule more than the typical behavior of the method. Please report results under a fixed, clinically motivated selection rule or summarize the distribution over all acceptable plans, and quantify the sensitivity of the headline numbers to the ±30% window and to the choice of epsilon.
- [§2.1.2 and §4 (Discussion)] The sandwiching algorithm and weighted-sum scalarization are used to approximate the front of a problem whose risk objective (Eq. 10) and volume-percentile functions (Eq. 6) are nonconvex. As the Discussion acknowledges, nonconvex Pareto-optimal points can then be missed, so the generated set may not be 'a good representation of the Pareto front' in the sense assumed by the sandwiching method. The possible magnitude of this effect on the reported risk/dose trade-offs should be assessed or at least stated as a formal limitation of the computed fronts.
minor comments (4)
- [Abstract and §3.1.3] 'logistics regression' should be 'logistic regression'.
- [Table 2] Decimal separators are inconsistent: several entries use commas ('1,145', '-1,06', '2,73') while the rest of the table uses periods. These appear to be typos and should be corrected.
- [§3.2.4] The sentence 'This is not surprising, as our model explicitly posits a positive correlation between these dose metrics and the risk' explicitly acknowledges the circular relationship between the optimized objective and the reported outcome. It should be moved to the limitations/caveats rather than used as an explanation of the result.
- [§2.2.2] The statement 'shrinking epsilon enlarges the domination cone' is initially counterintuitive; a short illustrative explanation or reference to Figure 1 would help the reader.
Circularity Check
The reported 7.7% RP-risk reduction is the same fitted r(d) function minimized by the optimizer, so the headline clinical claim reduces to the optimization objective by construction.
-
fitted input called prediction
[Section 3.1.4; Section 3.2.4/Table 2; Eq. (10)/Table 3]
"Section 3.1.4: 'Finally, we chose the candidate with the lowest predicted risk for the paired comparison.' Section 3.2.4: 'Over all patients, we achieved a mean risk reduction of 7.73%, with values ranging from 0.27% to 20.07%. On average, risk-guided plans show a reduction of V5 to the right lung of 9.48% and a reduction of V20 in the total lung of 7.97%. This is not surprising, as our model explicitly posits a positive correlation between these dose metrics and the risk.' Table 3 lists 'c_RL 3.0849' and 'c_TL 2.2056'."
The logistic risk function r(d) of Eq. (10) is both the secondary objective minimized in problem (9)/Eq. (8) and the outcome metric reported in Table 2. Table 3 gives positive coefficients for right-lung V5 (c_RL) and total-lung V20 (c_TL), so reducing those DVH metrics lowers r(d). Section 3.1.4 then selects the risk-guided plan as the candidate with the lowest r(d) among plans within ±30% of the risk-agnostic dose objectives; the risk-agnostic plan itself is on the risk-guided front (Discussion). Thus the reported mean 7.73% reduction is the decrease of the optimized objective itself, not an observed clinical outcome. No grade≥2 RP events are used in the 19-patient evaluation, and the paper states further validation is needed, so the 'prediction' reduces to the fitted objective by constr
full rationale
The paper is a proof-of-concept for an optimization algorithm, and the bi-level MCO machinery (cone CA, Sandwiching, epsilon trade-off) is not circular: it has independent mathematical content. The circularity is confined to the headline clinical claim. The risk model r(d), fitted in prior work (Ajdari et al. 2022), is used twice: as the objective whose minimization defines the risk-guided plan, and as the measure whose decrease is reported as the benefit. Because the plan is selected by minimizing r(d) and r(d) is increasing in the lung DVH metrics that the optimizer reduces, a positive mean risk reduction is guaranteed by construction whenever a feasible lower-risk plan exists. The paper itself hedges by calling the study a proof-of-concept and saying that internal/external validation is still needed, so this is a circularity in the reported evaluation metric rather than a claim of external clinical validation. The 19-patient cohort's independence from the 69-patient training cohort is also never stated, which is an additional validity threat, but the formal circularity is the identity between objective and endpoint.
Assumptions & free parameters
free parameters (4)
- epsilon (epsilon) =
10 (also 5 and 2.5 in sensitivity)
- dose objective weights w1 ~ w2 for risk-agnostic baseline =
equal weights
- selection window +/-30% and epsilon=10 for plan matching =
+/-30%, epsilon=10
- risk model coefficients c_PBS, c_CS, c_RL, c_TL, c_PBS_RL, c_CS_TL, c_int =
Table 3 (e.g., c_RL=3.0849, c_TL=2.2056)
assumptions (5)
- standard math Weighted-sum scalarization produces Pareto-optimal points for the dose objectives (Ehrgott 2005).
- domain assumption The domination cone C_A with matrix Q correctly encodes the bi-level lexicographic prioritization and its epsilon-approximation (from Schubert & Teichert 2025).
- domain assumption The Sandwiching algorithm yields a guaranteed-quality approximation of the front for problem (9), despite r(d) and V metrics being nonconvex.
- domain assumption The logistic risk model r(d) (Eq. 10) is an unbiased, well-calibrated predictor of RP risk for the evaluation cohort.
- domain assumption The 19 evaluation patients are independent of the 69-patient risk-model training cohort.
Cite this review
Pith. "Pith review of Bi-level Multi-criteria Optimization for Risk-informed Radiotherapy." pith.science (2026). https://pith.science/paper/7UAD2GFP
@misc{pith2026260104821,
  author       = {Pith},
  title        = {Pith review of: Bi-level Multi-criteria Optimization for Risk-informed Radiotherapy},
  year         = {2026},
  howpublished = {\url{https://pith.science/paper/7UAD2GFP}},
  note         = {Machine review of arXiv:2601.04821}
}
read the original abstract
In radiation therapy (RT) treatment planning, multi-criteria optimization (MCO) supports efficient plan selection but is usually solved for population-based dosimetric criteria and ignores patient-specific biological risk, potentially compromising outcomes in high-risk patients. We propose risk-guided MCO, a one-shot method that embeds a clinical risk model into conventional MCO, enabling interactive navigation between dosimetric and biological endpoints. The proposed algorithm uses a special order relation to fuse the classical MCO sandwiching algorithm with bi-level optimization, restricting the Pareto set to plans that achieve improvement in the secondary risk objective for user-defined, acceptable loss in primary clinical objectives. Thus, risk-guided MCO generates risk-optimized counterparts of clinical plans in a single run rather than by sequential or lexicographic planning. To assess the performance, we retrospectively analyzed 19 lung cancer patients treated with RT. The endpoint was the risk of grade 2+ radiation pneumonitis (RP), modeled using bootstrapped stepwise logistics regression with interaction terms, including baseline lung function, smoking history, and dosimetric factors. The risk-guided plans yielded a mean reduction of 8.0% in total lung V20 and 9.5% in right lung V5, translating into an average RP risk reduction of 7.7% (range=0.3%-20.1%), with small changes in target coverage (mean -1.2 D98[%] for CTV) and modest increase in heart dose (mean +1.74 Gy). This study presents the first proof-of-concept for integrating biological risk models directly within multi-criteria RT planning, enabling an interactive balance between established population-wide dose protocols and individualized outcome prediction. Our results demonstrate that the risk-informed MCO can reduce the risk of RP while maintaining target coverage.
Figures


Figures from the paper (8 more)




Reference graph
Works this paper leans on
-
[1]
biologically informed plannin
Introduction Cancer RT is fundamentally a multi-objective decision making process, aiming on the one hand to control cancer progression, and on the other to limit treatment-induced side effects. Thesetwogoalsareofteninconflictwithone-another, asincreasingtheradiation dose would often lead to higher chances of cancer control and simultaneously increased ra...
2017
-
[2]
The risk-agnostic model As a baseline for the assessment of risk-optimized plans, we calculate plans optimized solely for dose objectives
Materials and Methods 2.1. The risk-agnostic model As a baseline for the assessment of risk-optimized plans, we calculate plans optimized solely for dose objectives. These plans are henceforth referred to as risk-agnostic, since nodirectattention is paid to the individualized risk prediction in the optimization. We use a multi-criteria setting that allows...
2005
-
[3]
For our cohort-wide analysis, we examined 19 patients from the NSCLC data set described in Section 3.1.1
Results In the following, we evaluate our proposed method both on a cohort level and a patient specific level. For our cohort-wide analysis, we examined 19 patients from the NSCLC data set described in Section 3.1.1. For all 19 patients, we calculated the fronts for both the risk-agnostic model (Section 2.1) and our proposed model with RP risk as secondar...
2006
-
[4]
A crucial step in this direction is moving beyond one-size-fits-all dose prescriptions which have shaped the design of RT treatment plans for decades
Discussion Propelled by the advances in molecular biology, big data, and AI, the field of radiation oncology is rapidly moving towards more personalized approaches. A crucial step in this direction is moving beyond one-size-fits-all dose prescriptions which have shaped the design of RT treatment plans for decades. Patients with different comorbidity or bi...
2022
-
[5]
Incorporating these risks into treatment planning offers the potential to design plans that are better tailored to a patient’s unique needs
Conclusion Individual factors influence a patient’s risk for specific treatment outcomes. Incorporating these risks into treatment planning offers the potential to design plans that are better tailored to a patient’s unique needs. In this work, we demonstrated how risk prediction models can be integrated into MCO treatment planning as a secondary priority...
-
[6]
radio-oncomics
Appendix 6.1. Risk model for RP The logistic regression model used for predicting RP is r(d) = 1 1 +e−T(d) ,(10) with T(d) =c PBS ·P BS+c CS ·CS+c RL ·V RL[5Gy] (d) +cTL ·V TL[20Gy] (d) +c PBS,RL ·P BS·V RL[5Gy] (d) +cCS,TL ·CS·V TL[20Gy] (d) +c int. The coefficients of the model are recorded in Table 3. Figure 11 shows the bootstrapped- ROC curve and the...
2022
Reviewed August 3, 2026 · model on record in the stance chip above.
Discussion (0). Continue with ORCID to comment.