The Stellar "Snake"-III: Co-evolution of Stars and Molecular Clouds Unveiled by Gaia, MWISP, and LAMOST
Pith reviewed 2026-05-13 18:41 UTC · model grok-4.3
The pith
Snake-like stellar chains are relics of step-by-step star formation inside giant molecular clouds.
A machine-rendered reading of the paper's core claim, the machinery that carries it, and where it could break.
Core claim
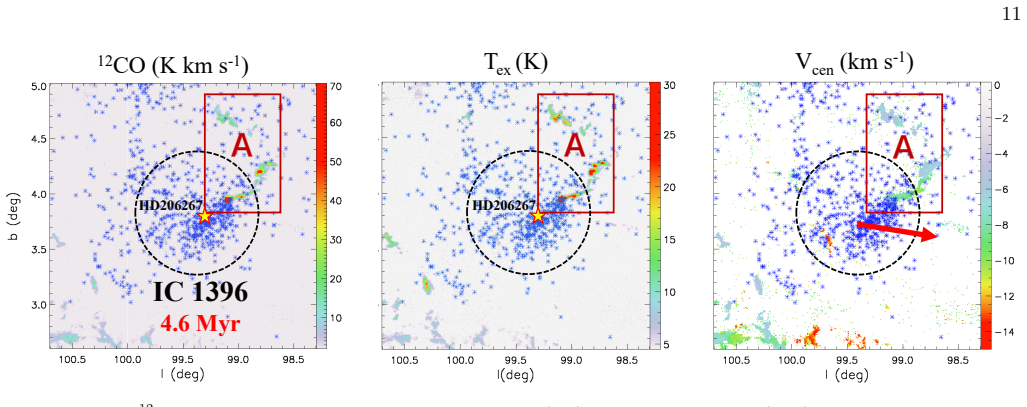
Combining multi-band data from Gaia DR3, MWISP CO, and LAMOST DR11, the analysis identifies 5683 member stars with a median age of 7.6 Myr and 12 embedded open clusters in the Snake III structure. Molecular cloud density increases along the structure, older clusters sit in cavities near denser areas, and young stars form in current high-density zones. CO temperature, velocity, and dispersion plus H-alpha emission indicate early feedback compresses edges then disperses clouds, with the youngest cluster ASCC 125 near the densest gas showing shell-like perturbations from stellar winds and a possible supernova.
What carries the argument
5-D phase-space selection of stars combined with BEEP distances and CO velocities to associate the stellar complex with its parent molecular clouds.
Load-bearing premise
The 5-D phase-space selection and BEEP distances with CO velocities correctly identify physically associated stars and clouds without major contamination from unrelated objects along the line of sight.
What would settle it
If the spatial and velocity overlaps between the selected stars and CO clouds are no stronger than expected from random alignments in the galactic plane.
Figures




read the original abstract
By combining multi-band data from Gaia DR3, MWISP CO, and LAMOST DR11 LSR/MSR, we investigate the co-evolution of stars and their parent molecular cloud in a snake-like stellar structure, named Snake III. Based on 5-D phase-space selection, we identified 5683 member stars (median age 7.6 Myr) across approximately $300 \times 500 \times 175$ pc$^3$ volume, along with 12 embedded open clusters. Then we use BEEP distances combined with $^{12}$CO velocities to clearly identify the molecular clouds associated with the stellar complex in spatial and kinematics. The molecular cloud density increases with Galactic longitude, with older open clusters forming in cavities near higher-density regions (except ASCC 125), while young field stars currently form preferentially in present-day high-density environments, indicating that cloud density regulates the star-formation sequence. $^{12}$CO excitation temperature, centroid velocity, velocity dispersion and H$\alpha$ emission reveal that early feedback first compresses cloud edges to trigger new stars, then sweeps and disperses the parent clouds. The extremely young cluster (ASCC 125, 4.4 Myr) lies near the densest region yet is surrounded by a shell with bidirectional density-velocity perturbations, consistent with a delayed-triggering scenario under the combined influence of UBC 178 stellar-wind feedback and a suspected supernova blast. Our results naturally demonstrate that snake-like stellar structures are filamentary relics of hierarchical star formation within giant molecular clouds. They provide direct observational evidence that cloud density and early feedback jointly modulate the progression of star formation, offering a clear and young laboratory for studying star-cloud co-evolution.
Editorial analysis
A structured set of objections, weighed in public.
Referee Report
Summary. The manuscript investigates the co-evolution of stars and molecular clouds in the Snake III stellar structure by combining Gaia DR3, MWISP CO, and LAMOST DR11 data. It identifies 5683 member stars (median age 7.6 Myr) and 12 open clusters using 5D phase-space selection in a volume of approximately 300 × 500 × 175 pc³. Molecular clouds are associated using BEEP distances and 12CO velocities, revealing that cloud density regulates the star-formation sequence, with early feedback compressing cloud edges and dispersing parent clouds. The results suggest that snake-like structures are filamentary relics of hierarchical star formation modulated by cloud density and feedback.
Significance. If the physical associations hold, this provides direct observational evidence for hierarchical star formation within giant molecular clouds and the joint modulation by cloud density and early feedback. The large multi-tracer sample offers a clear young laboratory for star-cloud co-evolution studies, with potential to inform models of density-regulated progression and feedback effects.
major comments (1)
- [Abstract] Abstract: The central claim that snake-like structures are filamentary relics of hierarchical star formation modulated by cloud density and early feedback rests on the 5-D phase-space selection plus BEEP distances and 12CO velocities accurately identifying physically associated members without significant projection effects. Over the 300×500×175 pc³ volume, no quantitative contamination fraction, completeness estimate, or control-field test is referenced, leaving open the possibility that field stars or unrelated clouds with overlapping velocities contaminate the sample and affect the reported age–density–feedback correlations.
minor comments (1)
- [Abstract] Abstract: The reported numbers (5683 stars, median age 7.6 Myr) would benefit from accompanying error bars, membership probability thresholds, or uncertainty ranges to allow readers to assess robustness directly from the summary.
Simulated Author's Rebuttal
We thank the referee for the constructive and detailed review of our manuscript. We address the major comment below and will incorporate the suggested improvements in the revised version to better substantiate the robustness of our member selection and physical associations.
read point-by-point responses
-
Referee: [Abstract] Abstract: The central claim that snake-like structures are filamentary relics of hierarchical star formation modulated by cloud density and early feedback rests on the 5-D phase-space selection plus BEEP distances and 12CO velocities accurately identifying physically associated members without significant projection effects. Over the 300×500×175 pc³ volume, no quantitative contamination fraction, completeness estimate, or control-field test is referenced, leaving open the possibility that field stars or unrelated clouds with overlapping velocities contaminate the sample and affect the reported age–density–feedback correlations.
Authors: We agree that explicit quantitative validation of the sample is necessary to support the central claims. The current manuscript describes the 5D phase-space selection (proper motions, parallaxes from Gaia DR3, radial velocities from LAMOST) in Section 2 but does not include the requested contamination or completeness metrics. In the revised manuscript, we will add a new subsection (Section 2.3) that: (1) applies identical selection criteria to a control field at similar Galactic latitude but offset by ~5° in longitude to quantify the contamination fraction; (2) estimates completeness using the Gaia DR3 selection function and synthetic populations matched to our volume; and (3) demonstrates the kinematic coherence by comparing the 12CO velocity distribution of associated clouds against the control field and field stars. These results will be summarized in the abstract and used to qualify the age–density–feedback correlations. The combination of precise BEEP distances and tight velocity matching already reduces projection effects, but the new tests will provide the quantitative support requested. revision: yes
Circularity Check
No significant circularity; claims rest on external survey data
full rationale
The paper identifies 5683 member stars and 12 clusters via 5-D phase-space selection from Gaia DR3, then associates them with molecular clouds using BEEP distances and 12CO velocities from MWISP. These steps rely on direct observational cross-matching over the stated volume rather than any fitted parameter, self-defined quantity, or prediction that reduces to the input selection by construction. No equations appear that rename or force the reported density-age-feedback sequence; the co-evolution interpretation follows from the spatial-kinematic associations themselves. The analysis is therefore self-contained against the cited external catalogs with no load-bearing self-citation or ansatz smuggling required for the central claim.
Axiom & Free-Parameter Ledger
axioms (2)
- domain assumption 5-D phase-space selection accurately isolates true member stars of the complex
- domain assumption BEEP distances plus CO velocities correctly link molecular clouds to the stellar structure in 3D
Reference graph
Works this paper leans on
-
[1]
, " * write output.state after.block = add.period write newline
ENTRY address archivePrefix author booktitle chapter doi edition editor eprint howpublished institution journal key month number organization pages publisher school series title misctitle type volume year version url label extra.label sort.label short.list INTEGERS output.state before.all mid.sentence after.sentence after.block FUNCTION init.state.consts ...
-
[2]
" write newline "" before.all 'output.state := FUNCTION format.url url empty "" new.block "" url * "" * if FUNCTION format.eprint eprint empty "" archivePrefix empty "" archivePrefix "arXiv" = new.block " " eprint * " " * new.block " " eprint * " " * if if if FUNCTION format.doi doi empty "" " " doi * " " * if FUNCTION format.pid doi empty eprint empty ur...
-
[3]
thebibliography [1] 20pt to REFERENCES 6pt =0pt \@twocolumntrue 12pt -12pt 10pt plus 3pt =0pt =0pt =1pt plus 1pt =0pt =0pt -12pt =13pt plus 1pt =20pt =13pt plus 1pt \@M =10000 =-1.0em =0pt =0pt 0pt =0pt =1.0em @enumiv\@empty 10000 10000 `\.\@m \@noitemerr \@latex@warning Empty `thebibliography' environment \@ifnextchar \@reference \@latexerr Missing key o...
discussion (0)
Sign in with ORCID, Apple, or X to comment. Anyone can read and Pith papers without signing in.