Optical observations and atomic environment of supernova remnant G25.1-2.3
Pith reviewed 2026-05-13 18:30 UTC · model grok-4.3
The pith
Optical spectra identify shock-heated gas and electron densities in supernova remnant G25.1-2.3 along with a matching HI hole.
A machine-rendered reading of the paper's core claim, the machinery that carries it, and where it could break.
Core claim
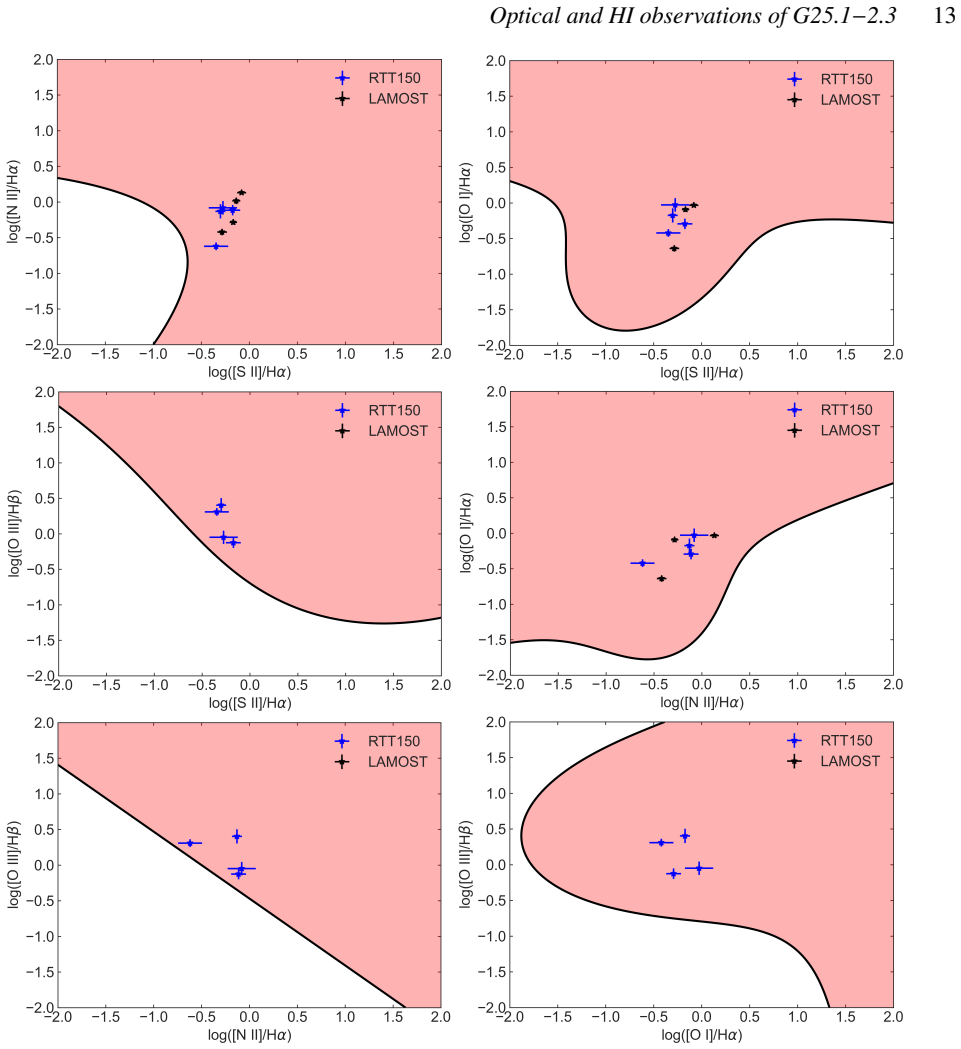
The paper claims that optical spectra of G25.1-2.3 show [SII]/Hα ratios of 0.16-0.83 that identify shock-heated gas in the north and south, with [SII] doublet ratios yielding electron densities of 120-1030 cm^{-3} (north) and 490-4500 cm^{-3} (south), while Hα images display filamentary and diffuse emission and a new hole-like HI structure aligns with the SNR diameter, enabling an evolutionary stage estimate via the Σ-D relation.
What carries the argument
The [SII]/Hα emission line ratio used as a diagnostic to separate shock-heated gas from photoionized gas, together with the [SII] λ6716/λ6731 ratio for calculating local electron density.
If this is right
- Shock-heated gas is confirmed in the northern and southern regions of the remnant.
- Electron densities are systematically higher in the south than in the north.
- The HI hole provides direct evidence of the remnant's interaction with surrounding atomic gas.
- The remnant's evolutionary stage can be constrained by its position on the surface brightness-diameter relation.
Where Pith is reading between the lines
- Density contrasts between north and south imply the remnant is expanding into a clumpy interstellar medium.
- The optical filaments likely trace current locations of the shock front.
- The photoionized regions may be shaped by radiation from the SNR or nearby stars.
Load-bearing premise
The assumption that standard [SII]/Hα ratios can be applied directly to identify shock-heated gas without major interference from local abundance variations, temperature differences, or other emission sources.
What would settle it
New spectra showing [SII]/Hα ratios below 0.4 throughout the northern and southern regions or an HI map whose hole-like feature fails to match the radio boundary of the SNR.
Figures



read the original abstract
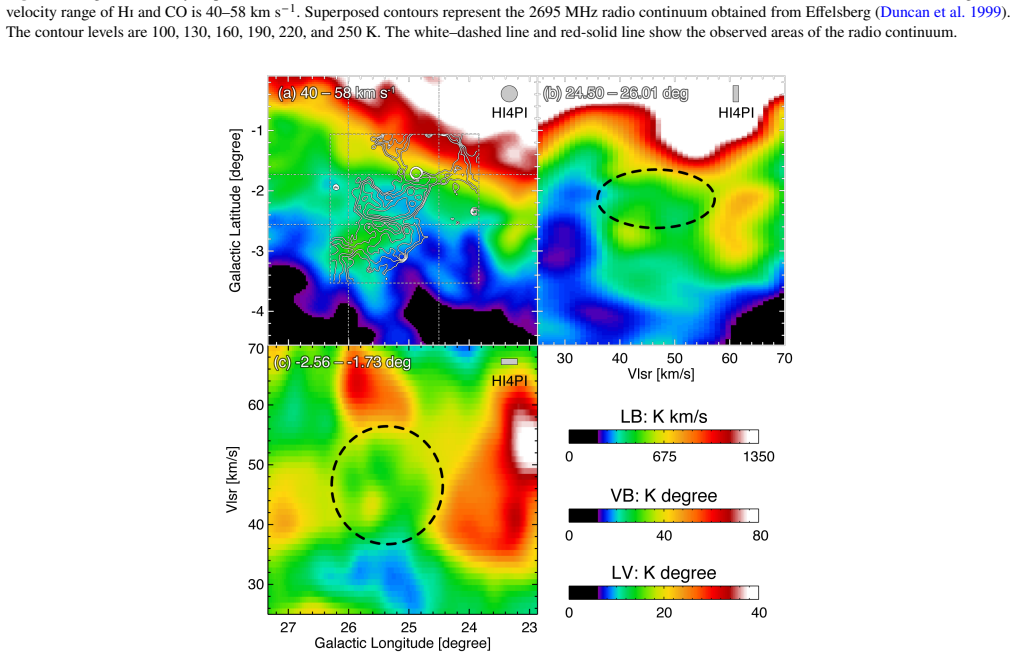
The supernova remnant (SNR) G25.1-2.3 was identified in the radio band during the Sino-German $\lambda$6 cm survey of the Galactic plane. We present a detailed investigation of the optical, HI, and CO emission towards the G25.1-2.3 to better understand its characteristics and environment. In this study, optical spectroscopic data of the remnant and its environment have been analysed for the first time, providing new insights into their emission properties. The Large Sky Area Multi-Object Fiber Spectroscopic Telescope (LAMOST) and 1.5-m Russian-Turkish Telescope (RTT150) data show variations across the observed regions, with [SII]/H$\alpha$ ranging from 0.16 to 0.83. We identified shock-heated gas in the northern and southern regions and several photoionized regions around the SNR based on their [SII]/H$\alpha$ ratios derived from spectra. The [SII]$\lambda$6716/$\lambda$6731 ratio observed in the northern region suggests electron densities ($n_{\rm e}$) ranging from 120 to 1030 cm$^{-3}$, whereas the southern regions show higher values, between 490 and 4500 cm$^{-3}$. The variations in the observed H$\alpha$/H$\beta$ ratios indicate significant differences in extinction across the regions. H$\alpha$ images obtained using the 1-m Turkish Telescope (T100) reveal optical emission in the northern and southern, characterized by filamentary and diffuse structures. We newly found a hole-like distribution of HI, whose spatial extent is roughly consistent with the diameter of the SNR. Based on radio data, we examine the evolutionary stage of G25.1-2.3 using the surface brightness-diameter ($\Sigma-D$) relation and the equipartition method.
Editorial analysis
A structured set of objections, weighed in public.
Referee Report
Summary. The manuscript presents the first optical spectroscopic observations of SNR G25.1-2.3 using LAMOST and RTT150 data, reporting [SII]/Hα ratios from 0.16 to 0.83 that identify shock-heated gas in northern and southern regions, electron densities of 120–1030 cm^{-3} (north) and 490–4500 cm^{-3} (south) from the [SII] λ6716/λ6731 ratio, extinction variations from Hα/Hβ, filamentary Hα structures from T100 imaging, a new HI hole matching the SNR diameter, and evolutionary stage assessment via radio Σ-D relation and equipartition.
Significance. If the shock identifications hold after proper corrections, the work adds the first optical spectroscopy for this SNR along with a spatially matching HI cavity, strengthening multi-wavelength characterization of its ISM interaction and evolutionary status. The combination of spectroscopy, imaging, and radio analysis is a clear strength.
major comments (3)
- [Abstract] Abstract and spectroscopic results section: The [SII]/Hα ratios (0.16–0.83) used to classify shock-heated gas (threshold ~0.4) are presented without explicit dereddening corrections, despite noted significant Hα/Hβ variations implying differential extinction. With [SII] and Hα separated by ~150 Å, A_V differences of 1–2 mag can shift the ratio by 10–20 %, risking misclassification near the diagnostic boundary.
- [Results] Spectroscopic analysis and density derivation: No uncertainties or error bars are reported for the [SII]/Hα ratios or the derived n_e values, and there is no discussion of potential systematics from local abundance variations, temperature gradients, or inner-Galaxy line-of-sight effects on the standard solar-abundance shock thresholds.
- [HI observations] HI distribution section: The claim of a newly identified hole-like HI distribution whose extent matches the SNR diameter lacks quantitative metrics (e.g., overlap statistics, position-velocity analysis, or comparison to random fields) to establish that the match is not coincidental.
minor comments (3)
- [Abstract] Abstract: The title refers to 'atomic environment' but the text emphasizes HI and CO; clarify the intended meaning of 'atomic'.
- [Observations] Methods: Expand data reduction, flux calibration, and any applied extinction or telluric corrections for LAMOST and RTT150 spectra to ensure reproducibility.
- [Figures] Figures: Add SNR radio contours, north/south region labels, and scale bars to the Hα and HI maps for direct visual comparison.
Simulated Author's Rebuttal
We thank the referee for the detailed and constructive report. We have addressed each major comment below with revisions to strengthen the manuscript. All changes will be incorporated in the revised version.
read point-by-point responses
-
Referee: [Abstract] Abstract and spectroscopic results section: The [SII]/Hα ratios (0.16–0.83) used to classify shock-heated gas (threshold ~0.4) are presented without explicit dereddening corrections, despite noted significant Hα/Hβ variations implying differential extinction. With [SII] and Hα separated by ~150 Å, A_V differences of 1–2 mag can shift the ratio by 10–20 %, risking misclassification near the diagnostic boundary.
Authors: We agree that differential extinction should be accounted for to ensure robust classification. In the revised manuscript we will compute and report dereddened [SII]/Hα ratios using the observed Hα/Hβ values for each region, following the standard extinction law. We will also add a short discussion quantifying the maximum possible shift in the ratio for the observed A_V range and confirm that the shock identifications remain valid after correction. revision: yes
-
Referee: [Results] Spectroscopic analysis and density derivation: No uncertainties or error bars are reported for the [SII]/Hα ratios or the derived n_e values, and there is no discussion of potential systematics from local abundance variations, temperature gradients, or inner-Galaxy line-of-sight effects on the standard solar-abundance shock thresholds.
Authors: We accept this criticism. The revised version will include 1σ uncertainties on all [SII]/Hα ratios and n_e values propagated from the spectral fitting and continuum subtraction. We will also add a concise paragraph addressing possible systematics, noting that the standard solar-abundance thresholds remain appropriate given the modest deviations expected in the inner Galaxy and that our measured ratios lie sufficiently far from the 0.4 boundary in the shock-classified regions. revision: yes
-
Referee: [HI observations] HI distribution section: The claim of a newly identified hole-like HI distribution whose extent matches the SNR diameter lacks quantitative metrics (e.g., overlap statistics, position-velocity analysis, or comparison to random fields) to establish that the match is not coincidental.
Authors: We will strengthen this section by adding quantitative support. Specifically, we will report the fractional overlap area between the HI depression and the radio continuum boundary, together with a position-velocity slice through the cavity that shows the expected kinematic signature. These additions will demonstrate that the spatial coincidence is not random. revision: yes
Circularity Check
No circularity: direct observational measurements using established diagnostics
full rationale
The paper reports new optical spectra from LAMOST and RTT150 telescopes, directly measuring [SII]/Hα ratios (0.16–0.83) and [SII] λ6716/λ6731 ratios to derive electron densities (120–4500 cm^{-3}) and classify regions as shock-heated or photoionized. These steps apply standard, externally established diagnostic thresholds to fresh data without fitting any parameters to the target dataset or deriving results by construction from the same inputs. The HI hole is identified from independent radio observations whose spatial match to the SNR diameter is reported as a new finding. The Σ-D evolutionary analysis uses the standard radio surface-brightness relation on existing radio data. No self-citation chain, ansatz smuggling, or renaming of fitted quantities occurs; the derivation chain is self-contained against external benchmarks.
Axiom & Free-Parameter Ledger
axioms (2)
- domain assumption Standard [SII]/Hα line ratios reliably distinguish shock-heated from photoionized gas
- domain assumption The surface brightness-diameter (Σ-D) relation can be used to assess the evolutionary stage of SNRs
Reference graph
Works this paper leans on
-
[1]
Aktekin E., Bakış H., Bakış V., Sezer A., 2025, MNRAS, 543, 761 Alarie A., Drissen L., 2019, MNRAS, 489, 3042 Alsaberi R. Z. E., et al., 2024, MNRAS, 527, 1444 Anderson L. D., et al., 2017, A&A, 605, A58 Anderson L. D., et al., 2025, A&A, 693, A247 Araya M., 2023, MNRAS, 518, 4132 Araya M., 2024, A&A, 691, A225 ArbutinaB.,UroševićD.,AndjelićM.M.,PavlovićM...
work page 2025
discussion (0)
Sign in with ORCID, Apple, or X to comment. Anyone can read and Pith papers without signing in.