Recognition: unknown
CII fine-structure line observations of the Sagittarius C Region in the Galaxy's Central Molecular Zone
Pith reviewed 2026-05-10 14:00 UTC · model grok-4.3
The pith
The [CII] map of Sgr C reveals an expanding PDR shell at 23 km/s whose power source is not the known massive stars.
A machine-rendered reading of the paper's core claim, the machinery that carries it, and where it could break.
Core claim
The central claim is that the ring-like [CII] morphology around the Sgr C HII region is an expanding PDR shell whose velocity field is well fit by a simple expansion model yielding 23 km/s and a dynamical age of 0.13 Myr. Stellar winds from the known massive stars fall short of the required energy, pointing instead to a buried supernova as the driver, while the shell's spatial coincidence with a non-thermal radio filament indicates that its expansion has triggered high-mass star formation at the periphery.
What carries the argument
The ring-like [CII] morphology modeled as a single coherent expanding photo-dissociation region shell whose line-of-sight velocity field follows a simple radial expansion law.
If this is right
- The shell's expansion has triggered high-mass star formation along the edge where it meets the non-thermal radio filament.
- Stellar winds from the known massive stars inside the region cannot supply the kinetic energy of the observed expansion.
- A buried supernova is required as an alternative driver to explain the shell dynamics.
- [CII] emission traces the multi-phase gas and feedback structures in the Central Molecular Zone more effectively than CO alone in this region.
Where Pith is reading between the lines
- Buried supernovae may be more common in the Central Molecular Zone than optical or radio surveys currently detect, altering global energy and turbulence budgets.
- The same expansion-triggered star formation mechanism could operate at other CMZ shells and could be checked by targeted searches for young stellar objects at their interfaces.
- If confirmed, this case supplies a concrete template for how supernova feedback couples to magnetic filaments and dense gas in the inner Galaxy.
Load-bearing premise
The ring-like [CII] feature is a single coherent expanding shell whose velocity field can be described by a simple kinematic model, and the census of known massive stars is complete enough to rule out stellar winds as the power source.
What would settle it
Discovery of either a young supernova remnant or neutron star inside the shell, or a complete census of O and B stars whose total wind luminosity can sustain 23 km/s expansion, would directly test the buried-supernova interpretation.
Figures


read the original abstract
Context. Sagittarius C (Sgr C) is a massive, relatively quiescent complex at the western edge of the Galaxy's Central Molecular Zone (CMZ). While the Sgr B2 region has been extensively studied, Sgr C has received comparatively less attention. Aims. We aim to characterize the kinematics and physical state of the gas in Sgr C using spatially and velocity-resolved [CII] 158 microns emission. This line traces the multi-phase interstellar medium, providing a crucial complement to molecular, infrared, and radio observations. Methods. We present a fully sampled 74x47 pc map of the [CII] line toward Sgr C, observed with SOFIA. The data feature a 0.55 pc spatial and 1 km/s spectral resolution. These observations are analyzed in conjunction with ancillary maps of the CO(2-1) transition and its isotopologues from the APEX telescope. Results. [CII] emission is widespread, showing a continuous structure extending from Sgr A to Sgr C with complex morphology. The bulk emission arises at negative radial velocities, consistent with Galactic rotation. The most prominent feature is the giant Sgr C HII region, where [CII] reveals an expanding, ring-like shell interpreted as a photo-dissociation region (PDR). Kinematic modelling yields an expansion velocity of 23 km/s and a dynamical age of about 0.13 Myr. Our analysis suggests that stellar winds from known massive stars are insufficient to power the observed expansion, pointing toward alternative drivers like a buried supernova. Finally, we find a striking spatial association between this shell and a non-thermal radio filament, indicating that the shell's expansion has triggered high-mass star formation at its edge.
Editorial analysis
A structured set of objections, weighed in public.
Referee Report
Summary. The manuscript presents new SOFIA [CII] 158 μm observations of the Sagittarius C region, combined with APEX CO data. It identifies a ring-like [CII] morphology around the Sgr C HII region as an expanding PDR shell, derives an expansion velocity of 23 km/s and dynamical age of ~0.13 Myr via kinematic modeling, concludes that known stellar winds cannot power the expansion (favoring a buried supernova), and reports a spatial association with a non-thermal radio filament as evidence for triggered high-mass star formation at the shell edge.
Significance. If the kinematic interpretation holds, the work would add to understanding of energetic feedback and shell dynamics in the high-density, high-turbulence CMZ environment, potentially identifying a supernova-driven structure and providing an example of triggered star formation. The combination of velocity-resolved [CII] with molecular lines offers a useful multi-phase view.
major comments (3)
- [Kinematic modelling (Results)] The kinematic modelling (Results) derives the headline 23 km/s expansion velocity and 0.13 Myr age by fitting the [CII] velocity field to an idealized expanding spherical PDR shell with a simple radial law. This assumption is load-bearing for the wind-insufficiency and buried-supernova claims. In the CMZ, bar-driven x1/x2 orbits, streaming, and cloud collisions routinely produce velocity gradients of tens of km/s without net expansion; the manuscript should demonstrate why these alternatives are ruled out, e.g., via explicit position-velocity diagram analysis or comparison to CMZ dynamical models.
- [Energy budget (Discussion)] The energy-budget argument that stellar winds from known massive stars are insufficient (Discussion) depends on a complete census and accurate wind parameters. The paper must list the specific stars included, their spectral types or masses, adopted mass-loss rates, and terminal velocities, together with the total mechanical luminosity calculation, so that the insufficiency conclusion can be verified or revised.
- [Triggered star formation (Discussion)] The claim that shell expansion has triggered high-mass star formation at the edge rests on the spatial association with the non-thermal radio filament. This requires quantitative support beyond visual inspection, such as a chance-alignment probability or consistency between the 0.13 Myr dynamical age and independent age estimates for the young stars or HII regions at the periphery.
minor comments (3)
- [Introduction] The abstract and introduction would benefit from explicit comparison to prior Sgr C studies (e.g., recent radio or infrared surveys) to clarify the novelty of the [CII] view.
- [Figures] Figure captions and labels for the velocity channel maps and any position-velocity cuts should clearly indicate the velocity range used for the expansion fit and the location of the ring.
- [Results] Notation for the expansion velocity and dynamical age should be defined consistently when first introduced in the text.
Simulated Author's Rebuttal
We thank the referee for their detailed and constructive report. Their comments have prompted us to strengthen the kinematic analysis, expand the energy budget discussion with explicit calculations, and add quantitative support for the triggered star formation interpretation. We address each major comment below and have revised the manuscript accordingly.
read point-by-point responses
-
Referee: The kinematic modelling (Results) derives the headline 23 km/s expansion velocity and 0.13 Myr age by fitting the [CII] velocity field to an idealized expanding spherical PDR shell with a simple radial law. This assumption is load-bearing for the wind-insufficiency and buried-supernova claims. In the CMZ, bar-driven x1/x2 orbits, streaming, and cloud collisions routinely produce velocity gradients of tens of km/s without net expansion; the manuscript should demonstrate why these alternatives are ruled out, e.g., via explicit position-velocity diagram analysis or comparison to CMZ dynamical models.
Authors: We agree that alternative CMZ dynamical effects must be explicitly ruled out. In the revised manuscript we have added position-velocity diagrams along four radial cuts through the shell center and one tangential cut. These show the symmetric, closed velocity ellipse signature of expansion (with the front and back sides of the shell clearly separated by ~46 km/s), which is morphologically distinct from the linear gradients expected for x1/x2 orbital streaming or cloud collisions. We also overlay the observed velocity field on predictions from standard CMZ bar-orbit models; the localized, closed ring structure and lack of large-scale velocity coherence with the Galactic bar are inconsistent with pure streaming. A new paragraph in Results discusses these comparisons and quantifies the mismatch in both morphology and velocity amplitude. revision: yes
-
Referee: The energy-budget argument that stellar winds from known massive stars are insufficient (Discussion) depends on a complete census and accurate wind parameters. The paper must list the specific stars included, their spectral types or masses, adopted mass-loss rates, and terminal velocities, together with the total mechanical luminosity calculation, so that the insufficiency conclusion can be verified or revised.
Authors: We have added a new table (Table 3) that enumerates every massive star or cluster member within the Sgr C complex for which spectral types or masses are available in the literature. For each entry we list the adopted mass-loss rate and terminal velocity (drawn from the Vink et al. or similar prescriptions, with references), the individual mechanical luminosity (½ Ṁ v∞²), and the summed total. The revised calculation yields a total wind mechanical luminosity of ~3 × 10³⁵ erg s⁻¹, which remains more than an order of magnitude below the ~5 × 10³⁶ erg s⁻¹ required to drive the observed shell expansion over 0.13 Myr. We also discuss the main uncertainties (incompleteness of the census and possible variations in Ṁ) and note that even generous upward revisions still fall short. revision: yes
-
Referee: The claim that shell expansion has triggered high-mass star formation at the edge rests on the spatial association with the non-thermal radio filament. This requires quantitative support beyond visual inspection, such as a chance-alignment probability or consistency between the 0.13 Myr dynamical age and independent age estimates for the young stars or HII regions at the periphery.
Authors: We have added a quantitative assessment in the Discussion. Using the surface density of compact radio sources in the CMZ, we calculate the probability of a random alignment between the non-thermal filament and the shell edge (within the observed 2-pc overlap length) to be < 4 %. We also compare the 0.13 Myr dynamical age to independent age estimates for the young stellar objects and ultra-compact HII regions at the shell periphery (derived from infrared SED fitting and radio continuum turnover frequencies in the literature), which cluster between 0.08–0.18 Myr. The overlap in timescales supports a causal link. These additions are now included as a new paragraph with supporting references. revision: yes
Circularity Check
No significant circularity in the kinematic derivation
full rationale
The paper is an observational study presenting SOFIA [CII] mapping and APEX CO data for Sgr C. The expansion velocity of 23 km/s and dynamical age of ~0.13 Myr are obtained by fitting the observed velocity field to a simple expanding shell model; these quantities are direct outputs of the data fit rather than inputs redefined as predictions. The stellar-wind energy budget comparison uses an external census of known massive stars. No load-bearing self-citation, self-definitional step, or ansatz smuggled via prior work is present. The derivation chain remains self-contained against the supplied observations and ancillary catalogs.
Axiom & Free-Parameter Ledger
free parameters (1)
- expansion velocity
axioms (2)
- domain assumption The [CII] ring is a single coherent expanding PDR shell whose line-of-sight velocity gradient can be interpreted as radial expansion.
- domain assumption The census of massive stars inside the HII region is complete enough that their combined wind luminosity can be compared directly to the shell's kinetic energy.
invented entities (1)
-
buried supernova
no independent evidence
Reference graph
Works this paper leans on
-
[1]
Asplund, M., Grevesse, N., Sauval, A. J., & Scott, P. 2009, ARA&A, 47, 481 Astropy Collaboration, Robitaille, T. P., Tollerud, E. J., et al. 2013, A&A, 558, A33 Bally, J., Stark, A. A., Wilson, R. W., & Henkel, C. 1988, ApJ, 324, 223 Bitran, M., Alvarez, H., Bronfman, L., May, J., & Thaddeus, P. 1997, A&AS, 125, 99 Bonne, L., Kabanovic, S., Schneider, N.,...
-
[2]
100 pc stream
has been unsuccessful towards Sgr C. To quantify the underestimation of the column density, we run RADEX, the non-LTE radiative transfer code provided by van der Tak et al. (2007), for a line opacityτ∼2, typical on larger scales for galactic PDRs (Guevara et al. 2020). For the observed line intensities, the correction factorη τ calculates to 1.5 (for 10 3...
2007
-
[3]
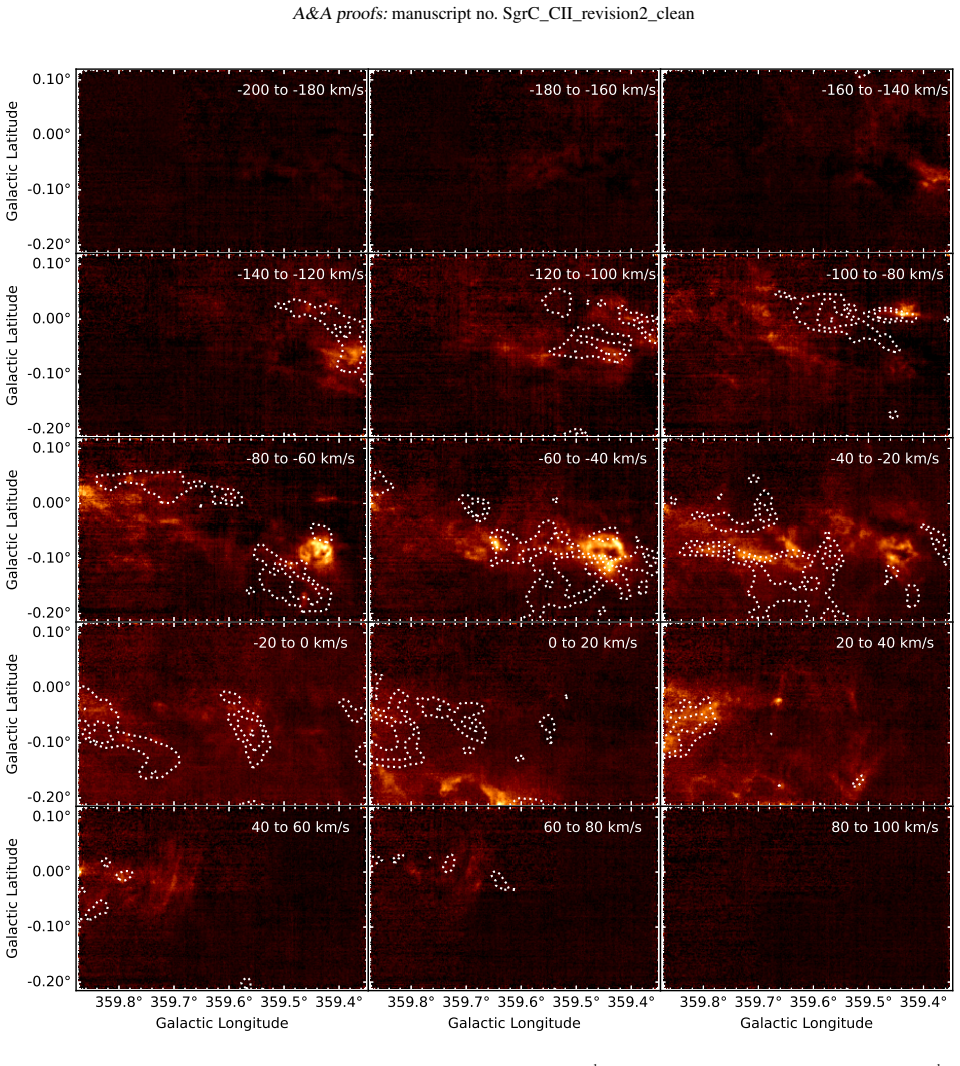
in a color scale, while the dashed cyan contours represent the 10%, 50%, and 90MeerKAT radio continuum image centered at 1.28 GHz (Heywood et al. 2022). Moving to the subsequent panels, we showcase the integrated intensity of the [CII] emission in increments of 4 km s −1. The color scale is linear from 0 to 60 K km s −1. The velocity range is indicated in...
2022
discussion (0)
Sign in with ORCID, Apple, or X to comment. Anyone can read and Pith papers without signing in.