Recognition: unknown
Mid-infrared JWST spectra of carbon stars in the Large Magellanic Cloud
Pith reviewed 2026-05-09 22:42 UTC · model grok-4.3
The pith
C3 molecule produces strong absorption at 5.2 microns in carbon stars of the Large Magellanic Cloud
A machine-rendered reading of the paper's core claim, the machinery that carries it, and where it could break.
Core claim
High-resolution mid-infrared spectra reveal that the C3 molecule is responsible for a strong absorption band centered at 5.2 um in carbon stars. CS appears in stars with less dust, and HCN may be present as well. Spectral changes between Spitzer and JWST epochs are mostly attributable to the pulsation cycle. A dip at about 10 um, possibly from an unknown carrier or variable molecular emission, together with the C2H2 band at 14 um, indicates that some prior detections of weak SiC dust emission could be spurious.
What carries the argument
Comparison of JWST Medium Resolution Spectrometer spectra with prior Spitzer Infrared Spectrograph data to isolate molecular absorption bands such as C3 and evaluate dust features like SiC.
If this is right
- More accurate modeling of molecular chemistry in carbon-rich stellar envelopes.
- Reassessment of dust composition in carbon stars based on clearer separation of molecular and dust contributions.
- Improved understanding of how pulsation affects observed spectra in these variable stars.
- Potential revision of dust production rates derived from earlier mid-IR observations.
Where Pith is reading between the lines
- This work could lead to better predictions of infrared spectra for carbon stars in other low-metallicity environments.
- Distinguishing the 10 um feature might require phase-resolved observations across the pulsation cycle.
- The findings highlight the value of JWST for resolving ambiguities in Spitzer data for evolved stars.
Load-bearing premise
The 10-micron dip is not produced by any known molecular or dust feature already included in the analysis, and the observed changes between observation epochs are driven mainly by stellar pulsation rather than other forms of variability.
What would settle it
Laboratory spectra or atmospheric models that reproduce the exact shape of the 10 um dip using only known molecules and dust species would show that the dip does not undermine previous SiC detections.
Figures


read the original abstract
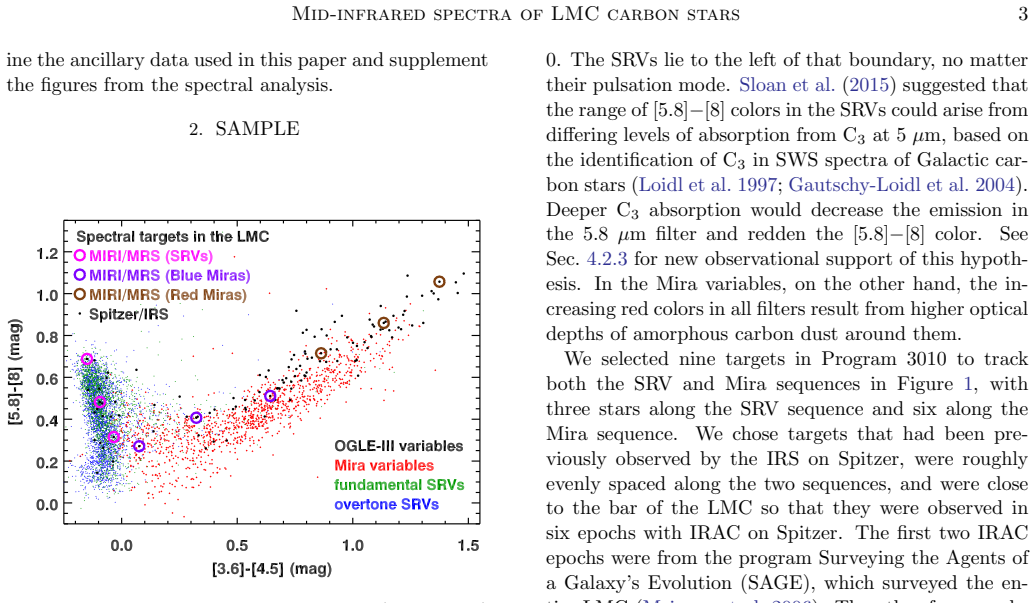
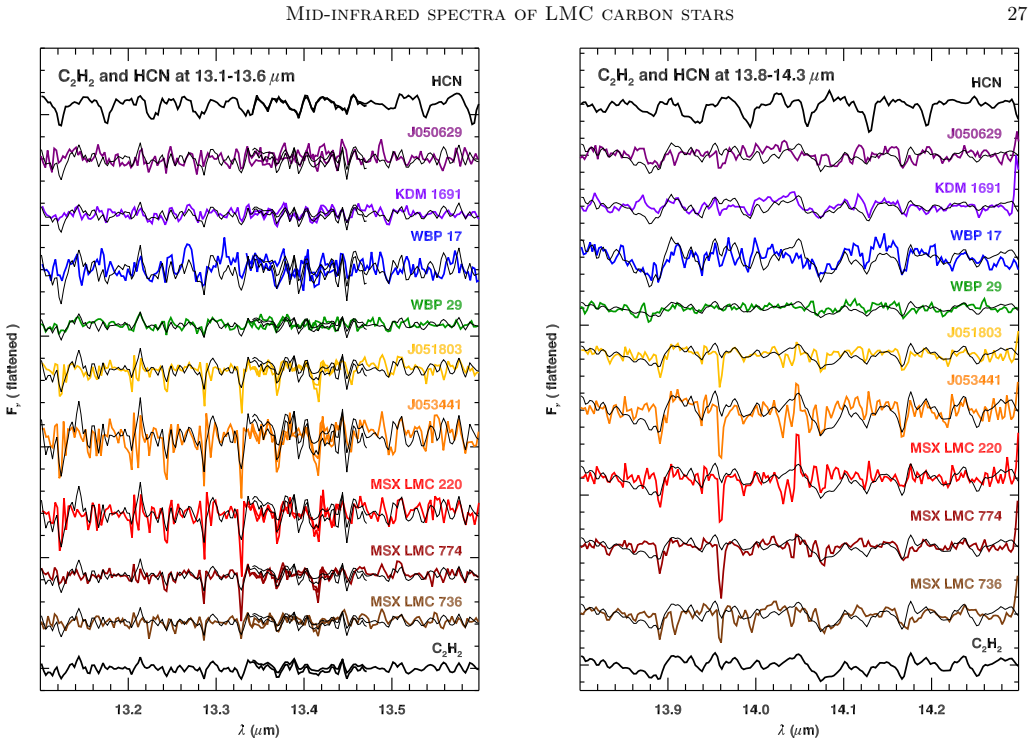
Mid-infrared spectra from the Medium Resolution Spectrometer on the James Webb Space Telescope have revealed the molecular chemistry of carbon stars in the Large Magellanic Cloud with better resolution and sensitivity than previously possible. Our sample spans a range of dust-production rates and includes three relatively dust-free semiregular variables and six dustier Mira variables. All were observed 15-20 yr earlier with the Infrared Spectrograph on the Spitzer Space Telescope at lower spectral resolution. The new spectra show that the C3 molecule is responsible for a strong absorption band centered at 5.2 um. CS is clearly present in some of the sample, especially the stars with less dust. HCN also appears to be present. Some of the spectra have changed significantly between the Spitzer epoch and the MRS observations in 2023 and 2024, and in most cases these changes can be attributed to the stellar pulsation cycle. One exception is the disappearance of a dust emission feature at ~18 um in one of the Miras. The new spectra reveal a dip centered at ~10 um, which could arise either from an unknown carrier or from variable molecular emission to the red and blue. The presence of this spectral structure on the short-wavelength side of the SiC dust emission feature at ~11.3 um along with the broad C2H2 band centered at 14 um raise the possibility that some previously reported detections of weak SiC dust emission in other carbon stars may not be real.
Editorial analysis
A structured set of objections, weighed in public.
Axiom & Free-Parameter Ledger
axioms (1)
- standard math Laboratory and theoretical wavelengths for C3, CS, HCN, C2H2, and SiC are accurate enough for identification in stellar spectra
Reference graph
Works this paper leans on
-
[1]
J., Tielens, A
Allamandola, L. J., Tielens, A. G. G. M., & Barker, J. R. 1989, ApJS, 71, 733
1989
-
[2]
1998, A&A, 340, 222
Aoki, W., Tsuji, T., & Ohnaka, K. 1998, A&A, 340, 222
1998
-
[3]
1999, A&A, 350, 945
Aoki, W., Tsuji, T., & Ohnaka, K. 1999, A&A, 350, 945
1999
-
[4]
2016, MNRAS, 457, 3611
Aringer, B., Girardi, L., Nowotny, W., et al. 2016, MNRAS, 457, 3611
2016
-
[5]
2019, MNRAS, 487, 2133
Aringer, B., Marigo, P., Nowotny, W., et al. 2019, MNRAS, 487, 2133
2019
-
[6]
J., Strange, J
Barber, R. J., Strange, J. K., Hill, C., et al. 2014, MNRAS, 437, 1828
2014
-
[7]
C., et al
Bernard-Salas, J., Peeters, E., Sloan, G. C., et al. 2009, ApJ, 699, 1541
2009
-
[8]
2019, A&A, 623, L119
Bladh, S., Eriksson, K., Marigo, P., et al. 2019, A&A, 623, L119
2019
-
[9]
M., Blanco, V
Blanco, B. M., Blanco, V. M., & McCarthy, M. F. 1978, Nature, 271, 638
1978
-
[10]
M., McCarthy, M
Blanco, V. M., McCarthy, M. F., & Blanco, B. M. 1980, ApJ, 242, 938
1980
-
[11]
L., Sloan, G
Boyer, M. L., Sloan, G. C., Nanni, A., et al. 2025, ApJ, 991, 24
2025
-
[12]
L., Srinivasan, S., Riebel, D., et al
Boyer, M. L., Srinivasan, S., Riebel, D., et al. 2012, ApJ, 748, 40
2012
-
[13]
E., & Tielens, A
Chiar, J. E., & Tielens, A. G. G. M. 2006, ApJ, 637, 774
2006
-
[14]
2006, A&A, 456, 1001
Cherchneff, I. 2006, A&A, 456, 1001
2006
-
[15]
Choudhury, S., Subramaniam, A., & Cole, A. A. 2016, MNRAS, 455, 1855
2016
-
[16]
L, Tennyson, J., & Yurchenko, S
Chubb, K. L, Tennyson, J., & Yurchenko, S. N. 2020, MNRAS, 493, 1531
2020
-
[17]
L., Clementini, G., Girardi, L., et al
Cioni, M.-R. L., Clementini, G., Girardi, L., et al. 2011, A&A, 527, 116
2011
-
[18]
L., & Habing, H
Cioni, M.-R. L., & Habing, H. J. 2003, A&A, 402, 133
2003
-
[19]
L., Loup, C., Habing, H
Cioni, M.-R. L., Loup, C., Habing, H. J., et al. A&AS, 114, 235 de Graauw, T., Haser, L. N., Beintema, D. A., et al. 1996, A&A, 315, L49
1996
-
[20]
Dwek, E., Galliano, F., & Jones, A. P. 2007, ApJ, 662, 927
2007
-
[21]
2023, A&A, 673, 21
Eriksson, K., H¨ ofner, S., & Aringer, B. 2023, A&A, 673, 21
2023
-
[22]
G., Hora, J
Fazio, G. G., Hora, J. L., Allen, L. E., et al. 2004, ApJS, 154, 10
2004
-
[23]
J., Hawley, S
Fraser, O. J., Hawley, S. L, & Cook, K. H. 2008, AJ, 136, 1242
2008
-
[24]
J., Hawley, S
Fraser, O. J., Hawley, S. L, Cook, K. H., & Keller, S. C. 2005, AJ, 129, 768
2005
-
[25]
Frenklach, M., & Feigelson, E. D. 1989, ApJ, 341, 372 Gaia Collaboration, Prusti, T., de Bruijne J. H. H., et al 2016, A&A, 595, 1 Gaia Collaboration, Brown, A. G. A., Vallenari, A., et al. 2021, A&A, 649, 1 Gaia Collaboration, Vallenari, A., Brown, A. G. A., et al. 2023, A&A, 674, 1
1989
-
[26]
P., Mather, J
Gardner, J. P., Mather, J. C., Abbot, R., et al. 2023, PASP, 135, 68001
2023
-
[27]
G., & Hron, J
Gautschy-Loidl, R., H¨ ofner, S., Jorgensen, U. G., & Hron, J. 2004, A&A, 422, 289
2004
-
[28]
Groenewegen, M. A. T. 2004, A&A, 425, 595
2004
-
[29]
Groenewegen, M. A. T. 2022, A&A, 659, 145
2022
-
[30]
Groenewegen, M. A. T., Nanni, A., Cioni, M.-R. L., et al. 2020, A&A, 636, 48
2020
-
[31]
Petersen, E. A. 2009, A&A, 506, 1277
2009
-
[32]
Groenewegen, M. A. T., & Sloan, G. C. 2018, A&A, 609, 114
2018
-
[33]
Groenewegen, M. A. T., Wood, P. R., & Sloan, G. C. 2007, MNRAS, 376, 313
2007
-
[34]
Habing, H. J. 1996, A&A Rv, 7, 97
1996
-
[35]
J., Larner, F
Harris, G. J., Larner, F. C., Tennyson, J., et al. 2008, MNRAS, 390, 143
2008
-
[36]
Helton, J. M., Morrison, J. E., Hainline, K. N., et al. 2026, ApJL, submitted (arXiv 2512.19695)
-
[37]
2004, ApJS, 155, 651 H¨ ofner, S., Bladh, S., Aringer, B., & Ahuja, R
Herwig, F. 2004, ApJS, 155, 651 H¨ ofner, S., Bladh, S., Aringer, B., & Ahuja, R. 2016, A&A, 594, 108 H¨ ofner, S. & Olofsson, H. 2018, A&A Rv, 26, 1
2004
-
[38]
R., Roellig, T
Houck, J. R., Roellig, T. L., & van Cleve, J., et al. 2004, ApJS, 154, 18
2004
-
[39]
1983, ARA&A, 21, 271
Iben, I., & Renzini, A. 1983, ARA&A, 21, 271
1983
-
[40]
2004, MNRAS, 353, 705
Ita, Y., Tanab´ e, T., Matsunaga, N., et al. 2004, MNRAS, 353, 705
2004
-
[41]
2021, ApJ, 919, 99
Iwanek, P., Soszy´ nski, I., & Koz lowski, S. 2021, ApJ, 919, 99
2021
-
[42]
2007, PASJ, 59, 615
Kato, D., Nagashima, C., Nagayama, T., et al. 2007, PASJ, 59, 615
2007
-
[43]
E., Clavel, J., et al
Kessler, M., Anderegg, M. E., Clavel, J., et al. 1996, A&A, 315, L27
1996
-
[44]
G., Leech, K., et al
Kessler, M., M¨ uller, T. G., Leech, K., et al. 2003, The ISO
2003
-
[45]
Kim, D.-W., Protopapas, P., Bailer-Jones, C. A. L., et al. 2014, A&A, 566, 43
2014
-
[46]
Kloppenborg, B. K. 2025, Observations from the AAVSO International Database (https://www.aavso.org)
2025
-
[47]
E., Sloan, G
Kraemer, K. E., Sloan, G. C., Keller, L. D., et al. 2019, ApJ, 887, 82
2019
-
[48]
L., Babusiaux, C., & Cos, N
Lallement, R., Vergely, J. L., Babusiaux, C., & Cos, N. L. J. 2022, A&A, 661, 147
2022
-
[49]
Law, D. R., Argyriou, I., Gordon, K. D., et al. 2024, AJ, in press (arXiv 2409.15435) 30Sloan et al
-
[50]
2003, The ISO
Leech, K., Kester, D., Shipman, R., et al. 2003, The ISO
2003
-
[51]
Leisenring, J., Kemper, F., & Sloan, G. C. 2008, ApJ, 681, 1557
2008
-
[52]
E., Rothman, L
Li, G., Gordon, I. E., Rothman, L. S., et al. 2015, ApJS, 216, 15
2015
-
[53]
2016, A&A, 589, 130
Liljegren, S., H¨ ofner, S., Nowotny, W., & Eriksson, K. 2016, A&A, 589, 130
2016
-
[54]
1997, Ap&SS, 251, 243
Loidl, R., Hron J., H¨ oFner, S., et al. 1997, Ap&SS, 251, 243
1997
-
[55]
E., Polyansky, L., Tennyson, J., et al
Lynas-Gray, A. E., Polyansky, L., Tennyson, J., et al. 2024, MNRAS, 535, 1439
2024
-
[56]
M., et al
Mainzer, A., Bauer, J., Cutri, R. M., et al. 2014, ApJ, 792, 30
2014
-
[57]
2004, Nature, 431, 533
Maiolino, R., Schneider, R., Oliva, E., et al. 2004, Nature, 431, 533
2004
-
[58]
G., & Rogers, C
Martin, P. G., & Rogers, C. 1987, ApJ, 322, 374
1987
-
[59]
J., Zijlstra, A
Matsuura, M., Barlow, M. J., Zijlstra, A. A. et al. 2009, MNRAS, 396, 918
2009
-
[60]
R., Sloan, G
Matsuura, M., Wood, P. R., Sloan, G. C., et al. 2006, MNRAS, 371, 415
2006
-
[61]
M., & Owen, P
Matsuura, M., Woods, P. M., & Owen, P. J. 2013, MNRAS, 429, 2527
2013
-
[62]
2008, A&A, 484, L5
Mattsson, L., Wahlin, R., H¨ ofner, S., et al. 2008, A&A, 484, L5
2008
-
[63]
2010, A&A, 509, 14
Mattsson, L., Wahlin, R., & H¨ ofner, S. 2010, A&A, 509, 14
2010
-
[64]
2025, MNRAS, 541, 516
McDonald, I., Srinivasan, S., Scicluna, P., et al. 2025, MNRAS, 541, 516
2025
-
[65]
2019, MNRAS, 484, 4678
McDonald, I., & Trabuchhi, M. 2019, MNRAS, 484, 4678
2019
-
[66]
A., Cox, N
McDonald, I., Zijlstra, A. A., Cox, N. L. J., et al. 2024, RASTI, 3, 89
2024
-
[67]
D., Indebetouw, R., et al
Meixner, M., Gordon, K. D., Indebetouw, R., et al. 2006, AJ, 132, 2268
2006
-
[68]
Naidu, R. P., Oesch, P. A., Brammer, G., et al. 2026, OJAp, in press (arXiv 2505.11263)
-
[69]
A., Wolf, C., Bessell, M
Onken, C. A., Wolf, C., Bessell, M. S., et al. 2024, PASA, 41, 61
2024
-
[70]
2022, AJ, 163, 192
Ou, J.-Y., & Ngeow, C.-C. 2022, AJ, 163, 192
2022
-
[71]
Ochsenbein, F., et al. 2000, “The VizieR database of astronomical catalogues,” DOI: 10.26093/cds/vizier
-
[72]
J., Yurchenko, S
Paulose, G., Barton, E. J., Yurchenko, S. N., & Tennyson, J. 2015, MNRAS, 454, 1931
2015
-
[73]
E., & Geisler, D
Piatti, A. E., & Geisler, D. 2013, AJ, 145, 17 Pietrzy´ nski, G., Graczyk, D., Gallenne , A., et al. 2019, Nature, 567, 200
2013
-
[74]
M., Salyk, C., Banzatti, A., et al
Pontoppidan, K. M., Salyk, C., Banzatti, A., et al. 2024, ApJ, 963, 158
2024
-
[75]
1981, A&A, 94, 175
Renzini, A., & Voli, M. 1981, A&A, 94, 175
1981
-
[76]
L., Srinivasan, S., et al
Riebel, D., Boyer, M. L., Srinivasan, S., et al. 2015, ApJ, 807, 1
2015
-
[77]
H., & Lebofsky, M
Rieke, G. H., & Lebofsky, M. H. 1985, ApJ, 288, 618
1985
-
[78]
Salpeter, E. E. 1952, ApJ, 115, 326
1952
-
[79]
N., Kazarovets, E
Samus, N. N., Kazarovets, E. V., Durlevich, O. V., et al. 2017, ARep, 61, 1
2017
-
[80]
Sanford, R. F. 1944, ApJ, 99, 145
1944
discussion (0)
Sign in with ORCID, Apple, or X to comment. Anyone can read and Pith papers without signing in.