Recognition: unknown
Contrast-Space Projection for Network Meta-Analysis: An Exact and Invariant Study-Based Decomposition of Direct and Indirect Contributions
Pith reviewed 2026-05-09 20:45 UTC · model grok-4.3
The pith
Orthogonal projection onto the consistency-constrained contrast space decomposes network meta-analysis estimates into exact, invariant direct and indirect contributions from each study.
A machine-rendered reading of the paper's core claim, the machinery that carries it, and where it could break.
Core claim
The NMA estimator is expressed as an explicit linear mapping of the observed contrasts onto the consistency-constrained contrast space induced by orthogonal projection. A rigorous study-based definition of direct and indirect evidence is introduced through a canonical within-study reduction that removes algebraic redundancy and yields a unique, invariant decomposition. This leads to exact covariance-aware decompositions of the NMA estimator into study-level direct and indirect contributions, with indirect evidence further resolved into path-level components.
What carries the argument
The orthogonal projection of observed treatment contrasts onto the consistency-constrained contrast space, using a canonical within-study reduction to define direct and indirect evidence uniquely.
If this is right
- The resulting weights are directly analogous to inverse-variance weights in pairwise meta-analysis.
- The framework enables forest-plot representations that exactly reconstruct the NMA estimator.
- It yields projection-based diagnostic tools including tension plots and path-based visualizations.
- Applications demonstrate a reproducible framework for understanding evidence contributions in network meta-analysis.
Where Pith is reading between the lines
- This decomposition could be used to create interactive tools that let users see how adding or removing a study changes the network estimate.
- Similar projection ideas might apply to other areas where direct and indirect evidence are combined, such as in causal inference or evidence synthesis beyond medicine.
- The path-level components could inform the design of future trials by showing which indirect paths are most influential.
- By making contributions explicit, the method may help address inconsistencies or tensions in the network more systematically.
Load-bearing premise
An orthogonal projection onto the consistency-constrained contrast space combined with canonical within-study reduction produces a unique invariant decomposition free of artifacts from basis choice or multi-arm trial handling.
What would settle it
A calculation on a small network with known direct and indirect paths where the summed contributions fail to exactly equal the NMA estimate would falsify the exactness of the decomposition.
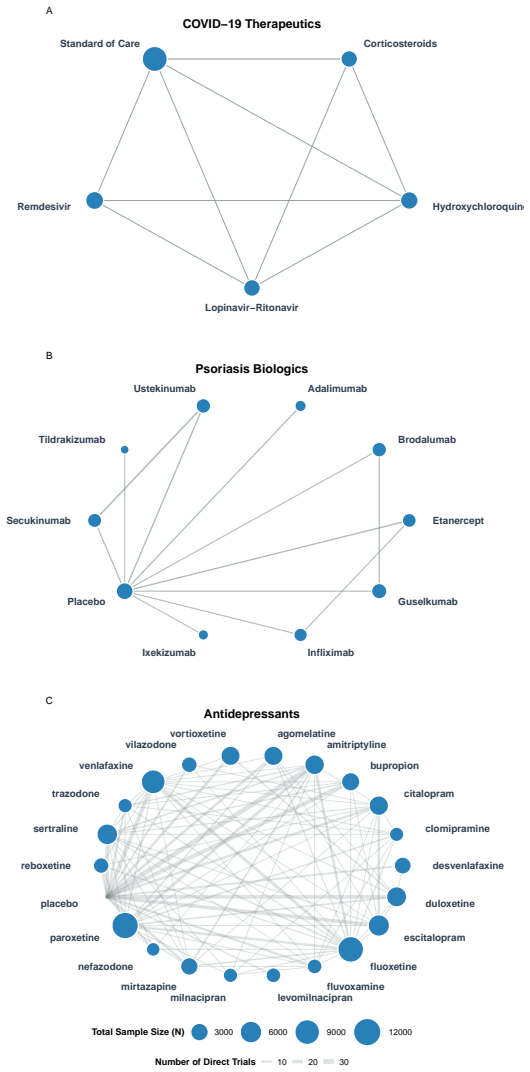
Figures


read the original abstract
Network meta-analysis (NMA) combines direct and indirect comparisons across a connected treatment network to estimate relative treatment effects. However, there is a lack of exact contribution decompositions that reproduce NMA estimates, particularly in the presence of multi-arm trials that induce within-study correlations. We address this reproducibility gap by developing a contrast-space projection formulation of NMA. Working in the space of all estimable pairwise treatment contrasts, we express the NMA estimator as an explicit linear mapping of the observed contrasts onto the consistency-constrained contrast space induced by orthogonal projection. Building on this representation, we introduce a rigorous study-based definition of direct and indirect evidence through a canonical within-study reduction that removes algebraic redundancy and yields a unique, invariant decomposition. This leads to exact covariance-aware decompositions of the NMA estimator into study-level direct and indirect contributions, with indirect evidence further resolved into path-level components. The resulting weights are directly analogous to inverse-variance weights in pairwise meta-analysis and enable, to our knowledge, the first forest-plot representation that exactly reconstructs the NMA estimator. The framework also yields projection-based diagnostic and graphical tools, including forest plots, tension plots, and path-based visualizations. Applications to empirical datasets demonstrate how the proposed approach provides a reproducible and interpretable framework for understanding evidence contributions in network meta-analysis, supporting transparent interpretation and reporting.
Editorial analysis
A structured set of objections, weighed in public.
Referee Report
Summary. The paper develops a contrast-space projection formulation for network meta-analysis (NMA). It represents the NMA estimator as an explicit linear mapping obtained by orthogonal projection of observed treatment contrasts onto the consistency-constrained contrast space. A canonical within-study reduction is introduced to define direct and indirect evidence in a study-based manner that removes algebraic redundancy, yielding exact, covariance-aware decompositions of the NMA estimator into study-level direct/indirect contributions and further path-level components for indirect evidence. The resulting weights are analogous to inverse-variance weights, enable forest plots that exactly reconstruct the NMA estimator, and support projection-based diagnostic tools such as tension plots and path visualizations. The approach is demonstrated on empirical datasets.
Significance. If the invariance and exact-reconstruction claims hold, the work would address a recognized gap in reproducible, study-level decompositions for NMA that properly handle within-study correlations from multi-arm trials. The provision of weights directly analogous to pairwise inverse-variance weights, together with visualizations that exactly recover the NMA point estimate, could improve interpretability and reporting standards. The projection framework also supplies new diagnostic graphics that may help identify sources of inconsistency.
major comments (2)
- [§3.2] §3.2 (canonical within-study reduction): the claim that this reduction produces a basis-independent, unique decomposition is load-bearing for the invariance assertion. The derivation must explicitly show that the resulting study-level weights remain unchanged when the contrast basis for a multi-arm trial is altered (which changes the off-diagonal covariance blocks); without a general proof or a worked numerical counter-example check, the uniqueness result is not yet established.
- [§4.1–4.2] §4.1–4.2 (exact decomposition): the manuscript asserts that the sum of the direct and indirect contributions exactly recovers the NMA estimator for every contrast. A table or supplementary numerical verification (for each empirical example) reporting the residual discrepancy after summation, including the effect of floating-point precision, is required to confirm the “exact” property under realistic covariance structures.
minor comments (3)
- [Introduction] The abstract states that the method yields “the first forest-plot representation that exactly reconstructs the NMA estimator.” A concise literature comparison in the introduction is needed to substantiate the novelty claim relative to existing contribution or weight-based visualizations.
- [Figures] Figure captions for the tension plots and path visualizations should include a brief statement of how the plotted quantities are computed from the projection matrix, so that readers can reproduce the graphics from the reported weights.
- [Notation] Notation for the contrast-space projection operator P and the within-study reduction matrix R should be introduced once in §2 and used consistently thereafter; occasional re-definition of symbols across sections reduces readability.
Simulated Author's Rebuttal
We thank the referee for their careful reading and constructive comments, which help clarify the presentation of the invariance and exact-reconstruction properties. We address each major comment below and will revise the manuscript to incorporate the requested demonstrations.
read point-by-point responses
-
Referee: [§3.2] §3.2 (canonical within-study reduction): the claim that this reduction produces a basis-independent, unique decomposition is load-bearing for the invariance assertion. The derivation must explicitly show that the resulting study-level weights remain unchanged when the contrast basis for a multi-arm trial is altered (which changes the off-diagonal covariance blocks); without a general proof or a worked numerical counter-example check, the uniqueness result is not yet established.
Authors: We agree that an explicit demonstration of basis independence is necessary for full rigor. The canonical within-study reduction is constructed via the orthogonal projection onto the consistency-constrained contrast space, which is intrinsically basis-independent; the reduction operator is defined to eliminate algebraic redundancy while preserving the linear mapping. In the revision we will add a general proof (in a new appendix) showing that the study-level weights are invariant under any nonsingular transformation of the within-study contrast basis, because the projection and reduction commute with such transformations in a manner that leaves the effective contributions unchanged. We will also include a worked numerical example with a multi-arm trial under two different contrast bases, confirming that the resulting weights and decomposition remain identical. revision: yes
-
Referee: [§4.1–4.2] §4.1–4.2 (exact decomposition): the manuscript asserts that the sum of the direct and indirect contributions exactly recovers the NMA estimator for every contrast. A table or supplementary numerical verification (for each empirical example) reporting the residual discrepancy after summation, including the effect of floating-point precision, is required to confirm the “exact” property under realistic covariance structures.
Authors: We acknowledge that numerical verification strengthens the exact-reconstruction claim. Although the algebraic identity follows directly from the projection representation (the direct-plus-indirect mapping equals the original NMA linear operator), we will add a supplementary table for each empirical dataset. The table will report, for every contrast: the NMA point estimate, the summed direct and indirect contributions, the absolute residual, and the residual relative to machine epsilon. This will confirm that any discrepancy is attributable solely to floating-point arithmetic and remains on the order of 1e-15 or smaller under the reported covariance structures. revision: yes
Circularity Check
No significant circularity; derivation is a self-contained linear-algebra construction
full rationale
The paper expresses the NMA estimator as an orthogonal projection onto the consistency-constrained contrast space and then defines direct/indirect contributions via an explicitly introduced canonical within-study reduction. This is a definitional construction on the observed contrasts rather than a reduction of the output to fitted parameters or to a self-citation chain. No equation is shown to equal its input by construction, and the uniqueness/invariance claim is presented as a mathematical property of the chosen reduction rule, not as an unverified assertion imported from prior work by the same authors. The framework remains self-contained against external benchmarks.
Axiom & Free-Parameter Ledger
axioms (1)
- domain assumption Network meta-analysis operates under the consistency assumption that direct and indirect evidence are compatible, allowing definition of a constrained contrast space.
Reference graph
Works this paper leans on
-
[1]
Linear inference for mixed treatment comparison meta-analysis: A two- stage approach
Guobing Lu et al. “Linear inference for mixed treatment comparison meta-analysis: A two- stage approach”. In:Research Synthesis Methods2.1 (2011), pp. 43–60.doi:10.1002/jrsm. 34
-
[2]
Graphical methods and nu- merical summaries for presenting results from multiple-treatment meta-analysis: An overview and tutorial
Georgia Salanti, Anthony E. Ades, and John P. A. Ioannidis. “Graphical methods and nu- merical summaries for presenting results from multiple-treatment meta-analysis: An overview and tutorial”. In:Journal of Clinical Epidemiology64.2 (2011), pp. 163–171.doi:10.1016/ j.jclinepi.2010.03.016
2011
-
[3]
Sofia Dias et al. “Evidence synthesis for decision making 2: A generalized linear modeling framework for pairwise and network meta-analysis of randomized controlled trials”. In:Med- ical Decision Making33.5 (2013), pp. 607–617.doi:10.1177/0272989X12458724
-
[4]
Ranking treatments in frequentist network meta-analysis works without resampling methods
Gerta R¨ ucker and Guido Schwarzer. “Ranking treatments in frequentist network meta-analysis works without resampling methods”. In:BMC Medical Research Methodology15 (2015), p. 58. doi:10.1186/s12874-015-0060-8
-
[5]
Hedges and Ingram Olkin.Statistical Methods for Meta-Analysis
Larry V. Hedges and Ingram Olkin.Statistical Methods for Meta-Analysis. Orlando, FL: Academic Press, 1985. 32
1985
-
[6]
Brian Hutton, Georgia Salanti, Deborah M. Caldwell, et al. “The PRISMA extension state- ment for reporting of systematic reviews incorporating network meta-analyses of health care interventions: checklist and explanations”. In:Annals of Internal Medicine162.11 (2015), pp. 777–784.doi:10.7326/M14-2385
-
[7]
Network meta-analysis, electrical networks and graph theory
Gerta R¨ ucker. “Network meta-analysis, electrical networks and graph theory”. In:Research Synthesis Methods3.4 (2012), pp. 312–324.doi:10.1002/jrsm.1058
-
[8]
Visualizing the flow of evidence in network meta-analysis and characterizing mixed treatment comparisons
Johannes K¨ onig, Uta Krahn, and Harald Binder. “Visualizing the flow of evidence in network meta-analysis and characterizing mixed treatment comparisons”. In:Statistics in Medicine 32.30 (2013), pp. 5414–5429
2013
-
[9]
Estimating the contribution of studies and specific out- comes to network meta-analysis results
Theodoros Papakonstantinou et al. “Estimating the contribution of studies and specific out- comes to network meta-analysis results”. In:Statistics in Medicine37.12 (2018), pp. 1947– 1960
2018
-
[10]
Network meta-analysis and random walks
Annabel L. Davies et al. “Network meta-analysis and random walks”. In:Statistics in Medicine 41.11 (2022), pp. 2091–2114.doi:10.1002/sim.9346
-
[11]
The statistical importance of a study for a network meta-analysis esti- mate
Gerta R¨ ucker et al. “The statistical importance of a study for a network meta-analysis esti- mate”. In:BMC Medical Research Methodology20 (2020), p. 190
2020
-
[12]
A leave-one-out algorithm for contribution analysis in component network meta-analysis
Y. Mao et al. “A leave-one-out algorithm for contribution analysis in component network meta-analysis”. In:BMC Medical Research Methodology25 (2025), p. 191
2025
-
[13]
Gerta R¨ ucker and Guido Schwarzer. “Reduce dimension or reduce weights? Comparing two approaches to multi-arm studies in network meta-analysis”. In:Statistics in Medicine33.25 (2014), pp. 4353–4369.doi:10.1002/sim.6236
-
[14]
Gerta Lu and A. E. Ades. “Combination of direct and indirect evidence in mixed treatment comparisons”. In:Statistics in Medicine23.20 (2004), pp. 3105–3124.doi:10.1002/sim. 1875
work page doi:10.1002/sim 2004
-
[15]
Quantifying the impact of between- study heterogeneity in multivariate meta-analysis
Dan Jackson, Ian R. White, and Richard D. Riley. “Quantifying the impact of between- study heterogeneity in multivariate meta-analysis”. In:Statistics in Medicine31.29 (2012), pp. 3805–3820.doi:10.1002/sim.5453
-
[16]
Consistency and inconsistency in network meta-analysis: concepts and models for multi-arm studies
Julian P. T. Higgins et al. “Consistency and inconsistency in network meta-analysis: concepts and models for multi-arm studies”. In:Research Synthesis Methods3.2 (2012), pp. 98–110
2012
-
[17]
Drug treatments for COVID-19: living systematic review and network meta-analysis
Reed A. C. Siemieniuk et al. “Drug treatments for COVID-19: living systematic review and network meta-analysis”. In:British Medical Journal370 (2020), p. m2980.doi:10.1136/ bmj.m2980
2020
-
[18]
Association between administration of systemic corticosteroids and mor- tality among critically ill patients with COVID-19: a meta-analysis
WHO Rapid Evidence Appraisal for COVID-19 Therapies (REACT) Working Group, Jonathan A. C. Sterne, et al. “Association between administration of systemic corticosteroids and mor- tality among critically ill patients with COVID-19: a meta-analysis”. In:Journal of the Amer- ican Medical Association324.13 (2020), pp. 1330–1341
2020
-
[19]
A living WHO guideline on drugs for COVID-19
Fran¸ cois Lamontagne et al. “A living WHO guideline on drugs for COVID-19”. In:British Medical Journal370 (2020), p. m3379
2020
-
[20]
Systemic pharmacological treatments for chronic plaque psoriasis: a network meta-analysis
Emilie Sbidian et al. “Systemic pharmacological treatments for chronic plaque psoriasis: a network meta-analysis”. In:Cochrane Database of Systematic Reviews4 (2021)
2021
-
[21]
Comparative efficacy and acceptability of 21 antidepressant drugs for the acute treatment of adults with major depressive disorder: a systematic review and network meta-analysis
Andrea Cipriani et al. “Comparative efficacy and acceptability of 21 antidepressant drugs for the acute treatment of adults with major depressive disorder: a systematic review and network meta-analysis”. In:The Lancet391.10128 (2018), pp. 1357–1366. 33
2018
discussion (0)
Sign in with ORCID, Apple, or X to comment. Anyone can read and Pith papers without signing in.