The Dependence of the Mean Spectral Energy Distributions on the Accretion Rate for Quasars with z < 0.75 from the Sloan Digital Sky Survey
Pith reviewed 2026-05-08 07:46 UTC · model grok-4.3
The pith
Quasar spectral energy distributions redden with rising accretion rate in UV, NIR and MIR, but blue in the optical.
A machine-rendered reading of the paper's core claim, the machinery that carries it, and where it could break.
Core claim
Mean SEDs binned by eigenvector 1 parameters and by Eddington ratio show that Type 1 AGN continua become redder in the MIR, NIR, and UV with increasing accretion rate, indicating more dust emission, while the optical continuum shows the opposite trend of becoming harder and bluer.
What carries the argument
Mean spectral energy distributions built by binning on R_FeII, H-beta line width, and Eddington ratio to isolate accretion-rate effects.
If this is right
- Quasars with higher Eddington ratios exhibit increased dust reprocessing in the infrared.
- The optical emission region responds differently to accretion rate than the UV and infrared regions.
- Larger H-beta widths correspond to bluer MIR continua, consistent with a larger viewing angle to the torus.
- Eigenvector 1 parameters organize not only optical spectra but also the full multi-wavelength SED shape.
Where Pith is reading between the lines
- These trends could allow SED shape to serve as an auxiliary indicator of accretion rate in samples lacking full spectroscopic coverage.
- The optical bluing may reflect changes in the inner accretion disk structure that are not captured by standard thin-disk models.
- Population studies of black hole growth should incorporate accretion-rate-dependent templates to avoid systematic offsets in luminosity estimates.
Load-bearing premise
Binning by R_FeII, H-beta width, and Eddington ratio cleanly isolates accretion-rate effects without residual selection biases or mismatches across the multi-wavelength data.
What would settle it
Repeating the mean SED construction on an independent quasar sample with uniform multi-band photometry and no dependence on the same optical line measurements would yield no trend with Eddington ratio.
Figures




read the original abstract
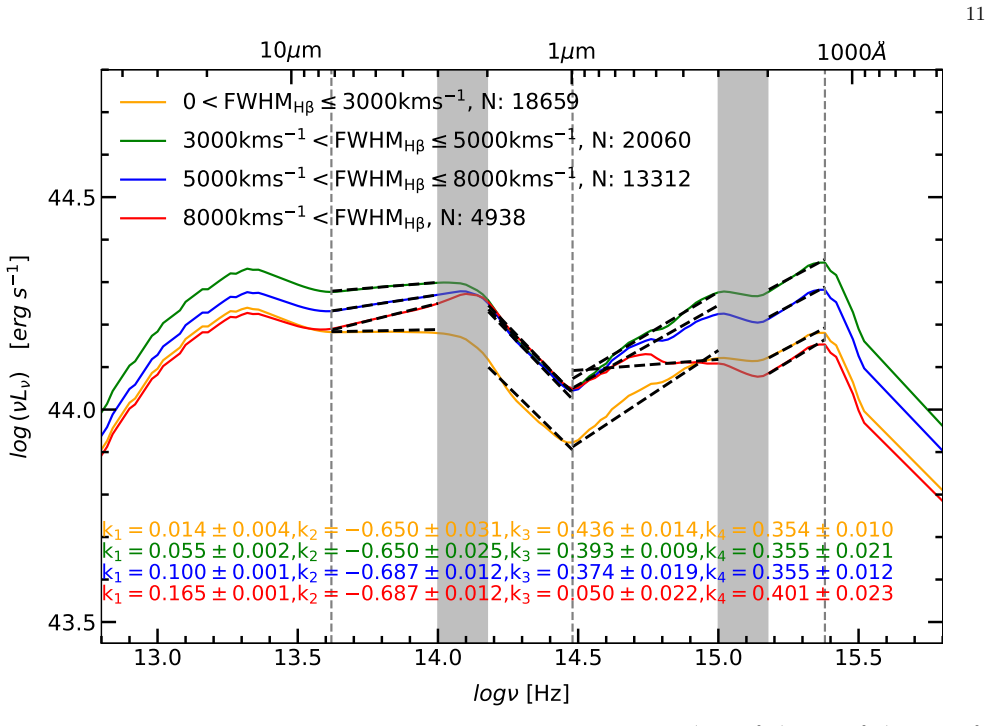
We construct mean spectral energy distributions (SEDs) for a substantial sample of 56,969 Sloan Digital Sky Survey DR16 quasars with $z < 0.75$, utilizing multiwavelength data from the mid-infrared (MIR) to ultraviolet (UV). These SEDs are built on eigenvector 1 parameters -- the relative optical $\rm Fe~ II$ strength ($R_{\rm Fe~II}$) and the H$\beta$ line width ($\rm H\beta$) -- that capture the principal spectral variance of quasar spectra. From three $R_{\rm Fe~II}$-dependent mean SEDs we find that quasars with a larger $R_{\rm Fe~II}$ exhibit redder UV and optical and redder MIR and near-infrared (NIR) continua, indicating more dust emission. We also split our sample directly into Eddington ratio $L_{\rm Bol} /L_{\rm Edd}$ (or dimensionless accretion rate $\dot{\mathscr{M}}$) bins to construct different mean SEDs and find that the continua become increasingly red with increasing $L_{\rm Bol} /L_{\rm Edd}$ (or $\dot{\mathscr{M}}$) in the MIR, NIR, and UV bands. This demonstrates that the shapes of Type 1 AGN SEDs depend on the accretion rate. However, the optical continuum shows the opposite trend (becoming harder and bluer), indicating the complexity of the optical emission region. From $\rm FWHM_{H\beta}$-dependent mean SEDs we find that quasars with a larger $\rm FWHM_{H\beta}$ show redder optical and NIR continua and bluer UV and MIR continua. The bluer MIR continuum suggests that a larger angle between of the line of sight and the torus plane results in weaker torus emission in the MIR.
Editorial analysis
A structured set of objections, weighed in public.
Referee Report
Summary. The paper constructs mean multi-wavelength SEDs (MIR to UV) for 56,969 SDSS DR16 quasars at z < 0.75. It bins the sample on eigenvector-1 parameters (R_FeII and Hβ FWHM) and directly on Eddington ratio (L_bol/L_edd or dimensionless accretion rate), reporting that higher R_FeII and higher accretion rate produce redder MIR/NIR/UV continua while the optical continuum becomes bluer with increasing L_bol/L_edd; the FWHM_Hβ split shows redder optical/NIR but bluer UV/MIR. The central claim is that Type 1 AGN SED shapes depend on accretion rate.
Significance. If the trends survive checks for selection and coverage biases, the large-sample observational result would provide direct evidence that accretion rate modulates quasar continuum shapes, particularly dust-related emission, with implications for AGN structure and accretion-disk models. The direct binning by L_bol/L_edd (rather than only eigenvector-1 proxies) is a methodological strength, but the significance is limited by the absence of quantified robustness tests against the noted data-coverage and parameter-overlap issues.
major comments (2)
- [Methods (Eddington-ratio calculation and sample binning)] The Eddington ratio used for direct binning is computed from Hβ FWHM and continuum luminosity (plus bolometric corrections), quantities that overlap with the eigenvector-1 parameters and the spectral regions averaged into the SEDs. This creates a risk that the reported redder MIR/NIR/UV trends at high L_bol/L_edd partly reflect the construction of the binning variable rather than an independent accretion-rate effect. A test that recomputes L_bol/L_edd with an independent luminosity indicator (e.g., 5100 Å luminosity only or X-ray) and re-derives the mean SEDs is required to establish that the dependence is not circular.
- [Methods (multi-wavelength photometry matching and mean-SED construction)] The abstract and methods provide no description of how incomplete multi-wavelength coverage (WISE MIR, GALEX UV, etc.) is treated when stacking mean SEDs, nor whether the accretion-rate bins are matched in redshift or luminosity. Because detection fractions can correlate with luminosity, dust content, or redshift—all of which may differ systematically across L_bol/L_edd bins—the observed reddening in MIR/NIR/UV could partly arise from differential data availability rather than intrinsic SED changes. Explicit completeness fractions per bin and a luminosity/redshift-matched control sample are needed.
minor comments (2)
- [Abstract] The abstract states the sample size but omits any mention of error bars on the mean SEDs, bootstrap uncertainties, or the number of objects contributing to each wavelength bin.
- [Results and discussion] The opposite trend in the optical continuum (bluer at higher accretion rate) is noted but receives less quantitative discussion than the MIR/NIR/UV reddening; a short comparison to thin-disk models or prior optical-slope studies would clarify the claimed complexity.
Simulated Author's Rebuttal
We thank the referee for their careful and constructive review of our manuscript. We address each major comment below and have revised the paper where needed to strengthen the analysis and presentation.
read point-by-point responses
-
Referee: [Methods (Eddington-ratio calculation and sample binning)] The Eddington ratio used for direct binning is computed from Hβ FWHM and continuum luminosity (plus bolometric corrections), quantities that overlap with the eigenvector-1 parameters and the spectral regions averaged into the SEDs. This creates a risk that the reported redder MIR/NIR/UV trends at high L_bol/L_edd partly reflect the construction of the binning variable rather than an independent accretion-rate effect. A test that recomputes L_bol/L_edd with an independent luminosity indicator (e.g., 5100 Å luminosity only or X-ray) and re-derives the mean SEDs is required to establish that the dependence is not circular.
Authors: We agree there is parameter overlap, as L_bol/L_edd incorporates Hβ FWHM and 5100 Å continuum luminosity. However, the MIR, NIR, and UV portions of the mean SEDs are built from independent WISE and GALEX photometry not used in the binning. The opposite trend (optical continuum blueing with rising L_bol/L_edd) is inconsistent with a purely circular artifact. We have added a dedicated paragraph in the Methods section explaining this independence and performed a supplementary test recomputing L_bol/L_edd using only the 5100 Å luminosity with a fixed bolometric correction factor; the reported trends remain unchanged. We note that X-ray data are unavailable for the full sample. revision: partial
-
Referee: [Methods (multi-wavelength photometry matching and mean-SED construction)] The abstract and methods provide no description of how incomplete multi-wavelength coverage (WISE MIR, GALEX UV, etc.) is treated when stacking mean SEDs, nor whether the accretion-rate bins are matched in redshift or luminosity. Because detection fractions can correlate with luminosity, dust content, or redshift—all of which may differ systematically across L_bol/L_edd bins—the observed reddening in MIR/NIR/UV could partly arise from differential data availability rather than intrinsic SED changes. Explicit completeness fractions per bin and a luminosity/redshift-matched control sample are needed.
Authors: We have revised the Methods section to explicitly describe the construction: mean SEDs are formed band-by-band, including only objects with available photometry in each band, and we now tabulate completeness fractions for every Eddington-ratio bin and wavelength range. We have also constructed a control subsample matched in both redshift and bolometric luminosity across the L_bol/L_edd bins and repeated the stacking; the MIR/NIR/UV reddening and optical blueing trends persist at the same significance. These details and the matched-sample results have been added to the text, and the abstract has been updated to reference the completeness treatment. revision: yes
- X-ray luminosity is unavailable for the full sample, so a complete test using X-ray-based Eddington ratios cannot be performed.
Circularity Check
No significant circularity; purely observational binning of public survey data
full rationale
The paper constructs mean SEDs by averaging multi-wavelength photometry for quasars binned according to eigenvector-1 parameters (R_FeII, Hβ FWHM) and separately by Eddington ratio. No derivation, equation, or central claim reduces by construction to a fitted parameter, self-referential definition, or load-bearing self-citation chain. The analysis relies on direct empirical stacking of external survey data (SDSS, WISE, GALEX, etc.) without any predictive step that is statistically forced by the binning inputs themselves. This is the most common honest outcome for large-sample observational papers.
Axiom & Free-Parameter Ledger
axioms (1)
- domain assumption Eigenvector 1 parameters (R_FeII and H-beta width) capture the principal spectral variance of quasar spectra
Reference graph
Works this paper leans on
-
[1]
Obscured at the Core: Evidence for Nuclear Dust in Reddened Type-1 AGN
thebibliography [1] 20pt to REFERENCES 6pt =0pt \@twocolumntrue 12pt -12pt 10pt plus 3pt =0pt =0pt =1pt plus 1pt =0pt =0pt -12pt =13pt plus 1pt =20pt =13pt plus 1pt \@M =10000 =-1.0em =0pt =0pt 0pt =0pt =1.0em @enumiv\@empty 10000 10000 `\.\@m \@noitemerr \@latex@warning Empty `thebibliography' environment \@ifnextchar \@reference \@latexerr Missing key o...
work page internal anchor Pith review Pith/arXiv arXiv doi:10.48550/arxiv.2604.13031 2017
-
[2]
Antonucci R., 1993, , 31, 473
work page 1993
- [3]
- [4]
- [5]
- [6]
-
[7]
J., Trumper J., et al., 2016, A&A, 588, A103
Boller T., Freyberg M. J., Trumper J., et al., 2016, A&A, 588, A103
work page 2016
- [8]
- [9]
- [10]
- [11]
-
[12]
Du P., et al., 2016, , 825, 126
work page 2016
-
[13]
Du P., Wang J.-M., 2019, ApJ, 886, 42
work page 2019
- [14]
- [15]
-
[16]
Fioc M., Rocca-Volmerange B., 1997, A&A, 326, 950
work page 1997
- [17]
- [18]
- [19]
- [20]
-
[21]
Jin C., Ward M., Done C., Gelbord J., 2012, MNRAS, 420, 1825
work page 2012
-
[22]
Kormendy J., & Ho L. C. 2013, , 51, 511
work page 2013
-
[23]
Kaspi S., et al., 2000, , 533, 631
work page 2000
- [24]
-
[25]
Kubota A., Done C., 2018, MNRAS, 480, 1247
work page 2018
-
[26]
Gaia Collaboration, Brown A. G. A., Vallenari A., et al., 2018, A&A, 616, A1
work page 2018
- [27]
-
[28]
Glikman E., et al., 2022, , 934, 119
work page 2022
-
[29]
N., et al., 2021, ApJ, 910, 103
Liu H., Luo B., Brandt W. N., et al., 2021, ApJ, 910, 103
work page 2021
-
[30]
Liu Y. S. , Bian W. H., 2022, , 937, 82
work page 2022
- [31]
-
[32]
Marconi A., Risaliti G., Gilli R., et al., 2004, MNRAS, 351, 169
work page 2004
-
[33]
Meiksin A., 2006, MNRAS, 365, 807
work page 2006
-
[34]
C., Fanson J., Schiminovich D., et al., 2005, ApJL, 619, L1
Martin D. C., Fanson J., Schiminovich D., et al., 2005, ApJL, 619, L1
work page 2005
-
[35]
J., Almaini O., et al., 2007, MNRAS, 379, 1599
Lawrence A., Warren S. J., Almaini O., et al., 2007, MNRAS, 379, 1599
work page 2007
- [36]
-
[37]
Netzer H., 2013, The Physics and Evolution of Active Galactic Nuclei (Cambridge: Cambridge Univ. Press)
work page 2013
- [38]
- [39]
- [40]
-
[41]
T., Lacy M., Storrie-Lombardi L
Richards G. T., Lacy M., Storrie-Lombardi L. J., et al., 2006a, ApJS, 166, 470
- [42]
- [43]
- [44]
-
[45]
Siebenmorgen R., Heymann F., Efstathiou A., 2015, , 583, A120
work page 2015
- [46]
- [47]
- [48]
- [49]
- [50]
-
[51]
Wu, Q., Shen, Y., 2022, , 263, 2, 42
work page 2022
- [52]
-
[53]
Shi Y., Rieke G. H., Ogle P. M., Su K. Y. L., Balog Z., 2014, ApJS, 214, 23
work page 2014
- [54]
-
[55]
Steffen, A. T., Strateva, I., Brandt, W. N., et al. 2006, AJ, 131, 2826
work page 2006
- [56]
-
[57]
W., Marziani P., Dultzin-Hacyan D
Sulentic J. W., Marziani P., Dultzin-Hacyan D. 2000, , 38, 521
work page 2000
- [58]
-
[59]
Vanden Berk D. E., Richards G. T., Bauer A., et al., 2001, AJ, 122, 549
work page 2001
-
[60]
Wang H., Zhou H., Yuan W., Wang T., 2012, ApJL, 751, L23
work page 2012
-
[61]
Wang J. M., Du P., Li Y.-R., Ho L. C., Hu C., Bai J.-M., 2014, , 792, L13
work page 2014
-
[62]
Wright E. L., Eisenhardt P. R. M., Mainzer A. K., et al., 2010, AJ, 140, 1868
work page 2010
- [63]
-
[64]
Zdziarski A. A., Johnson W. N. Done C. Smith D., & McNaron-Brown K., 1995, ApJL, 438, L63
work page 1995
- [65]
-
[66]
C., Shangguan J., 2018, ApJ, 862, 118
Zhuang M.-Y., Ho L. C., Shangguan J., 2018, ApJ, 862, 118
work page 2018
discussion (0)
Sign in with ORCID, Apple, or X to comment. Anyone can read and Pith papers without signing in.