Beyond the mean: Sequence analysis methods for clustering ordinal EMA data
Pith reviewed 2026-05-08 05:49 UTC · model grok-4.3
The pith
Sequence analysis of ordinal EMA stress ratings identifies latent profile groups that better characterize effects on cognitive performance than mean summaries alone.
A machine-rendered reading of the paper's core claim, the machinery that carries it, and where it could break.
Core claim
We borrow sequence analysis measures to capture individual-level patterns over time in ordinal EMA profiles, apply PCA followed by K-means clustering to identify latent groups, and demonstrate using stress observations that these groups improve characterization of impacts on cognitive performance relative to mean-based summaries.
What carries the argument
Borrowed sequence analysis measures that quantify temporal patterns in ordinal sequences, reduced by principal component analysis and partitioned by K-means clustering to form latent profile groups.
If this is right
- The clusters serve as improved predictors in downstream models relating stress to cognition.
- The method handles varying observation counts per individual without requiring balanced panels.
- It provides an alternative to latent class analysis and latent transition analysis for detecting group structure in ordinal longitudinal data.
- Distinct profile groups allow finer characterization of how different stress trajectories affect performance.
Where Pith is reading between the lines
- The same pipeline could be tested on other ordinal EMA domains such as mood or pain to see whether temporal clustering reveals similar gains over averages.
- If the identified groups prove stable across studies, they might support targeted interventions that address specific daily stress patterns rather than overall stress levels.
- Comparing multiple sequence distance metrics within the same data could reveal which aspects of temporal ordering matter most for the cognitive links.
Load-bearing premise
The sequence analysis measures adequately summarize the relevant temporal dynamics in the ordinal EMA profiles, and the resulting clusters reflect meaningful latent structures rather than artifacts of the chosen metrics or algorithm.
What would settle it
If cluster membership derived from the sequence measures shows no added predictive value for cognitive performance outcomes after accounting for average stress levels, or if the groups fail to replicate in a held-out sample of EMA data.
Figures


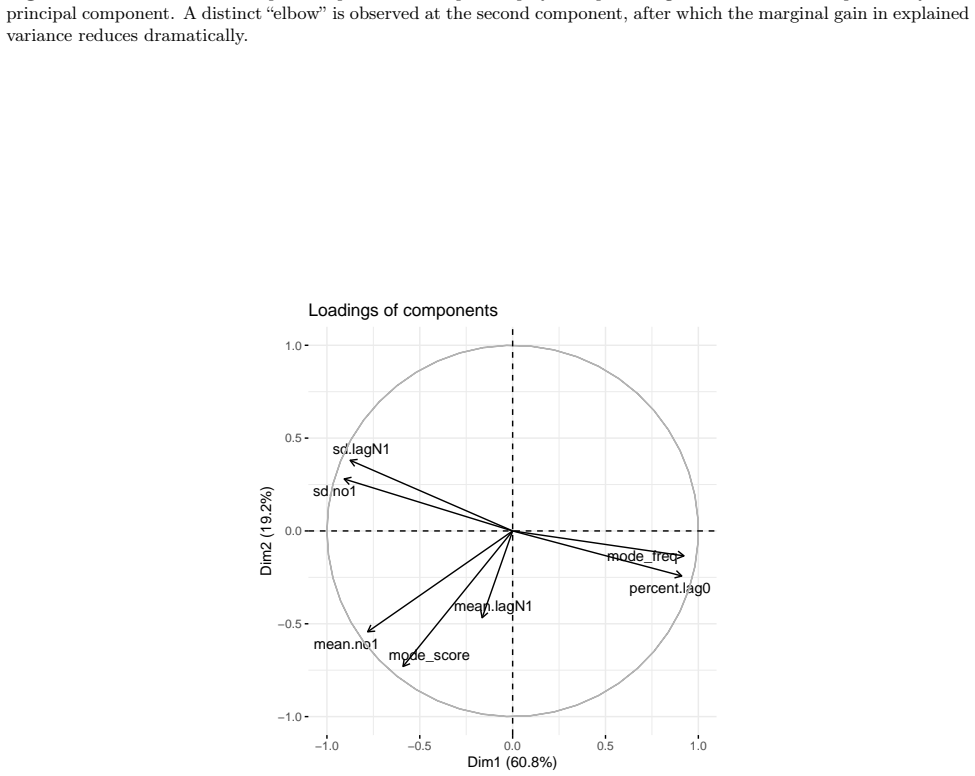
read the original abstract
Ecological momentary assessment (EMA) ratings are widely used in studies of behavioral and psychological phenomena to capture real-time data in subjects' real-world environments. Because the data are collected repeatedly over the study period, they provide rich longitudinal rating profiles for each individual. However, the number of observations per subject is often large, while both sample size and sampling intensity can vary substantially across individuals, which complicates the analysis. In some settings, simplified summaries of individual profiles, such as averages computed across the study period, are used for downstream analyses, including regression-style modeling. Although such summaries can be convenient, they may fail to fully capture dynamic temporal patterns present in the complete longitudinal profiles. To address this, we borrow measures from sequence analysis that capture individual-level patterns over time and then applied principal component analysis (PCA) followed by $K$-means clustering to identify unobserved latent groups of individuals with similar profiles. We test our approach using simulated data from a categorical functional regression model and compare its performance with two commonly used methods for detecting unobserved group structures: latent class analysis (LCA), and latent transition analysis (LTA). Using EMA stress observations from a large sample of U.S. adults (Newman et al., 2024, 2025), we identify distinct latent stress profile groups and show that they improve characterization of the impact on cognitive performance.
Editorial analysis
A structured set of objections, weighed in public.
Referee Report
Summary. The paper introduces a pipeline for clustering ordinal EMA data by applying sequence analysis measures to capture temporal patterns in individual profiles, followed by PCA and K-means to identify latent groups. It evaluates this method against LCA and LTA using simulations from a categorical functional regression model, and demonstrates its application on real EMA stress data from a large U.S. adult sample, claiming that the resulting groups provide improved characterization of effects on cognitive performance compared to mean-based summaries.
Significance. If the results hold, the method offers a promising extension beyond mean summaries for handling variable-length longitudinal EMA data, potentially leading to more nuanced understanding of dynamic stress profiles and their cognitive impacts. Strengths include the use of established sequence analysis tools, simulation-based validation of group recovery, and a real-world application. However, the significance is tempered by the need for rigorous validation to ensure the clusters capture genuine structure rather than artifacts.
major comments (2)
- [Abstract] Abstract and real-data analysis: The central claim that the identified stress profile groups 'improve characterization of the impact on cognitive performance' is based on regressions using clusters derived from the full EMA sequences in the same sample. This risks inflated improvement metrics because the data-driven partitioning is not accounted for in inference. The simulation study validates recovery of known groups but does not replicate the two-stage real-data workflow or test whether the downstream improvement survives out-of-sample validation (e.g., clustering on training subset only).
- [Simulation study] Simulation study: While the categorical functional regression model tests group recovery, it does not evaluate the full pipeline's effect on cognitive performance modeling when clustering is performed on a training subset and assessed on held-out data. This leaves the real-data claim that groups add explanatory power beyond means untested against the risk of selection-induced bias.
minor comments (1)
- [Abstract] The abstract supplies no quantitative performance metrics, simulation details (e.g., recovery rates, sample sizes), or real-data results (e.g., cluster sizes, R² gains), making it impossible to assess the strength of the comparisons or improvements.
Simulated Author's Rebuttal
Thank you for the opportunity to respond to the referee's report. We appreciate the referee's careful reading and the insightful comments on the validation of our proposed method, particularly concerning the real-data analysis and simulation design. We provide point-by-point responses below.
read point-by-point responses
-
Referee: [Abstract] Abstract and real-data analysis: The central claim that the identified stress profile groups 'improve characterization of the impact on cognitive performance' is based on regressions using clusters derived from the full EMA sequences in the same sample. This risks inflated improvement metrics because the data-driven partitioning is not accounted for in inference. The simulation study validates recovery of known groups but does not replicate the two-stage real-data workflow or test whether the downstream improvement survives out-of-sample validation (e.g., clustering on training subset only).
Authors: We agree that this is a valid concern. Performing clustering on the full sample and then regressing cognitive performance outcomes on the resulting groups within the same data can introduce selection bias and produce inflated estimates of improvement over mean-based summaries. The simulation study is limited to assessing recovery of known groups under the categorical functional regression model and does not simulate the complete two-stage pipeline with held-out evaluation of downstream regression performance. In the revised manuscript, we will add an explicit limitations discussion qualifying the real-data claims as descriptive rather than providing formal inference that accounts for the clustering step, and we will suggest out-of-sample validation strategies for future work. revision: yes
-
Referee: [Simulation study] Simulation study: While the categorical functional regression model tests group recovery, it does not evaluate the full pipeline's effect on cognitive performance modeling when clustering is performed on a training subset and assessed on held-out data. This leaves the real-data claim that groups add explanatory power beyond means untested against the risk of selection-induced bias.
Authors: This comment correctly identifies a scope limitation of the simulation. While the simulation demonstrates that sequence analysis metrics followed by PCA and K-means can recover groups more effectively than LCA or LTA under the data-generating process, it does not extend to evaluating how the full pipeline affects explanatory power in a cognitive performance regression when clustering is restricted to a training subset. We will revise the simulation section to clarify its intended scope and will incorporate a discussion of selection-induced bias risks when interpreting the real-data results, along with recommendations for cross-validation in applied settings. revision: yes
Circularity Check
No significant circularity; derivation applies external measures and standard clustering to independent outcome
full rationale
The paper borrows sequence analysis measures from the literature, applies PCA followed by K-means to cluster ordinal EMA stress profiles, validates recovery via simulation under a categorical functional model, and then uses the resulting groups to characterize associations with a separate cognitive performance outcome in real data. No equation reduces a claimed result to its own inputs by construction, no fitted parameter is relabeled as a prediction, and no load-bearing premise depends on self-citation chains or imported uniqueness theorems. The downstream regression step treats clusters as an observed covariate rather than deriving the outcome from the clustering process itself. This workflow remains self-contained and externally falsifiable.
Axiom & Free-Parameter Ledger
axioms (1)
- domain assumption Standard assumptions underlying PCA, K-means, and sequence analysis measures hold for the derived ordinal EMA profiles.
Reference graph
Works this paper leans on
-
[1]
doi: 10.1037/0033-2909.133.5.761. Place: US. A. S. Cain, A. J. Epler, D. Steinley, and K. J. Sher. Stability and Change in Patterns of Concerns Related to Eating, Weight, and Shape in Young Adult Women: A Latent Transition Analysis.Journal of abnormal psychology, 119(2):255–267, May 2010. ISSN 0021-843X. doi: 10.1037/a0018117. URLhttps://www.ncbi. nlm.nih...
-
[2]
ISSN 0049-1241, 1552-8294. doi: 10.1177/0049124109357535. URLhttps://journals.sagepub.com/ doi/10.1177/0049124109357535. E. S. Epel, A. D. Crosswell, S. E. Mayer, A. A. Prather, G. M. Slavich, E. Puterman, and W. B. Mendes. More than a feeling: A unified view of stress measurement for population science.Frontiers in Neu- roendocrinology, 49:146–169, Apr. ...
-
[3]
URLhttps://www.frontiersin.org/journals/sleep/articles/ 10.3389/frsle.2024.1359723/full
doi: 10.3389/frsle.2024.1359723. URLhttps://www.frontiersin.org/journals/sleep/articles/ 10.3389/frsle.2024.1359723/full. M. Greenacre, P. J. F. Groenen, T. Hastie, A. I. D’Enza, A. Markos, and E. Tuzhilina. Principal compo- nent analysis.Nature Reviews Methods Primers, 2(1):1–21, Dec. 2022. ISSN 2662-8449. doi: 10.1038/ s43586-022-00184-w. URLhttps://www...
-
[4]
doi: 10.1016/j.ejphar.2007.11.071
ISSN 0014-2999. doi: 10.1016/j.ejphar.2007.11.071. URLhttps://www.sciencedirect.com/science/ article/pii/S0014299908000277. B. S. McEwen. Neurobiological and Systemic Effects of Chronic Stress.Chronic Stress, 1:2470547017692328, Feb. 2017. ISSN 2470-5470. doi: 10.1177/2470547017692328. URLhttps://doi.org/10.1177/ 2470547017692328. A. M. Mournet and E. M. ...
discussion (0)
Sign in with ORCID, Apple, or X to comment. Anyone can read and Pith papers without signing in.