Recognition: unknown
The lifetime of 100,000 molecular clouds in the nearby Universe
Pith reviewed 2026-05-08 02:31 UTC · model grok-4.3
The pith
Giant molecular clouds form in 20-100 million years and last only 1 percent of the molecular depletion time.
A machine-rendered reading of the paper's core claim, the machinery that carries it, and where it could break.
Core claim
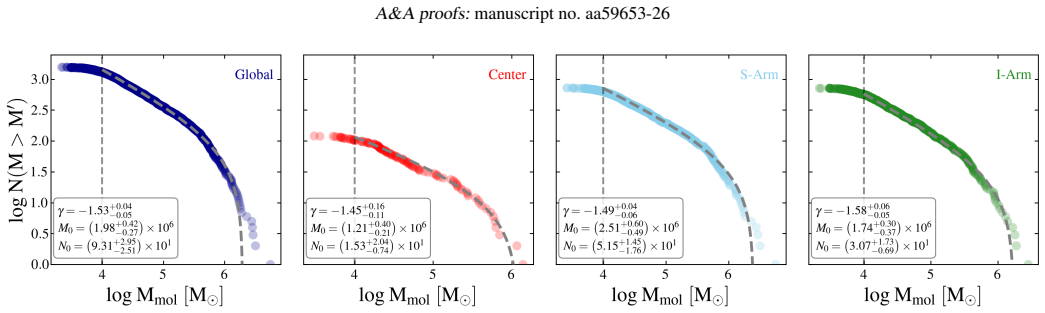
Using the mass spectra of over 100,000 GMCs whose slopes range from -1.2 to -2.0, the authors invert a multiple-compression formation model to obtain mass-dependent formation times of 20 Myr for clouds below 10^5 solar masses up to 100 Myr for 10^6-10^7 solar-mass clouds. These times are 5-10 Myr shorter in central regions, exceed the free-fall time by 0.1 dex, and imply that cloud lifetimes are only 1 percent of the molecular depletion time, with little radial variation in either spiral or disk galaxies.
What carries the argument
Inversion of the GMC mass spectrum under a multiple feedback-compression formation model to derive cloud formation times directly from the power-law slope.
If this is right
- Cloud assembly is accelerated in high-density, high-star-formation environments such as central molecular zones.
- Star formation is inefficient because clouds disperse long before consuming most of the available molecular gas.
- More massive clouds take longer to form, indicating they persist longer than lower-mass clouds.
- Formation timescales show only limited change with galactocentric radius, implying similar processes operate in spiral and disk galaxies.
Where Pith is reading between the lines
- The same inversion technique could be tested on higher-redshift galaxies once comparable mass spectra become available.
- Simulations that include magnetic fields or additional feedback should reproduce both the observed mass spectra and the 0.1 dex offset from free-fall.
- Higher-resolution observations could check whether the derived times remain stable when smaller-scale structure and completeness are better resolved.
Load-bearing premise
The multiple feedback compression model can be inverted from the observed mass spectrum to recover formation times without major bias from resolution, completeness, or unmodeled physics.
What would settle it
Direct kinematic age measurements or star-formation history comparisons that find no systematic 0.1 dex excess over free-fall times for the same mass range would falsify the derived formation timescales.
Figures


read the original abstract
Multiple mechanisms are proposed for the formation of giant molecular clouds (GMCs), from gravitational free-fall caused by self-gravity to stellar feedback-driven gas compression. Both the galactic environment and galaxy conditions could play an additional role in enhancing the formation via their gas surface density and star formation activity. In this paper, we make use of a catalog of 108,466 GMCs identified by F770W PHANGS--JWST imaging across 66 galaxies at a homogenized resolution of 30~pc. We measure the mass spectra in various galactic regions, whose power-law slopes vary from $-1.2$ to $-2.0$. We then estimate the formation time of each cloud using a model where GMCs form from multiple feedback compression, and find that clouds with masses $\leq 10^{5}\,M_{\odot}$ form, on average, in 20~Myr, with more massive clouds ($\sim 10^{6}$--$10^{7}\,M_{\odot}$) taking up to 100~Myr. We also find that cloud formation proceeds most rapidly in the central regions of galaxies, with formation timescales that are typically shorter by $\sim 5$--$10$~Myr compared to galactic disks. This effect is most pronounced in central molecular zones with enhanced star formation, highlighting the role of intense massive star formation, high molecular gas surface densities, and strong supersonic compressions in accelerating cloud formation. However, star formation is generally inefficient as the cloud lifetime is $\sim 1\,\%$ of the molecular depletion time. The formation time of clouds is $\sim 0.1$~dex longer than the free-fall time. This hints that magnetic fields, stellar feedback, or other mechanisms may prolong their formation instead of immediate free-fall collapse. This indicates a longevity of massive GMCs. The GMC ages also show only limited variation with galactocentric radius in both spiral and disk galaxies, suggesting that cloud formation proceeds similarly in these galaxy types.
Editorial analysis
A structured set of objections, weighed in public.
Referee Report
Summary. The paper analyzes a catalog of 108,466 GMCs identified via F770W PHANGS-JWST imaging in 66 nearby galaxies at homogenized 30 pc resolution. It measures power-law slopes of the GMC mass spectra across galactic regions (ranging from -1.2 to -2.0), inverts a multiple-feedback-compression formation model to derive cloud formation timescales (averaging ~20 Myr for ≤10^5 M⊙ clouds and up to 100 Myr for 10^6–10^7 M⊙ clouds), reports faster formation in galactic centers by 5–10 Myr, finds cloud lifetimes ~1% of the molecular depletion time, and concludes that formation times are ~0.1 dex longer than free-fall times, implying additional mechanisms (e.g., magnetic fields or feedback) prolong collapse. Regional trends with galactocentric radius are also examined.
Significance. If the model inversion and timescale estimates prove robust, the work offers one of the largest statistical samples constraining GMC formation across diverse environments, with the multi-galaxy coverage and regional splits providing evidence for the accelerating role of high gas densities and star formation activity in centers. The large sample size (>100k clouds) is a clear strength for population-level inferences on inefficiency and longevity.
major comments (4)
- The central claim that formation times are ~0.1 dex longer than free-fall times (and the derived 20–100 Myr values) rests on inverting the multiple-feedback-compression model from the observed mass-spectrum slopes. The manuscript provides no explicit derivation of this inversion, no functional mapping from slope to timescale, and no demonstration that model parameters are fixed independently of the same mass spectra, creating a risk of circularity for the offset result.
- No error budget, uncertainty quantification, or sensitivity tests are presented for the formation time estimates or the free-fall comparison (abstract and results sections). Validation against independent age indicators (e.g., stellar population clocks) or alternative formation models is also absent, which is load-bearing given the claimed 0.1 dex offset and the 1% depletion-time fraction.
- The impact of the 30 pc homogenized resolution and catalog completeness on the low-mass end of the mass spectra (slopes down to -2.0) and the recovered timescales is not quantified or corrected for, despite the model inversion depending on the full shape of the spectra (methods and results sections). This directly affects the reliability of the 20 Myr low-mass and radial-trend claims.
- The assertion that cloud lifetime is ~1% of the molecular depletion time lacks the explicit per-region or per-galaxy calculation of depletion times (from SFR and gas mass) together with their uncertainties (results section), making the inefficiency conclusion difficult to assess independently.
minor comments (2)
- The methods section would benefit from a clearer description of how the 30 pc resolution homogenization affects cloud identification and mass assignment, including any applied completeness corrections.
- Additional references to prior GMC lifetime and mass-spectrum studies (e.g., from ALMA PHANGS or other surveys) should be included to better contextualize the new JWST-based results and slopes.
Simulated Author's Rebuttal
We thank the referee for their thorough and constructive review of our manuscript. We address each major comment below and will revise the paper accordingly to improve clarity, robustness, and transparency of the methods and results.
read point-by-point responses
-
Referee: The central claim that formation times are ~0.1 dex longer than free-fall times (and the derived 20–100 Myr values) rests on inverting the multiple-feedback-compression model from the observed mass-spectrum slopes. The manuscript provides no explicit derivation of this inversion, no functional mapping from slope to timescale, and no demonstration that model parameters are fixed independently of the same mass spectra, creating a risk of circularity for the offset result.
Authors: We agree that the explicit derivation of the model inversion was insufficiently detailed. In the revised manuscript, we will add a dedicated subsection in the Methods detailing the mathematical inversion from the power-law slope of the GMC mass spectrum to the formation timescale within the multiple-feedback-compression framework. We will include the functional mapping (e.g., timescale as a function of slope and model parameters) and demonstrate that the model parameters (feedback compression factors, etc.) are fixed from prior theoretical work and hydrodynamic simulations, independent of the PHANGS mass spectra used here. This ensures the 0.1 dex offset is not circular but arises from applying the model to the data. We will also reference the original model paper for full context. revision: yes
-
Referee: No error budget, uncertainty quantification, or sensitivity tests are presented for the formation time estimates or the free-fall comparison (abstract and results sections). Validation against independent age indicators (e.g., stellar population clocks) or alternative formation models is also absent, which is load-bearing given the claimed 0.1 dex offset and the 1% depletion-time fraction.
Authors: We acknowledge the absence of a formal error analysis. In the revision, we will introduce an uncertainty quantification subsection. This will include: (1) uncertainties on mass spectrum slopes via bootstrap resampling of the catalog; (2) propagation of these and model parameter uncertainties into the formation timescales; (3) sensitivity tests varying key assumptions (e.g., number of feedback events, compression efficiency) by 20-50% and showing impact on timescales. For the free-fall comparison, error bars will be added to the 0.1 dex difference. On validation, a comprehensive check against stellar population ages for the full 108k sample is not possible with existing data, as it would require high-resolution optical/UV imaging and SED fitting not uniformly available. However, we will add comparisons to published GMC age estimates from other methods and galaxies in the literature to support our results. We view this as a limitation to be noted. revision: partial
-
Referee: The impact of the 30 pc homogenized resolution and catalog completeness on the low-mass end of the mass spectra (slopes down to -2.0) and the recovered timescales is not quantified or corrected for, despite the model inversion depending on the full shape of the spectra (methods and results sections). This directly affects the reliability of the 20 Myr low-mass and radial-trend claims.
Authors: This is a valid concern. We will add a new analysis quantifying resolution and completeness effects. Using simulated observations of model GMCs at 30 pc resolution, we will assess the recovery fraction as a function of mass and how it biases the low-mass slope. We will demonstrate that slopes are stable for M > 10^4 M_sun and apply a correction or mass cut for the timescale derivation. The radial trends will be re-examined with completeness-corrected spectra. These results and any adjustments to the 20 Myr and 5-10 Myr claims will be presented in the revised Methods and Results. revision: yes
-
Referee: The assertion that cloud lifetime is ~1% of the molecular depletion time lacks the explicit per-region or per-galaxy calculation of depletion times (from SFR and gas mass) together with their uncertainties (results section), making the inefficiency conclusion difficult to assess independently.
Authors: We will rectify this by adding explicit calculations. Using the PHANGS SFR and molecular gas mass maps, we will compute depletion times (M_mol / SFR) for each galactic region (center, disk, etc.) and per galaxy, reporting mean values with uncertainties from the respective measurement errors. These will be tabulated or plotted alongside the cloud lifetime estimates to directly show the ~1% ratio and its variation. This addition will allow independent assessment of the inefficiency conclusion. revision: yes
- Full validation of formation timescales using independent stellar population age indicators for the entire catalog, due to lack of uniform ancillary data across all 66 galaxies.
Circularity Check
Formation times obtained by inverting multiple-feedback-compression model on mass-spectrum slopes; 0.1 dex offset from free-fall time is model-dependent rather than independent test.
specific steps
-
fitted input called prediction
[Abstract]
"We then estimate the formation time of each cloud using a model where GMCs form from multiple feedback compression, and find that clouds with masses ≤10^5 M_⊙ form, on average, in 20 Myr, with more massive clouds (~10^6--10^7 M_⊙) taking up to 100 Myr. ... The formation time of clouds is ~0.1 dex longer than the free-fall time."
The formation times and the claimed 0.1 dex offset are not measured directly but recovered by inverting the multiple-compression model on the observed mass-spectrum slopes (-1.2 to -2.0). Because the model maps slope to duration distribution, the numerical values (20 Myr, 100 Myr, 0.1 dex) are fixed once the slopes and the model's functional form are chosen; they are not an external prediction but a re-expression of the input spectra under that ansatz.
full rationale
The central result (formation times ~20-100 Myr, ~0.1 dex above free-fall, ~1% of depletion time) is produced by applying an inversion of the 'GMCs form from multiple feedback compression' model directly to the measured power-law indices of the mass spectra. No independent calibration of the model's parameters (e.g., compression-event statistics or destruction timescales) is shown outside the same spectra; the slope-to-time mapping therefore embeds the model's assumptions into the reported timescales. This matches the 'fitted input called prediction' pattern: the output quantities are generated from the input data via the chosen functional form rather than measured separately. The paper remains self-contained on the spectral slopes themselves but the interpretive step that converts slopes into physical formation times reduces to the model by construction.
Axiom & Free-Parameter Ledger
axioms (1)
- domain assumption GMCs form from multiple feedback compression events whose cumulative effect can be inverted from the observed mass spectrum to yield a formation timescale
Reference graph
Works this paper leans on
-
[1]
2022, ApJ, 940, 106 Ali, A., Harries, T
Abe, D., Inoue, T., Enokiya, R., & Fukui, Y . 2022, ApJ, 940, 106 Ali, A., Harries, T. J., & Douglas, T. A. 2018, MNRAS, 477, 5422 Asplund, M., Grevesse, N., Sauval, A. J., & Scott, P . 2009, ARA&A, 47, 481 Barnes, A. T., Watkins, E. J., Meidt, S. E., et al. 2023, ApJ, 944, L22 Bazzi, Z., Colombo, D., Bigiel, F., et al. 2026, A&A, 706, A40 Belfiore, F., Le...
2022
-
[2]
(2015) evolution scenario
Upon Taylor expansion, Tf(m) = Tf [(1 + βm/mtrunc)], and mcrit = mtrunc/β, where mcrit is the typical maximum GMC mass that can be created in the Inutsuka et al. (2015) evolution scenario. In Fig. C.1, we show how the age of a GMC varies when we add a truncation, where deviations start to occur at the more massive end of the mass spectrum (M mol ≳ 106 M⊙)...
2015
-
[3]
and cst (constant αCO), where the percentage di fferences are computed as (SL24 − cst)/cst. Env. γSL24 γcst ∆γ [%] Tf, SL24 [Myr] Tf, cst [Myr] ∆Tf [%] Global −1.51+0.13 −0.18 −1.59+0.15 −0.30 −3.0+9.2 −10.9 7.34+2.23 −2.11 7.78+3.43 −2.14 −8.8+27.8 −26.4 Center −1.34+0.05 −0.12 −1.40+0.12 −0.11 −1.4+4.8 −11.7 5.09+1.91 −1.79 6.18+1.86 −2.15 −5.2+16.4 −32....
2024
discussion (0)
Sign in with ORCID, Apple, or X to comment. Anyone can read and Pith papers without signing in.