Microlensing time-scales and flux magnification probabilities of a sample of 204 lensed quasars
Pith reviewed 2026-05-07 14:59 UTC · model grok-4.3
The pith
Modeling microlensing across 204 lensed quasars estimates an average quasar half-light radius of 5.4 light-days and requires at least 15 percent of lens mass in compact objects.
A machine-rendered reading of the paper's core claim, the machinery that carries it, and where it could break.
Core claim
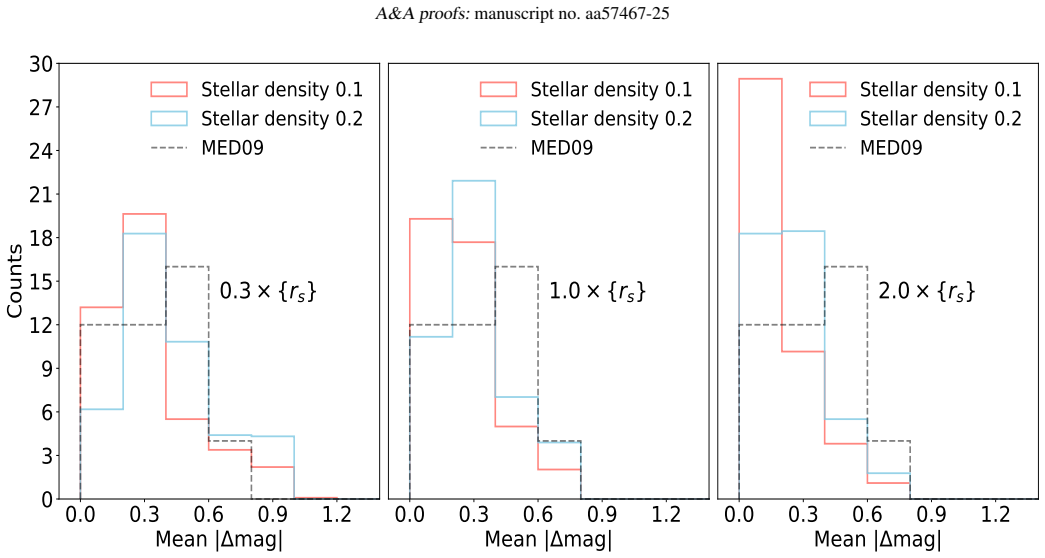
By generating microlensing magnification maps for each image in 204 lensed quasar systems and comparing the histograms of mean microlensing magnifications to the experimental distribution, while adopting thin-disk source sizes scaled to recent measurements, the work finds that a microlens mass fraction α = 0.2 produces a good match and yields an average source half-light radius R_{1/2} = 5.4 ± 2.7 light-days with α ≥ 0.15 as a lower limit. The same modeling gives a mean source crossing time of 2.59 ± 0.07 years and an Einstein radius crossing time of 11.29 ± 0.05 years, plus an average 9 percent probability that any given image experiences a high-magnification event.
What carries the argument
Microlensing magnification maps and histograms generated by automatic lens modeling of each of the 204 systems, which encode the combined effects of source size, optical depth, and microlens mass fraction for direct statistical comparison with observed magnifications.
If this is right
- A microlens mass fraction of 0.2 produces a modeled magnification histogram that matches the observed one.
- The average quasar source half-light radius is 5.4 ± 2.7 light-days.
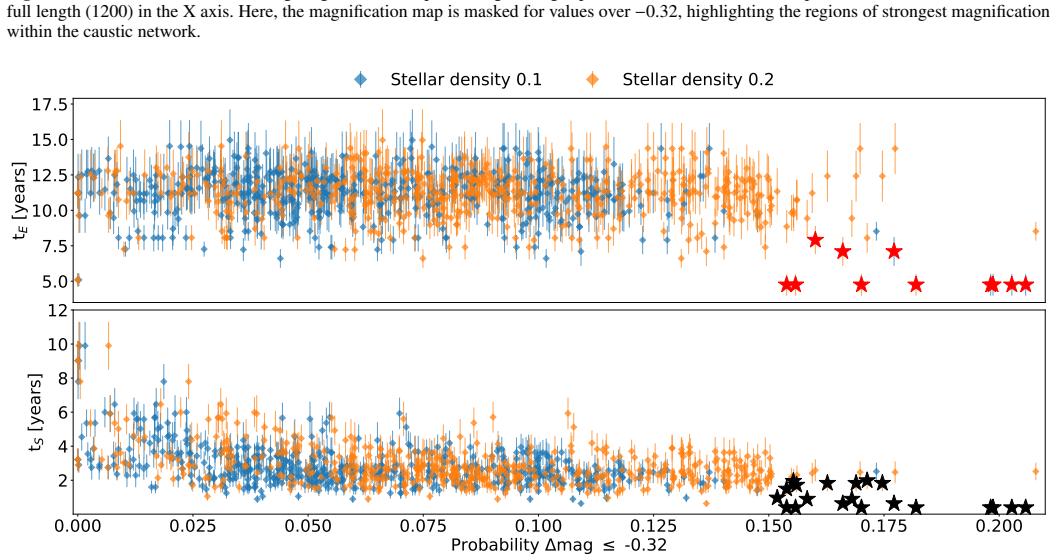
- Any given lensed image has approximately a 9 percent probability of a high-magnification event with Δm ≤ -0.32.
- A subset of images with the largest high-magnification probabilities and smallest crossing times can be identified for targeted monitoring.
Where Pith is reading between the lines
- Future larger samples from wide-field surveys could tighten the constraints on both average source size and the microlens mass fraction.
- The reported crossing times imply that multi-year monitoring campaigns are needed to capture typical microlensing variability in most systems.
- If the thin-disk scaling holds across the sample, it supports standard accretion-disk models for quasars at a wide range of redshifts.
- The 9 percent high-magnification probability indicates that a non-negligible fraction of known lensed images are currently experiencing significant flux changes.
Load-bearing premise
Automatic lens modeling applied uniformly to all 204 systems produces accurate magnification maps, and scaling thin-disk source sizes to recent measurements correctly represents the emitting region in every quasar.
What would settle it
An independent size measurement, such as from reverberation mapping or interferometry, that yields a mean half-light radius for these quasars differing by more than a few light-days from 5.4 would falsify the reported average.
Figures





read the original abstract
Quasar microlensing is both a very useful tool in cosmology and astrophysics, and a source of uncertainty in some studies like the determination of the Hubble constant from lensed quasars. Microlensing probability and time-scales have been statistically studied using as a reference scale the Einstein ring crossing time of an isolated mass. Our goal is to extend the statistical analysis of microlensing to all currently known lensed quasars with available data, considering realistic optical depths and the gravitational effect of the lens galaxy. We take into account new observational results about quasar sizes and peculiar velocities of lens galaxies. We apply automatic lens modeling to the 204 systems available. For each image, we compute microlensing magnification maps and histograms. Using thin disk source sizes scaled to take into account recent measurements of accretion disk sizes, we find a mean source crossing time of $2.59\pm 0.07$ years. The mean Einstein radius crossing time is $ 11.29 \pm 0.05$ years. When a fraction of mass in microlenses $\alpha=0.2$ is adopted, we find a good matching between the modeled histogram of mean microlensing magnifications for the images in our sample and the experimental histogram of microlensing magnifications. From the modeling of microlensing magnification histograms, we estimate the average half-light radius of the quasar source, $R_{1/2}=5.4\pm 2.7$ light-days, and a lower limit to the mass fraction in microlenses, $\alpha\ge 0.15$. From the microlensing magnification maps, we find that a lensed quasar image has a mean probability of approximately 9% of being involved in a high-magnification event ($\Delta m \le -0.32$). We select a group of images with the largest probabilities and the smallest crossing times.
Editorial analysis
A structured set of objections, weighed in public.
Referee Report
Summary. The paper performs a statistical study of microlensing in 204 lensed quasars by applying automatic lens modeling to produce magnification maps and histograms for each image. Incorporating realistic optical depths, galaxy effects, and thin-disk source sizes scaled from recent measurements, it reports a mean source crossing time of 2.59 ± 0.07 years and Einstein radius crossing time of 11.29 ± 0.05 years. Adopting α = 0.2 yields a match between modeled and observed mean-magnification histograms, from which the authors derive an average quasar half-light radius R_{1/2} = 5.4 ± 2.7 light-days and a lower limit α ≥ 0.15, plus a ~9% mean probability of high-magnification events (Δm ≤ -0.32) and a selected subsample of high-probability images.
Significance. If the automatic modeling and source scaling hold, the work supplies the largest-sample constraints to date on quasar accretion-disk sizes and the microlens mass fraction, with direct utility for time-delay cosmography and accretion physics. The uniform treatment of 204 systems and the concrete, uncertainty-quantified time-scale and probability estimates constitute a clear advance over smaller prior studies.
major comments (3)
- [Abstract] Abstract: The choice of α = 0.2 is stated to produce a good match to the experimental histogram, after which the same modeling is used to report a lower limit α ≥ 0.15; this procedure reduces the independence of the lower-limit claim and requires explicit justification of how the threshold was set without circularity.
- [Automatic lens modeling] Automatic lens modeling description: No external validation (e.g., comparison of automatic vs. published manual models on a subset of lenses) or per-system goodness-of-fit metrics are reported; because the aggregate histogram comparison underpins both the R_{1/2} estimate and the α ≥ 0.15 limit, systematic offsets in even a modest fraction of magnification maps would propagate directly into the headline results.
- [Source modeling] Source-size scaling procedure: The thin-disk sizes are scaled uniformly to external measurements, yet the scaling factor is listed among the free parameters; without a clear, object-by-object justification or sensitivity test, this choice affects the convolution step that produces the modeled histogram and the derived R_{1/2} value.
minor comments (2)
- [Abstract] The abstract would benefit from stating the total number of images analyzed in addition to the 204 systems.
- [Introduction] Notation for crossing times and R_{1/2} should be defined at first use with explicit units and reference to the thin-disk model employed.
Simulated Author's Rebuttal
We thank the referee for the constructive comments, which help improve the clarity and robustness of our analysis. We address each major comment below and indicate where revisions will be made.
read point-by-point responses
-
Referee: [Abstract] The choice of α = 0.2 is stated to produce a good match to the experimental histogram, after which the same modeling is used to report a lower limit α ≥ 0.15; this procedure reduces the independence of the lower-limit claim and requires explicit justification of how the threshold was set without circularity.
Authors: We agree that the abstract and main text could better separate the representative value from the limit derivation to avoid any appearance of circularity. α = 0.2 was selected as a fiducial value yielding a close match to the observed mean-magnification histogram. The lower limit α ≥ 0.15 is obtained independently by scanning α downward until the modeled histogram deviates from the data beyond the reported uncertainties. We will revise the abstract and add an explicit paragraph in Section 3 describing the threshold procedure and confirming the independence of the limit. revision: yes
-
Referee: [Automatic lens modeling] No external validation (e.g., comparison of automatic vs. published manual models on a subset of lenses) or per-system goodness-of-fit metrics are reported; because the aggregate histogram comparison underpins both the R_{1/2} estimate and the α ≥ 0.15 limit, systematic offsets in even a modest fraction of magnification maps would propagate directly into the headline results.
Authors: The automatic modeling employs the same established pipeline used in our prior publications on smaller samples, with parameters constrained by the observed image positions and flux ratios. We did not include a dedicated external validation subset or per-system χ² metrics in the present work. We will add a new subsection discussing the method's internal consistency checks, quoting the typical residuals from the lens equation solutions, and noting that the statistical results are robust to modest per-system errors given the sample size of 204. A full manual re-modeling of a validation subset lies beyond the scope of this statistical study. revision: partial
-
Referee: [Source modeling] Source-size scaling procedure: The thin-disk sizes are scaled uniformly to external measurements, yet the scaling factor is listed among the free parameters; without a clear, object-by-object justification or sensitivity test, this choice affects the convolution step that produces the modeled histogram and the derived R_{1/2} value.
Authors: Because individual size measurements exist for only a small fraction of the 204 systems, we apply a uniform scaling factor anchored to the recent observational compilation cited in the paper. This factor is varied within the modeling to produce the best match to the observed histogram, directly yielding the reported R_{1/2}. We will add a sensitivity test (new figure or table) showing how R_{1/2} and the α limit shift when the scaling factor is changed by ±30 % around the adopted value, thereby quantifying the impact on the final results. revision: yes
Circularity Check
α=0.2 adopted to match histograms then used to derive α≥0.15 lower limit from same models
specific steps
-
fitted input called prediction
[Abstract]
"When a fraction of mass in microlenses α=0.2 is adopted, we find a good matching between the modeled histogram of mean microlensing magnifications for the images in our sample and the experimental histogram of microlensing magnifications. From the modeling of microlensing magnification histograms, we estimate the average half-light radius of the quasar source, R_{1/2}=5.4±2.7 light-days, and a lower limit to the mass fraction in microlenses, α≥0.15."
α=0.2 is explicitly chosen to achieve the histogram match; the subsequent lower-limit estimate α≥0.15 is then extracted from the identical set of models, so the reported bound is not an independent prediction but a direct consequence of the fitting choice.
full rationale
The central estimates for source size and microlens mass fraction are obtained after tuning α to produce a match between modeled and observed magnification histograms. This matches the fitted-input-called-prediction pattern with partial circularity, but the thin-disk scaling draws on external measurements and crossing-time statistics appear independent of the α fit. No self-definitional equations, self-citation load-bearing steps, or ansatz smuggling are present in the provided text. The automatic modeling procedure itself is described without reducing to prior self-citations.
Axiom & Free-Parameter Ledger
free parameters (2)
- microlens mass fraction α
- thin-disk source-size scaling factor
axioms (2)
- domain assumption Thin-disk geometry describes the quasar accretion disk for all systems
- domain assumption Automatic lens modeling produces statistically accurate magnification maps for the sample
Reference graph
Works this paper leans on
-
[1]
A., Popovi´c, L
Abajas, C., Mediavilla, E., Muñoz, J. A., Popovi´c, L. ˇC., & Oscoz, A. 2002, ApJ, 576, 640
2002
-
[2]
2018, MNRAS, 474, 3391
Agnello, A., Grillo, C., Jones, T., et al. 2018, MNRAS, 474, 3391
2018
-
[3]
H., Magaña, J., Motta, V ., García-Aspeitia, M
Amante, M. H., Magaña, J., Motta, V ., García-Aspeitia, M. A., & Verdugo, T. 2020, MNRAS, 498, 6013
2020
-
[4]
T., Schuldt, S., Suyu, S
Andika, I. T., Schuldt, S., Suyu, S. H., et al. 2025, A&A, 694, A227
2025
-
[5]
W., Turner, E
Anguita, T., Schmidt, R. W., Turner, E. L., et al. 2008, A&A, 480, 327
2008
-
[6]
C., de Carvalho, E., & Novaes, C
Avila, F., Bernui, A., Nunes, R. C., de Carvalho, E., & Novaes, C. P. 2022, MN- RAS, 509, 2994
2022
-
[7]
Awad, P., Chan, J. H. H., Millon, M., Courbin, F., & Paic, E. 2023, A&A, 673, A88
2023
-
[8]
& Amara, A
Birrer, S. & Amara, A. 2018, Physics of the Dark Universe, 22, 189
2018
-
[9]
2015, ApJ, 813, 102
Birrer, S., Amara, A., & Refregier, A. 2015, ApJ, 813, 102
2015
-
[10]
Blandford, R. D. & Narayan, R. 1992, ARA&A, 30, 311
1992
-
[11]
F., & Kereš, D
Bonaca, A., Conroy, C., Wetzel, A., Hopkins, P. F., & Kereš, D. 2017, ApJ, 845, 101
2017
-
[12]
Chan, J. H. H., Wong, K. C., Ding, X., et al. 2024, MNRAS, 527, 6253
2024
-
[13]
& Moustakas, L
Coe, D. & Moustakas, L. A. 2009, ApJ, 706, 45
2009
-
[14]
Collett, T. E. 2015, ApJ, 811, 20
2015
-
[15]
Cornachione, M. A. & Morgan, C. W. 2020, ApJ, 895, 93 Di Valentino, E., Mena, O., Pan, S., et al. 2021, Classical and Quantum Gravity, 38, 153001 Article number, page 14 F. Ávila-Vera , V . Motta, E. Mediavilla: Microlensing properties of a sample of 204 lensed quasars
2020
-
[16]
2025, A&A, 694, A300
Dux, F., Millon, M., Lemon, C., et al. 2025, A&A, 694, A300
2025
-
[17]
2025, AJ, 170, 44
Erickson, S., Wagner-Carena, S., Marshall, P., et al. 2025, AJ, 170, 44
2025
-
[18]
H., et al
Ertl, S., Schuldt, S., Suyu, S. H., et al. 2023, A&A, 672, A2 Esteban-Gutiérrez, A., Agües-Paszkowsky, N., Mediavilla, E., et al. 2022, ApJ, 929, 123 Esteban-Gutiérrez, A., Mediavilla, E., Jiménez-Vicente, J., & Muñoz, J. A. 2023, ApJ, 954, 172
2023
-
[19]
W., Best, H., et al
Fagin, J., Park, J. W., Best, H., et al. 2024, ApJ, 965, 104
2024
-
[20]
M., Starkey, D
Fausnaugh, M. M., Starkey, D. A., Horne, K., et al. 2018, ApJ, 854, 107
2018
-
[21]
2018, ApJ, 859, 50
Fian, C., Guerras, E., Mediavilla, E., et al. 2018, ApJ, 859, 50
2018
-
[22]
2021, A&A, 654, A70
Fian, C., Mediavilla, E., Jiménez-Vicente, J., et al. 2021, A&A, 654, A70
2021
-
[23]
A., Forés-Toribio, R., et al
Fian, C., Muñoz, J. A., Forés-Toribio, R., et al. 2024, A&A, 682, A57
2024
-
[24]
& Lewis, G
Gil-Merino, R. & Lewis, G. F. 2005, A&A, 437, L15
2005
-
[25]
2008, A&A, 477, 397
Grillo, C., Lombardi, M., & Bertin, G. 2008, A&A, 477, 397
2008
-
[26]
Hagen, H. J. & Reimers, D. 2000, A&A, 357, L29 Heß, S. & Kitaura, F.-S. 2016, MNRAS, 456, 4247
2000
-
[27]
Heydenreich, S., Mediavilla, E., Jiménez-Vicente, J., Vives-Arias, H., & Muñoz, J. A. 2024, A&A, 690, A307
2024
-
[28]
A., Watson, A
Holtzman, J. A., Watson, A. M., Baum, W. A., et al. 1998, AJ, 115, 1946 Hutsemékers, D., Sluse, D., & Savi´c, Ð. 2024, A&A, 691, A292 Ivezi´c, Ž., Kahn, S. M., Tyson, J. A., et al. 2019, ApJ, 873, 111
1998
-
[29]
K., Joshi, R., Chand, H., et al
Jha, V . K., Joshi, R., Chand, H., et al. 2022, MNRAS, 511, 3005 Jiménez-Vicente, J. & Mediavilla, E. 2019, ApJ, 885, 75 Jiménez-Vicente, J. & Mediavilla, E. 2022, ApJ, 941, 80 Jiménez-Vicente, J. & Mediavilla, E. 2025, MNRAS, 541, 1264 Jiménez-Vicente, J., Mediavilla, E., Kochanek, C. S., & Muñoz, J. A. 2015, ApJ, 799, 149 Jiménez-Vicente, J., Mediavilla...
2022
-
[30]
1986, A&A, 166, 36
Kayser, R., Refsdal, S., & Stabell, R. 1986, A&A, 166, 36
1986
-
[31]
Keeton, C. R. 2011, GRA VLENS: Computational Methods for Gravitational
2011
- [32]
-
[33]
Kochanek, C. S. 2004, ApJ, 605, 58
2004
-
[34]
1994, A&A, 284, 285
Kormann, R., Schneider, P., & Bartelmann, M. 1994, A&A, 284, 285
1994
-
[35]
2018, A&A, 616, L11
Krone-Martins, A., Delchambre, L., Wertz, O., et al. 2018, A&A, 616, L11
2018
-
[36]
T., Futamase, T., & Akhlaghi, M
Lefor, A. T., Futamase, T., & Akhlaghi, M. 2013, New A Rev., 57, 1
2013
-
[37]
Leier, D., Ferreras, I., Saha, P., & Falco, E. E. 2011, ApJ, 740, 97
2011
-
[38]
W., et al
Lemon, C., Anguita, T., Auger-Williams, M. W., et al. 2023, MNRAS, 520, 3305
2023
-
[39]
A., Auger, M
Lemon, C. A., Auger, M. W., McMahon, R. G., & Koposov, S. E. 2017, MNRAS, 472, 5023
2017
-
[40]
A., Auger, M
Lemon, C. A., Auger, M. W., McMahon, R. G., & Ostrovski, F. 2018, MNRAS, 479, 5060
2018
-
[41]
R., Schechter, P
Lucey, J. R., Schechter, P. L., Smith, R. J., & Anguita, T. 2018, MNRAS, 476, 927
2018
-
[42]
2012, Research in Astronomy and Astrophysics, 12, 947
Mao, S. 2012, Research in Astronomy and Astrophysics, 12, 947
2012
-
[43]
2024, AJ, 167, 171
Mediavilla, E., Jiménez-Vicente, J., & Motta, V . 2024, AJ, 167, 171
2024
-
[44]
A., & Battaner, E
Mediavilla, E., Jiménez-Vicente, J., Muñoz, J. A., & Battaner, E. 2016, ApJ, 832, 46
2016
-
[45]
A., & Mediavilla, T
Mediavilla, E., Jiménez-vicente, J., Muñoz, J. A., & Mediavilla, T. 2015, ApJ, 814, L26
2015
-
[46]
2017, ApJ, 836, L18
Infante, J. 2017, ApJ, 836, L18
2017
-
[47]
A., et al
Mediavilla, E., Mediavilla, T., Muñoz, J. A., et al. 2011, ApJ, 741, 42
2011
-
[48]
A., Falco, E., et al
Mediavilla, E., Muñoz, J. A., Falco, E., et al. 2009, ApJ, 706, 1451
2009
-
[49]
A., Lopez, P., et al
Mediavilla, E., Muñoz, J. A., Lopez, P., et al. 2006, ApJ, 653, 942
2006
-
[50]
W., Hyer, G
Morgan, C. W., Hyer, G. E., Bonvin, V ., et al. 2018, ApJ, 869, 106
2018
-
[51]
W., Kochanek, C
Morgan, C. W., Kochanek, C. S., Morgan, N. D., & Falco, E. E. 2010, ApJ, 712, 1129
2010
-
[52]
J., Schechter, P
Mortonson, M. J., Schechter, P. L., & Wambsganss, J. 2005, ApJ, 628, 594
2005
-
[53]
Mosquera, A. M. & Kochanek, C. S. 2011, ApJ, 738, 96 Muñoz, J. A., Falco, E. E., Kochanek, C. S., et al. 1998, Ap&SS, 263, 51
2011
-
[54]
2020, MNRAS, 495, 544
Neira, F., Anguita, T., & Vernardos, G. 2020, MNRAS, 495, 544
2020
-
[55]
2025, A&A, 701, A35
Neira, F., Anguita, T., & Vernardos, G. 2025, A&A, 701, A35
2025
-
[56]
2021, The Journal of Open Source Software, 6, 2825
Nightingale, J., Hayes, R., Kelly, A., et al. 2021, The Journal of Open Source Software, 6, 2825
2021
-
[57]
& Marshall, P
Oguri, M. & Marshall, P. J. 2010, MNRAS, 405, 2579
2010
-
[58]
1986, ApJ, 304, 1
Paczynski, B. 1986, ApJ, 304, 1
1986
-
[59]
2022, A&A, 659, A21
Paic, E., Vernardos, G., Sluse, D., et al. 2022, A&A, 659, A21
2022
-
[60]
J., Inada, N., et al
Pindor, B., Eisenstein, D. J., Inada, N., et al. 2004, AJ, 127, 1318 Planck Collaboration, Aghanim, N., Akrami, Y ., et al. 2020, A&A, 641, A1
2004
-
[61]
& Kochanek, C
Poindexter, S. & Kochanek, C. S. 2010, ApJ, 712, 658
2010
-
[62]
C., & Fedeli, C
Redlich, M., Bartelmann, M., Waizmann, J. C., & Fedeli, C. 2012, A&A, 547, A66
2012
-
[63]
& Stabell, R
Refsdal, S. & Stabell, R. 1997, A&A, 325, 877
1997
-
[64]
P., Massey, R., et al
Robertson, A., Smith, G. P., Massey, R., et al. 2020, MNRAS, 495, 3727
2020
-
[65]
& Solano, E
Rodrigo, C. & Solano, E. 2020, in XIV .0 Scientific Meeting (virtual) of the Span- ish Astronomical Society, 182
2020
-
[66]
2014, ApJ, 797, 61
Rojas, K., Motta, V ., Mediavilla, E., et al. 2014, ApJ, 797, 61
2014
-
[67]
2023, MNRAS, 518, 1260
Schmidt, T., Treu, T., Birrer, S., et al. 2023, MNRAS, 518, 1260
2023
-
[68]
Schneider, P., Ehlers, J., & Falco, E. E. 1992, Gravitational Lenses
1992
-
[69]
J., Vernardos, G., Collett, T
Shajib, A. J., Vernardos, G., Collett, T. E., et al. 2024, Space Sci. Rev., 220, 87
2024
-
[70]
J., Wong, K
Shajib, A. J., Wong, K. C., Birrer, S., et al. 2022, A&A, 667, A123
2022
-
[71]
Shakura, N. I. & Sunyaev, R. A. 1973, A&A, 24, 337
1973
-
[72]
2013, A&A, 553, A53
Sluse, D., Kishimoto, M., Anguita, T., Wucknitz, O., & Wambsganss, J. 2013, A&A, 553, A53
2013
-
[73]
C., Evans, N
Smith, M. C., Evans, N. W., Belokurov, V ., et al. 2009, MNRAS, 399, 1223
2009
-
[74]
H., Marshall, P
Suyu, S. H., Marshall, P. J., Auger, M. W., et al. 2010, ApJ, 711, 201 The Dark Energy Survey Collaboration. 2005, arXiv e-prints, astro
2010
-
[75]
A., et al
Treu, T., Agnello, A., Baumer, M. A., et al. 2018, MNRAS, 481, 1041
2018
-
[76]
2009, ApJ, 690, 670
Treu, T., Gavazzi, R., Gorecki, A., et al. 2009, ApJ, 690, 670
2009
- [77]
-
[78]
2024, ARA&A, 62, 287
Verde, L., Schöneberg, N., & Gil-Marín, H. 2024, ARA&A, 62, 287
2024
-
[79]
& Fluke, C
Vernardos, G. & Fluke, C. J. 2013, MNRAS, 434, 832
2013
-
[80]
J., Bate, N
Vernardos, G., Fluke, C. J., Bate, N. F., & Croton, D. 2014, ApJS, 211, 16
2014
discussion (0)
Sign in with ORCID, Apple, or X to comment. Anyone can read and Pith papers without signing in.