An Analytics Framework for Modeling Residential Photovoltaic Adoption and Decision Dynamics
Pith reviewed 2026-05-22 03:31 UTC · model grok-4.3
The pith
Residential photovoltaic adoption follows a logistic growth curve driven mainly by imitation effects, with social perception outweighing regulatory and economic factors.
A machine-rendered reading of the paper's core claim, the machinery that carries it, and where it could break.
Core claim
The temporal evolution of residential self-consumption photovoltaic installations is described by a logistic growth function, which supplies evidence that imitation effects constitute a primary driver of adoption decisions; a separate quantitative method shows that social perception exerts a stronger independent impact than regulatory or socioeconomic variables, while spatial analysis reveals correlations with demographic and socioeconomic characteristics of territories.
What carries the argument
Logistic growth function fitted to adoption time series, used to isolate imitation as the dominant mechanism, together with a quantitative estimation procedure that compares the independent influence of social, regulatory, and socioeconomic variables.
If this is right
- Policy makers can target social networks and community visibility campaigns to accelerate uptake instead of relying solely on financial incentives.
- Regional planning can use the identified demographic correlations to prioritize areas with high potential for rapid diffusion.
- The same logistic-plus-external-factor structure supplies a template for forecasting adoption of other household technologies.
- Investment models gain a diagnostic layer that separates imitation-driven growth from externally forced growth.
Where Pith is reading between the lines
- The framework could be tested on adoption data for heat pumps or electric vehicles to check whether imitation remains the leading driver across clean-energy technologies.
- If social perception dominates, small pilot installations in visible public buildings might produce measurable spillover effects on nearby residential uptake.
- The spatial correlations invite follow-up work that separates selection effects (who chooses to live where) from true neighborhood influence.
Load-bearing premise
That an S-shaped curve produced by fitting a logistic function to observed installation counts is caused by imitation rather than by any other unmeasured process that can also generate the same shape.
What would settle it
A time series of installations whose cumulative count is better described by a different functional form, or a controlled comparison showing that regulatory changes or income shifts produce larger shifts in adoption than changes in social perception measures.
Figures


read the original abstract
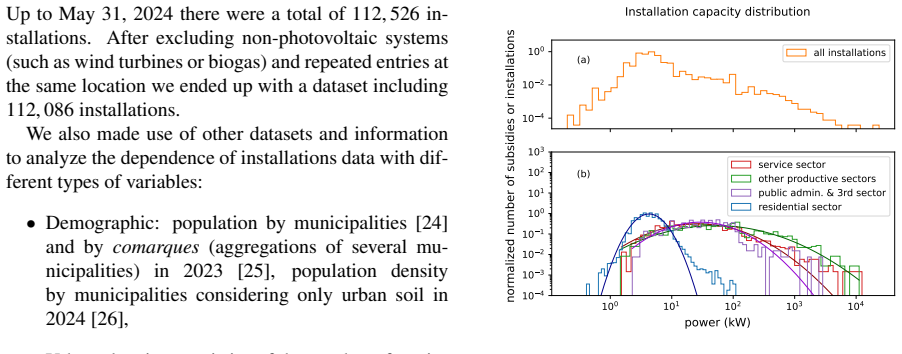
Photovoltaic generation plays a central role in the energy transition, yet understanding its adoption dynamics requires robust analytical frameworks that capture both temporal and spatial patterns of decision behavior. This study applies a data-driven decision analytics approach to examine residential self-consumption photovoltaic installations in Catalonia within an innovation diffusion framework. The temporal evolution of adoption is modeled using a logistic growth function, providing evidence that imitation effects are a primary driver of adoption decisions. To extend the analysis, a quantitative methodology is developed to estimate the influence of external factors on adoption behavior, revealing that social perception exerts a stronger impact than regulatory and socioeconomic variables when considered independently. In addition, a spatial analytics component is incorporated to assess territorial heterogeneity, identifying correlations between adoption patterns and demographic and socioeconomic characteristics. The findings contribute to predictive and diagnostic analytics by offering a structured framework to model technology diffusion and inform policy and investment decisions aimed at accelerating sustainable energy adoption.
Editorial analysis
A structured set of objections, weighed in public.
Referee Report
Summary. The manuscript proposes an analytics framework for residential photovoltaic adoption in Catalonia, modeling temporal dynamics via a logistic growth function interpreted as evidence that imitation effects are a primary driver of decisions. It further develops quantitative methods to assess external factors, claiming social perception has a stronger independent impact than regulatory or socioeconomic variables, and incorporates spatial analytics to link adoption patterns to demographic and socioeconomic characteristics. The work aims to support predictive modeling and policy for sustainable energy diffusion.
Significance. If the logistic fit and factor-influence claims can be substantiated with explicit data sources, alternative-model comparisons, and validation procedures, the framework would offer a structured approach to diffusion analytics that combines temporal, social, and spatial dimensions. This could aid policy design for accelerating PV uptake. However, the absence of reported sample sizes, error metrics, or tests against non-imitation mechanisms currently limits the result's diagnostic value and generalizability beyond the specific case.
major comments (2)
- [Abstract / temporal evolution modeling] Abstract and temporal-modeling section: The assertion that fitting a logistic growth function 'provides evidence that imitation effects are a primary driver' is not an independent test. The logistic form encodes S-shaped growth by construction; equivalent trajectories can arise from heterogeneous adoption thresholds, time-varying policy shocks, or price declines alone. No comparison to alternative specifications that include explicit external drivers or residual diagnostics for remaining imitation signatures is described.
- [Abstract / quantitative methodology for external factors] Abstract and external-factors methodology: The claim that 'social perception exerts a stronger impact than regulatory and socioeconomic variables when considered independently' requires the quantitative estimation procedure, data sources, sample sizes, and statistical controls to be specified. Without these, it is impossible to evaluate whether the ranking reflects genuine relative influence or omitted-variable bias.
minor comments (2)
- [Abstract] The abstract does not cite the underlying adoption time-series dataset, its temporal coverage, or any goodness-of-fit statistics; these details should be added in the methods section for reproducibility.
- [Temporal modeling] Notation for the logistic parameters (growth rate and carrying capacity) should be defined explicitly when first introduced, together with any estimation method (e.g., nonlinear least squares or maximum likelihood).
Simulated Author's Rebuttal
We thank the referee for their thorough review and constructive feedback on our manuscript. We address each of the major comments in detail below, clarifying our approach and indicating revisions to enhance the rigor of the analysis.
read point-by-point responses
-
Referee: [Abstract / temporal evolution modeling] Abstract and temporal-modeling section: The assertion that fitting a logistic growth function 'provides evidence that imitation effects are a primary driver' is not an independent test. The logistic form encodes S-shaped growth by construction; equivalent trajectories can arise from heterogeneous adoption thresholds, time-varying policy shocks, or price declines alone. No comparison to alternative specifications that include explicit external drivers or residual diagnostics for remaining imitation signatures is described.
Authors: We acknowledge that fitting a logistic growth function alone does not provide conclusive independent evidence for imitation effects, as other factors such as policy changes or price declines can generate similar adoption curves. In our manuscript, the logistic model is used within the innovation diffusion framework to characterize the temporal pattern, which is consistent with imitation-driven processes as described in the literature. However, to strengthen this claim, we will add comparisons to alternative models, including those incorporating explicit external drivers (e.g., policy shocks) and perform residual diagnostics to identify any remaining signatures of imitation. This will be included in a revised temporal modeling section. revision: yes
-
Referee: [Abstract / quantitative methodology for external factors] Abstract and external-factors methodology: The claim that 'social perception exerts a stronger impact than regulatory and socioeconomic variables when considered independently' requires the quantitative estimation procedure, data sources, sample sizes, and statistical controls to be specified. Without these, it is impossible to evaluate whether the ranking reflects genuine relative influence or omitted-variable bias.
Authors: We agree that the abstract and methodology require more explicit details to allow proper evaluation. The quantitative methodology employs a regression-based approach on adoption data from official Catalan sources, with a sample covering residential installations over the study period. Social perception is measured via survey-based proxies or media analysis, and we control for regulatory changes and socioeconomic variables. To address concerns about omitted-variable bias, we will expand the description in the revised manuscript to include the full estimation procedure, exact data sources, sample sizes, and additional robustness checks such as alternative specifications and multicollinearity tests. revision: yes
Circularity Check
Logistic growth fit to adoption curve interpreted as evidence for imitation reduces to model choice
specific steps
-
fitted input called prediction
[Abstract]
"The temporal evolution of adoption is modeled using a logistic growth function, providing evidence that imitation effects are a primary driver of adoption decisions."
The logistic growth function is adopted as the model for temporal evolution; its fit to the observed S-shaped adoption curve is then offered as evidence that imitation is the primary causal driver. Because the logistic equation is the standard functional form that arises precisely from imitation mechanisms in diffusion models, the claimed evidence reduces to the choice of functional form rather than an independent test against non-imitation alternatives.
full rationale
The paper's central temporal claim rests on fitting a logistic growth function to the Catalonia PV adoption time series and interpreting the fit as direct evidence that imitation effects are the primary driver. The logistic form is the canonical mathematical expression for imitation-driven diffusion (producing the characteristic S-shape via internal influence terms). Because the abstract presents no comparative fits to alternative specifications that include only exogenous drivers (price declines, policy shocks, or heterogeneous thresholds), the 'evidence' for imitation is not independent of the modeling assumption. This matches the fitted-input-called-prediction pattern and warrants a moderate circularity score; the spatial and external-factor analyses appear to stand apart from this step.
Axiom & Free-Parameter Ledger
free parameters (1)
- logistic growth rate and carrying capacity
axioms (1)
- domain assumption Adoption dynamics follow logistic growth driven by imitation effects
Lean theorems connected to this paper
-
IndisputableMonolith/Cost/FunctionalEquation.leanwashburn_uniqueness_aczel unclear?
unclearRelation between the paper passage and the cited Recognition theorem.
The temporal evolution of adoption is modeled using a logistic growth function, providing evidence that imitation effects are a primary driver of adoption decisions.
-
IndisputableMonolith/Foundation/ArithmeticFromLogic.leanLogicNat recovery and embed_strictMono unclear?
unclearRelation between the paper passage and the cited Recognition theorem.
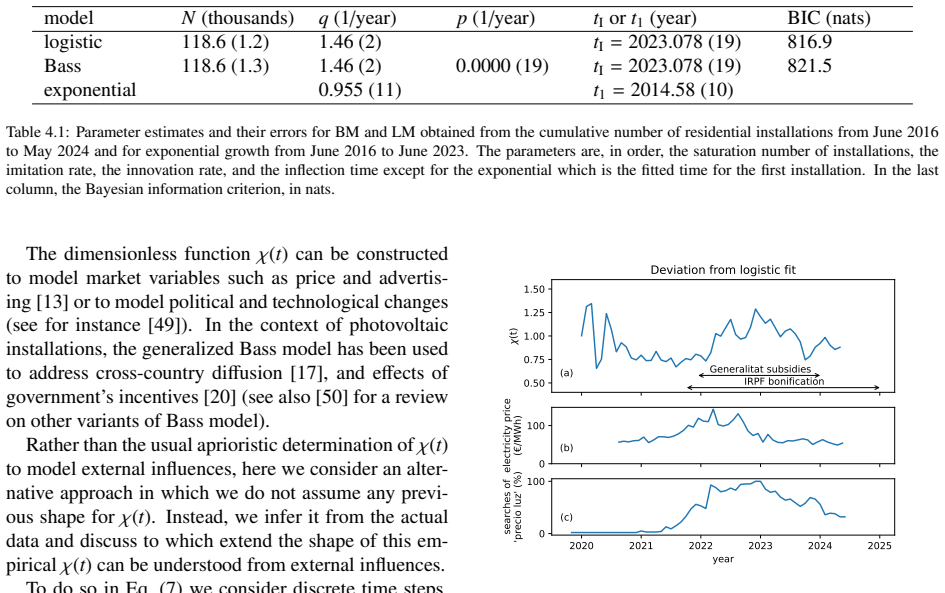
dn(t)/dt = ω(n(t))(N−n(t)) with ω(n)=q n/N for the logistic model
What do these tags mean?
- matches
- The paper's claim is directly supported by a theorem in the formal canon.
- supports
- The theorem supports part of the paper's argument, but the paper may add assumptions or extra steps.
- extends
- The paper goes beyond the formal theorem; the theorem is a base layer rather than the whole result.
- uses
- The paper appears to rely on the theorem as machinery.
- contradicts
- The paper's claim conflicts with a theorem or certificate in the canon.
- unclear
- Pith found a possible connection, but the passage is too broad, indirect, or ambiguous to say the theorem truly supports the claim.
Reference graph
Works this paper leans on
-
[1]
and Trisos, Christopher and Romero, Jos
IPCC. Climate Change 2023: Synthesis Re- port. IPCC, Geneva, Switzerland, 2023. doi: 10.59327/IPCC/AR6-9789291691647. Contribu- tion of Working Groups I, II and III to the Sixth Assessment Report of the Intergovernmental Panel on Climate Change [Core Writing Team, H. Lee and J. Romero (eds.)]
-
[2]
Marcos García-López, Borja Montano, and Joaquín Melgarejo. Household energy con- sumption and the financial feasibility of self- consumption through photovoltaic panels in Spain. Energy Efficiency, 16(6):57, Jun 2023. doi: 10.1007/s12053-023-10139-z. 12
-
[3]
C. Bertsch, J. Geldermann, and T. Lühn. Profitability of household photovoltaic self- consumption in Spain. Journal of Cleaner Production, 279:123439, 2021. doi: 10.1016/ j.jclepro.2020.123439
-
[4]
L. Menezes et al. Economic assessment of residen- tial PV systems with self-consumption and storage in Portugal. Solar Energy, 150:353–362, 2017. doi: 10.1016/j.solener.2017.04.062
- [5]
-
[6]
S.R. Shakeel et al. Solar PV adoption at household level: Insights based on a systematic literature re- view. Energy Strategy Reviews, 50:101178, 2023. doi: 10.1016/j.esr.2023.101178
-
[7]
Varun Rai and Scott A Robinson. Effec- tive information channels for reducing costs of environmentally-friendly technologies: evidence from residential PV markets. Environmental Research Letters, 8(1):014044, 2013
work page 2013
-
[8]
Peer effects in residential solar photovoltaics adoption—A mixed methods study of Swedish users
Alvar Palm. Peer effects in residential solar photovoltaics adoption—A mixed methods study of Swedish users. Energy Research & Social Science, 26:1–10, 2017
work page 2017
-
[9]
What drives home solar PV uptake? Subsidies, peer ef- fects and visibility in Sweden
Luis Mundaca and Margaret Samahita. What drives home solar PV uptake? Subsidies, peer ef- fects and visibility in Sweden. Energy Research & Social Science, 60:101319, 2020
work page 2020
-
[10]
Everett M. Rogers. Diffusionof Innovations. The Free Press, New York, 1962
work page 1962
-
[11]
Technical change and the rate of imitation
Edwin Mansfield. Technical change and the rate of imitation. Econometrica: Journal of the Econometric Society, pages 741–766, 1961
work page 1961
-
[12]
Frank M. Bass. A New Product Growth for Model Consumer Durables. Management Science, 15(5):215–227, 1969. doi: 10.1287/mnsc.15.5.215. URLhttps: //doi.org/10.1287/mnsc.15.5.215
-
[13]
Frank M. Bass, Trichy V . Krishnan, and Dipak C. Jain. Why the Bass Model Fits without Deci- sion Variables. Marketing Science, 13(3):203– 223, 1994. doi: 10.1287/mksc.13.3.203
-
[14]
An analytical framework for managing innovation trajectories in med- ical technology
Andreas Peters. An analytical framework for managing innovation trajectories in med- ical technology. Decision Analytics Journal, 17:100652, 2025. ISSN 2772-6622. doi: https://doi.org/10.1016/j.dajour.2025.100652. URLhttps://www.sciencedirect.com/ science/article/pii/S2772662225001080
-
[15]
Peter C. Schuur. An analytics-based frame- work for military technology adoption and combat strategy. Decision Analytics Journal, 15:100586, 2025. ISSN 2772-6622. doi: https://doi.org/10.1016/j.dajour.2025.100586. URLhttps://www.sciencedirect.com/ science/article/pii/S2772662225000426
-
[16]
Anas Alatawneh and Adam Torok. A predictive modeling framework for forecasting cumula- tive sales of euro-compliant, battery-electric and autonomous vehicles. Decision Analytics Journal, 11:100483, 2024. ISSN 2772-6622. doi: https://doi.org/10.1016/j.dajour.2024.100483. URLhttps://www.sciencedirect.com/ science/article/pii/S2772662224000870
-
[17]
Mariangela Guidolin and Cinzia Mortarino. Cross-country diffusion of photovoltaic systems: modelling choices and forecasts for national adop- tion patterns. Technological forecasting and social change, 77(2):279–296, 2010
work page 2010
-
[18]
A model for resi- dential adoption of photovoltaic systems
Anish Agarwal, Desmond Cai, Sunil Shah, Mani Chandy, and Robert Sherick. A model for resi- dential adoption of photovoltaic systems. In 2015 IEEE Power & Energy Society General Meeting, pages 1–5. IEEE, 2015
work page 2015
-
[19]
A model for commercial adoption of photovoltaic systems in California
Wenyu Wang, Nanpeng Yu, and Raymond John- son. A model for commercial adoption of photovoltaic systems in California. Journal of Renewable and Sustainable Energy, 9(2), 2017
work page 2017
-
[20]
Bunea, Pompeo Della Posta, Mariangela Guidolin, and Piero Manfredi
Anita M. Bunea, Pompeo Della Posta, Mariangela Guidolin, and Piero Manfredi. What do adoption patterns of solar panels observed so far tell about governments’ incentive? Insights from diffusion models. Technological Forecasting and Social Change, 160:120240, 11 2020. doi: 10.1016/ J.TECHFORE.2020.120240
-
[21]
Generalitat de Catalunya. Access to public in- formation.https://tramits.gencat.cat/ en/tramits/tramits-temes/Acces- informacio-publica, . (accessed: 2026- 02-17). 13
work page 2026
-
[22]
Gobierno de España, Ministerio para la Transi- ción Ecológica. Real Decreto 244/2019, de 5 de abril, por el que se regulan las condiciones admin- istrativas, técnicas y económicas del autoconsumo de energía eléctrica.https://www.boe.es/eli/ es/rd/2019/04/05/244. (accessed: 2026-02- 19)
work page 2019
-
[23]
Registre d’Autoconsum a Catalunya (RAC)
Generalitat de Catalunya. Registre d’Autoconsum a Catalunya (RAC). https://mediambient.gencat.cat/ ca/05_ambits_dactuacio/energia/ installacions-domestiques/autoconsum/ registre-autoconsum-catalunya, . (ac- cessed: 2026-02-19)
work page 2026
-
[24]
Statistical Institute of Catalonia. Population. By sex.https://www.idescat.cat/pub/?id= censph&n=538&lang=en, . (accessed: 2026-02- 19)
work page 2026
-
[25]
Statistical Institute of Catalonia. Population as of 1 January. Counties and Aran, areas and provinces. https://www.idescat.cat/indicadors/?id= aec&n=15224&tema=XIFPO&lang=en, . (ac- cessed: 2026-02-19)
work page 2026
-
[26]
Urbanisme i Arquitectura Direcció d’Ordenació del Territori. Dades del mapa urbanístic de Catalunya.https: //analisi.transparenciacatalunya.cat/ Urbanisme-infraestructures/Dades-del- mapa-urban-stic-de-Catalunya/epsm- zskb/data_preview. (accessed: 2026-02-19)
work page 2026
-
[27]
Statistical Institute of Catalonia. Edificis amb habitatges. Per nombre de plantes sobre rasant.https://www.idescat.cat/pub/?id= cense&n=6051&geo=mun&lang=en, . (accessed: 2026-02-19)
work page 2026
-
[28]
Álvaro Corral and Montserrat García del Muro. Finite-size scaling of human-population distribu- tions over fixed-size cells and its relation to frac- tal spatial structure. Physical Review E, 106(5): 054310, 2022
work page 2022
- [29]
-
[30]
Organización de Consumidores y Usuarios.La luz cerró 2024 con los precios más altos del año.https://www.ocu.org/vivienda-y- energia/gas-luz/informe/precio-luz. (ac- cessed: 2026-02-19)
work page 2024
-
[31]
RFDB and RFDB per inhabitant.https://www.idescat.cat/ pub/?id=rfdbc&n=13301&lang=en,
Statistical Institute of Catalonia. RFDB and RFDB per inhabitant.https://www.idescat.cat/ pub/?id=rfdbc&n=13301&lang=en, . (ac- cessed: 2026-02-19)
work page 2026
-
[32]
Institut Català d’Energia. Ajuts del programa d’incentius lligats a l’autoconsum i emma- gatzematge, amb fonts d’energia renovable i implantació de sistemes tèrmics renovables. https://icaen.gencat.cat/ca/energia/ ajuts/energies-renovables/ajuts- renovables-2022/. (accessed: 2026-02-19)
work page 2022
-
[33]
Agencia Tributaria. Deduction for works to improve the consumption of non- renewable primary energy.https: //sede.agenciatributaria.gob.es/Sede/ en_gb/vivienda-otros-inmuebles/ deducciones-obras-mejora-eficiencia- energetica-viviendas/deduccion-obras- mejora-consumo-energia-renovable.html. (accessed: 2026-02-19)
work page 2026
-
[34]
Google Trends results of “impuesto al sol” in Spain.https://trends.google.es/ trends/explore?date=all&geo=ES&q= impuesto%20al%20sol&hl=ca. (accessed: 2026-02-19)
work page 2026
-
[35]
Google Trends results of “precio luz” in Spain.https://trends.google.es/trends/ explore?date=2018-01-01%202026-01- 01&geo=ES&q=precio%20luz&hl=ca. (ac- cessed: 2026-02-19)
work page 2018
-
[36]
Licensed under CC BY 4.0 (accessed: 2026-02-17)
Institut Cartogràfic i Geològic de Catalunya.https://www.icgc.cat/en/ Geoinformation-and-Maps/Data-and- products/Cartographic-geoinformation/ Administrative-boundaries. Licensed under CC BY 4.0 (accessed: 2026-02-17)
work page 2026
-
[37]
Atlas de radiació solar a Catalunya. Edició 2000. https://icaen.gencat.cat/ca/detalls/ publicacio/Atlas-de-radiacio-solar-a- Catalunya-00003. (accessed: 2026-02-17)
work page 2000
-
[38]
Eurostat.https://ec.europa.eu/eurostat/ web/gisco/geodata/administrative- units/countries.©EuroGeographics for the administrative boundaries (accessed: 2026-02- 17)
work page 2026
-
[39]
Notice sur la loi que la population poursuit dans son accroissement
Pierre-François Verhulst. Notice sur la loi que la population poursuit dans son accroissement. 14 Correspondance Mathématique et Physique, 10: 113–121, 1838
-
[40]
Recherches mathéma- tiques sur la loi d’accroissement de la population
Pierre-François Verhulst. Recherches mathéma- tiques sur la loi d’accroissement de la population. Nouveaux Mémoires de l’Académie Royale des Sciences et Belles-Lettres de Bruxelles, 18:1–38, 1845
-
[41]
M.L. Bertotti, J. Brunner, and G. Modanese. The Bass diffusion model on networks with correla- tions and inhomogeneous advertising. Chaos, Solitons & Fractals, 90:55–63, 2016. doi: https:// doi.org/10.1016/j.chaos.2016.02.039. Challenges in Data Science
-
[42]
Integrating models of diffusion of innovations: A conceptual framework
Barbara Wejnert. Integrating models of diffusion of innovations: A conceptual framework. Annual review of sociology, 28(1):297–326, 2002
work page 2002
-
[43]
The SciPy community. scipy.optimize.curve_fit. https://docs.scipy.org/doc/ scipy/reference/generated/ scipy.optimize.curve_fit.html. (accessed: 2026-02-19)
work page 2026
-
[44]
Valida- tion and verification of agent-based models in the social sciences
Paul Ormerod and Bridget Rosewell. Valida- tion and verification of agent-based models in the social sciences. In International workshop on epistemological aspects of computer simulation in the social sciences, pages 130–140. Springer, 2006
work page 2006
-
[45]
The Bayesian information criterion: back- ground, derivation, and applications
Andrew A Neath and Joseph E Cavanaugh. The Bayesian information criterion: back- ground, derivation, and applications. Wiley Interdisciplinary Reviews: Computational Statistics, 4(2):199–203, 2012
work page 2012
-
[46]
Christophe Van den Bulte and Gary L Lilien. Bias and systematic change in the parameter esti- mates of macro-level diffusion models.Marketing Science, 16(4):338–353, 1997
work page 1997
-
[47]
Christophe Van den Bulte and Stefan Stremersch. Social contagion and income heterogeneity in new product diffusion: A meta-analytic test.Marketing Science, 23(4):530–544, 2004
work page 2004
-
[48]
H Peyton Young. Innovation diffusion in hetero- geneous populations: Contagion, social influence, and social learning. American economic review, 99(5):1899–1924, 2009
work page 1924
- [49]
-
[50]
Innova- tion Diffusion Processes: Concepts, Models, and Predictions
Mariangela Guidolin and Piero Manfredi. Innova- tion Diffusion Processes: Concepts, Models, and Predictions. Annual Review of Statistics and Its Application, 10:451–473, 3 2023. doi: 10.1146/ annurev-statistics-040220-091526
work page 2023
- [51]
-
[52]
Evolución de la generación hidráulica
Red Electrica Española. Evolución de la generación hidráulica. URLhttps: //www.sistemaelectrico-ree.es/es/ informe-de-energias-renovables/agua/ generacion-agua
-
[53]
Manuel Hidalgo-Pérez, Natalia Collado, Jorge Galindo, and Ramón Mateo. The Iberian excep- tion: Estimating the impact of a cap on gas prices for electricity generation on consumer prices and market dynamics. Energy Policy, 188:114092,
-
[54]
doi: https://doi.org/ 10.1016/j.enpol.2024.114092
ISSN 0301-4215. doi: https://doi.org/ 10.1016/j.enpol.2024.114092
-
[55]
Fundación Renovables, Otovo. Incentivos fiscales en el IBI, ICIO e IAE para instalaciones de autoconsumo fotovoltaico en municipios con más de 10.000 habitantes.https://www.otovo.es/ assets/subvenciones-placas-solares.pdf. (accessed: 2026-02-19)
work page 2026
-
[56]
Innova- tion diffusion in a dynamic potential adopter pop- ulation
Vijay Mahajan and Robert A Peterson. Innova- tion diffusion in a dynamic potential adopter pop- ulation. Management Science, 24(15):1589–1597, 1978
work page 1978
-
[57]
Our World in Data. Installed solar energy capac- ity.https://ourworldindata.org/grapher/ installed-solar-pv-capacity?tab=table. (accessed: 2025-06-30)
work page 2025
-
[58]
Gobierno de España, Ministerio de Industria, En- ergía y Turismo. Real Decreto 900/2015, de 9 de octubre, por el que se regulan las condi- ciones administrativas, técnicas y económicas de 15 las modalidades de suministro de energía eléctrica con autoconsumo y de producción con autocon- sumo.https://www.boe.es/eli/es/rd/2015/ 10/09/900/con. (accessed: 2026-02-19)
work page 2015
-
[59]
Gobierno de España, Jefatura del Estado. Real Decreto-ley 15/2018, de 5 de octubre, de medidas urgentes para la transición energética y la protec- ción de los consumidores.https://www.boe.es/ eli/es/rdl/2018/10/05/15/con. (accessed: 2026-02-19)
work page 2018
-
[60]
18 partidos políti- cos se comprometen a derogar el RD de autoconsumo si se llega a aprobar
Energias Renovables. 18 partidos políti- cos se comprometen a derogar el RD de autoconsumo si se llega a aprobar. URL https://www.energias-renovables.com/ panorama/18-partidos-politicos-se- comprometen-a-derogar-20150727
-
[61]
Casi todos contra el gobierno en el autoconsumo eléctrico
Cadena Ser. Casi todos contra el gobierno en el autoconsumo eléctrico. URLhttps: //cadenaser.com/programa/2015/07/28/ ser_consumidor/1438077978_186995.html
-
[62]
Marta Gutierrez San Blas. Qué era el “im- puesto al sol”: así impactó en el desarrollo de las renovables. URLhttps://www.newtral.es/ impuesto-al-sol/20220915/
-
[63]
Diffusion GIF.https://shorturl.at/0uq0d
-
[64]
Enrique Fuster-Palop, Carlos Prades-Gil, X Masip, Joan D Viana-Fons, and Jorge Payá. In- novative regression-based methodology to assess the techno-economic performance of photovoltaic installations in urban areas. Renewable and Sustainable Energy Reviews, 149:111357, 2021
work page 2021
-
[65]
R. Saez, D. Boer, A.B. Shobo, and M. Val- lès. Techno-economic analysis of residential rooftop photovoltaics in Spain. Renewable and Sustainable Energy Reviews, 188:113788, 2023. doi: https://doi.org/10.1016/j.rser.2023.113788
-
[66]
Alianza por el Autoconsumo. Autoconsumo en España: diagnóstico, retos y propues- tas.https://alianzaautoconsumo.org/ wp-content/uploads/2020/10/informe- autoconsumo_PAGf.pdf. (accessed: 2026-02- 19)
work page 2020
-
[67]
Elena Lucchi. Integration between photovoltaic systems and cultural heritage: A socio-technical comparison of international policies, design cri- teria, applications, and innovation developments. Energy Policy, 171:113303, 2022. doi: https: //doi.org/10.1016/j.enpol.2022.113303
-
[68]
Progrés en la implantació les energies renovables a Catalunya
Observatori de les energies renovables de Catalunya. Progrés en la implantació les energies renovables a Catalunya. https://observatorirenovables.cat/ wp-content/uploads/2024/07/Informe- OberCat-2023.pdf. (accessed: 2026-02-19)
work page 2024
-
[69]
Ac- curacy of mean-field theory for dynamics on real- world networks
James P Gleeson, Sergey Melnik, Jonathan A Ward, Mason A Porter, and Peter J Mucha. Ac- curacy of mean-field theory for dynamics on real- world networks. Physical Review E—Statistical, Nonlinear, and Soft Matter Physics, 85(2):026106, 2012
work page 2012
-
[70]
Diffusion in random networks: Impact of degree distribution
Vahideh Manshadi, Sidhant Misra, and Scott Rodilitz. Diffusion in random networks: Impact of degree distribution. Oper. Res., 68(6):1722–1741, November 2020. doi: 10.1287/opre.2019.1945
-
[71]
A Generalized Bass Model for Product Growth in Networks
Vahideh H Manshadi and Sidhant Misra. A gener- alized bass model for product growth in networks. arXiv preprint arXiv:1606.03386, 2016
work page internal anchor Pith review Pith/arXiv arXiv 2016
-
[72]
Collective dynamics of ‘small-world’ networks.Nature, 393 (6684):440–442, 1998
Duncan J Watts and Steven H Strogatz. Collective dynamics of ‘small-world’ networks.Nature, 393 (6684):440–442, 1998
work page 1998
-
[73]
The strength of weak ties: A network theory revisited
Mark Granovetter. The strength of weak ties: A network theory revisited. Sociological Theory, 1: 201–233, 1983
work page 1983
-
[74]
A nonsymmetric responding logistic model for forecasting technological substitution
Christopher Easingwood, Vijay Mahajan, and Ei- tan Muller. A nonsymmetric responding logistic model for forecasting technological substitution. Technological forecasting and Social change, 20 (3):199–213, 1981
work page 1981
- [75]
-
[76]
Ajuntament de Barcelona. Oficina Munici- pal de Dades (OMD). Renda disponible de les llars per càpita (RDLpc,e).https: //portaldades.ajuntament.barcelona.cat/ ca/estad%C3%ADstiques/nzjnewo7n6. (ac- cessed: 2025-06-30). 16 Appendix A. Distribution of pairs of installations separated by a time interval in the lo- gistic model Appendix A.1. Temporal correlat...
work page 2025
discussion (0)
Sign in with ORCID, Apple, or X to comment. Anyone can read and Pith papers without signing in.