MIA: A Visual Analytics System for Multimodal Spectral Imaging Data
Pith reviewed 2026-06-28 17:53 UTC · model grok-4.3
The pith
MIA combines spectral preprocessing, dimensionality reduction, segmentation and multimodal comparison inside one linked interface.
A machine-rendered reading of the paper's core claim, the machinery that carries it, and where it could break.
Core claim
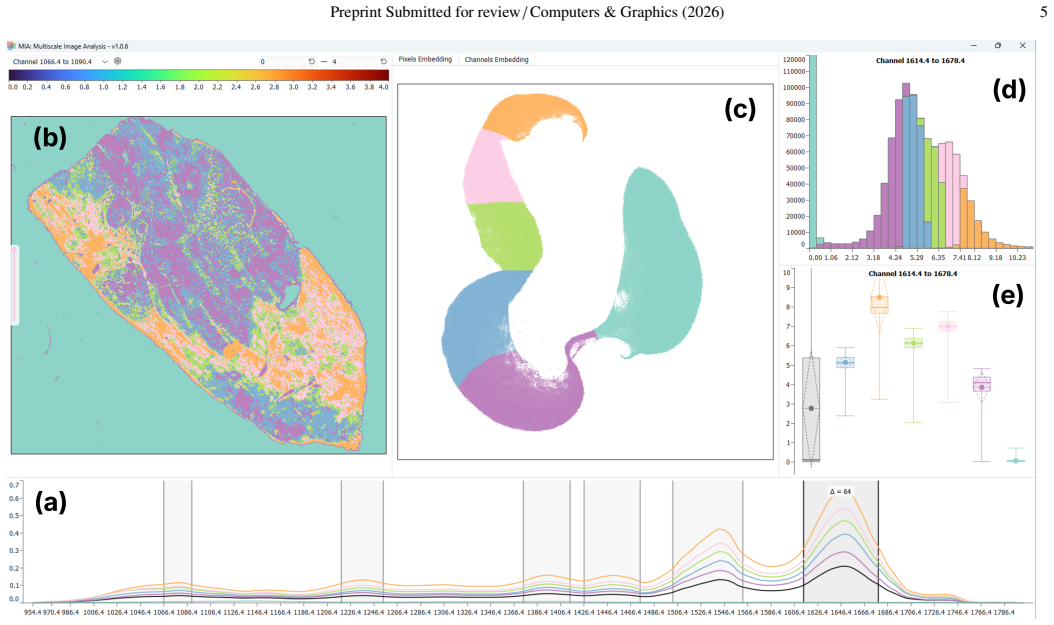
MIA is a modality-agnostic system that places spectral preprocessing, hierarchical and landmark-based embeddings, interactive and automatic segmentation with shared state, and spectral similarity search inside one tightly coupled interface, thereby supporting multimodal analysis of co-registered datasets from different instruments without external reconciliation steps.
What carries the argument
The tightly coupled interface with shared segmentation state across all linked views and hierarchical embeddings for datasets of varying scale.
If this is right
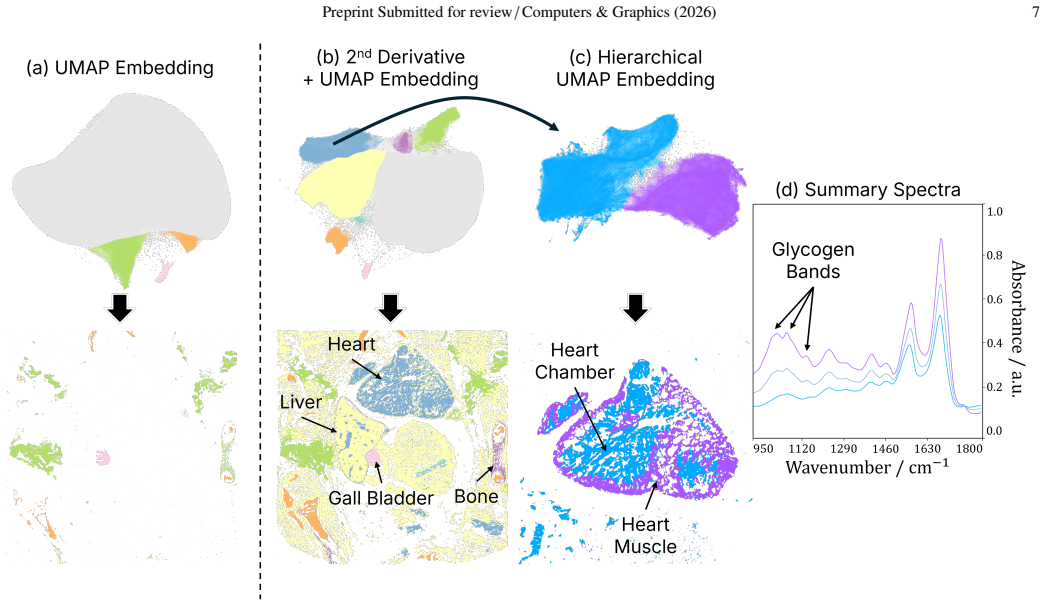
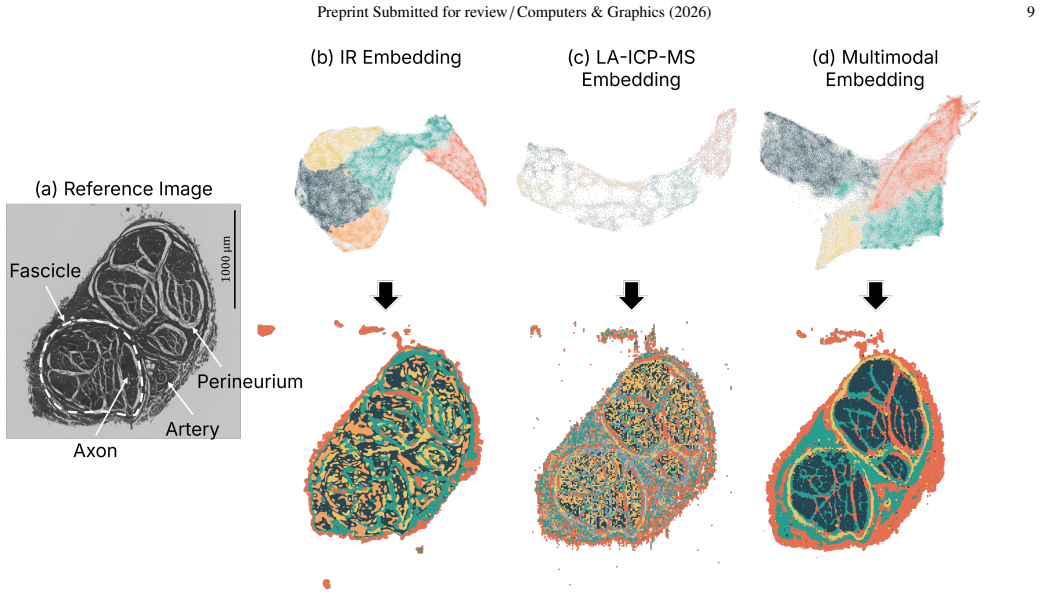
- Tissue compartments become recoverable from derivative-preprocessed spectra through hierarchical embedding without leaving the system.
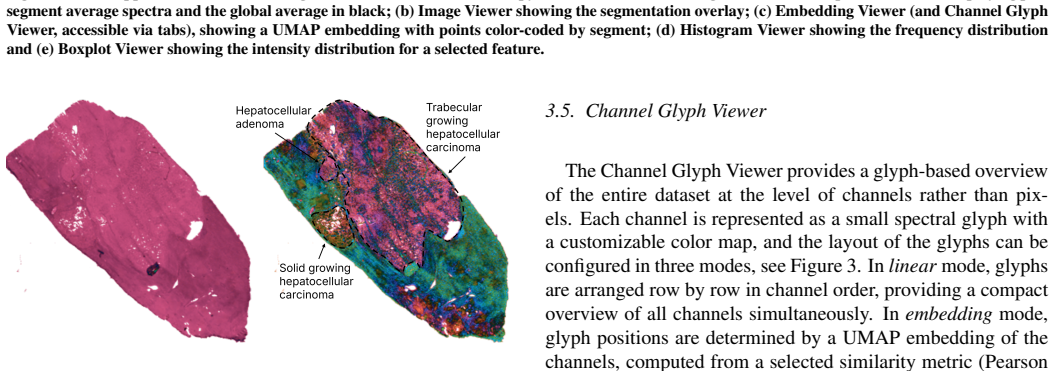
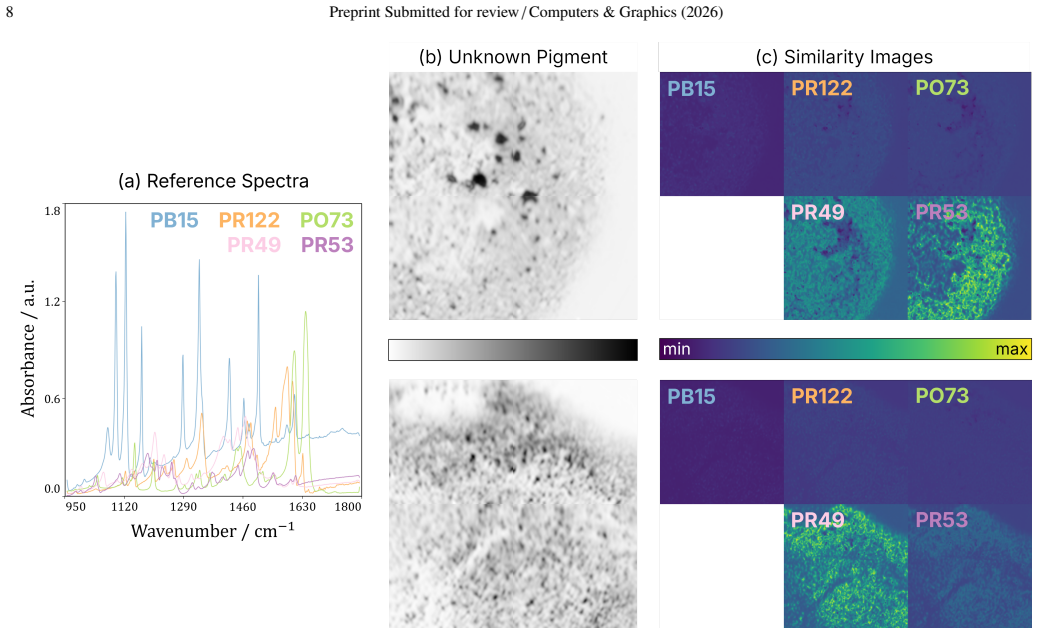
- Pigments can be identified by spectral similarity search while the spatial context remains visible in the same window.
- Molecular IR maps and elemental LA-ICP-MS maps can be examined together after co-registration inside the same session.
- Segmentation decisions made in one view propagate automatically to every other view, eliminating manual reconciliation.
Where Pith is reading between the lines
- The same linked-view pattern could be tested on other co-registered high-dimensional imaging modalities such as Raman or fluorescence lifetime data.
- If the shared-state mechanism scales, it might reduce the need for custom scripting that currently bridges separate analysis packages.
- Quantitative logging of view switches before and after adoption could measure the claimed reduction in tool changes.
Load-bearing premise
Feedback from a small group of domain experts is treated as sufficient proof that the integrated interface produces insights that existing separate tools cannot deliver.
What would settle it
A side-by-side trial in which the same experts run the three reported use cases once in MIA and once with their current collection of tools, then report no difference in identified structures or required extra steps.
Figures
read the original abstract
Hyperspectral bioimaging techniques such as infrared (IR) microscopy and laser ablation-inductively coupled plasma-mass spectrometry (LA-ICP-MS) produce high-dimensional, spatially resolved datasets that require sophisticated analysis to reveal chemically and anatomically meaningful structures. Existing software solutions are typically modality-specific and cover only parts of the analytical workflow, forcing researchers to transfer data across multiple tools and manually reconcile results. We present MIA (Multiscale Image Analysis), a modality-agnostic visual analysis environment that integrates the full exploratory workflow -- from spectral preprocessing and dimensionality reduction to interactive segmentation and spectral similarity analysis -- within a single, tightly coupled interface. MIA supports hierarchical and landmark-based embeddings to handle datasets of varying scale and complexity, interactive and automatic segmentation with a shared state across all linked views, and multimodal analysis of co-registered datasets from different instruments. We demonstrate the effectiveness of MIA through three use cases drawn from real analytical chemistry workflows: (1) the recovery of biologically meaningful tissue compartments through derivative preprocessing and hierarchical embedding, (2) pigment identification via spectral similarity search with spatial overview, and (3) multimodal tissue characterization combining molecular IR and elemental LA-ICP-MS data. Qualitative feedback from domain expert collaborators confirms that MIA reduces the need for tool-switching and supports analytical insights that are difficult to obtain with existing software.
Editorial analysis
A structured set of objections, weighed in public.
Referee Report
Summary. The paper presents MIA (Multiscale Image Analysis), a modality-agnostic visual analysis environment for hyperspectral bioimaging data from IR microscopy and LA-ICP-MS. It integrates the full exploratory workflow including spectral preprocessing, dimensionality reduction via hierarchical and landmark-based embeddings, interactive and automatic segmentation with shared state, and spectral similarity analysis in a single tightly coupled interface. The system supports multimodal analysis of co-registered datasets. Effectiveness is demonstrated through three use cases: recovery of tissue compartments, pigment identification, and multimodal tissue characterization, along with qualitative feedback from domain expert collaborators confirming reduced tool-switching and unique insights.
Significance. If the claims hold, MIA would address a practical fragmentation in existing tools by providing an integrated, modality-agnostic platform for spectral imaging workflows. This could enable more efficient multimodal analysis in analytical chemistry and related domains, with the hierarchical embeddings and linked views offering potential for handling complex, large-scale datasets.
major comments (1)
- [Abstract and Use Cases section] Abstract and Use Cases section: The claim that MIA 'supports analytical insights that are difficult to obtain with existing software' and 'reduces the need for tool-switching' rests on three use cases and qualitative feedback from domain expert collaborators. The manuscript provides no count of experts, no description of the feedback protocol or metrics, no baseline tool comparisons, and no error analysis or quantitative measures of insight generation. This evidence is load-bearing for the central effectiveness argument.
minor comments (1)
- [Abstract] The abstract would benefit from explicitly noting the number of use cases and experts to give readers immediate context on the scale of the evaluation.
Simulated Author's Rebuttal
We thank the referee for the careful review and the opportunity to clarify the evaluation of MIA. We respond to the single major comment below.
read point-by-point responses
-
Referee: [Abstract and Use Cases section] Abstract and Use Cases section: The claim that MIA 'supports analytical insights that are difficult to obtain with existing software' and 'reduces the need for tool-switching' rests on three use cases and qualitative feedback from domain expert collaborators. The manuscript provides no count of experts, no description of the feedback protocol or metrics, no baseline tool comparisons, and no error analysis or quantitative measures of insight generation. This evidence is load-bearing for the central effectiveness argument.
Authors: We agree that the current description of the evaluation is brief and would benefit from expansion. In the revised manuscript we will add an explicit subsection on evaluation that states the number of domain experts (three collaborators), describes the feedback protocol (iterative sessions in which experts applied MIA to their own datasets and reported on workflow integration and novel observations), and notes the absence of a controlled baseline comparison or quantitative insight metrics. The three use cases remain the primary evidence; each documents a concrete analytical step (e.g., compartment recovery via hierarchical embedding, pigment search, multimodal co-registration) that the integrated interface makes possible without data export. We maintain that a formal quantitative user study lies outside the scope of a systems paper whose contribution is the tightly coupled workflow itself, but we will add a limitations paragraph acknowledging the qualitative nature of the reported evidence. revision: partial
Circularity Check
No significant circularity: system description paper with no derivations or fitted predictions
full rationale
The paper is a description of a visual analytics system (MIA) for spectral imaging data. It outlines system features (preprocessing, embeddings, segmentation, multimodal support), presents three use cases from real workflows, and reports qualitative expert feedback on reduced tool-switching and unique insights. No mathematical derivations, equations, predictions, fitted parameters, or self-citation chains appear in the load-bearing claims. The effectiveness argument rests on qualitative evidence rather than any reduction of outputs to inputs by construction. This is a standard, non-circular system paper; the absence of a derivation chain means no circularity patterns (self-definitional, fitted-input-as-prediction, etc.) can be exhibited.
Axiom & Free-Parameter Ledger
Reference graph
Works this paper leans on
-
[1]
Laser ablation–inductively coupled plasma–mass spectrometry imaging in biol- ogy
Doble, PA, de Vega, RG, Bishop, DP, Hare, DJ, Clases, D. Laser ablation–inductively coupled plasma–mass spectrometry imaging in biol- ogy. Chemical reviews 2021;121(19):11769–11822
2021
-
[2]
A multimodal view at cancerous liver tissue by chemical bioimaging and image segmentation strategies
Kronenberg, K, Werner, J, Seeba, M, Rave, H, Linsen, L, Steiger, K, et al. A multimodal view at cancerous liver tissue by chemical bioimaging and image segmentation strategies. ChemRxiv 2023;2023(0925). doi:
2023
-
[3]
Quantum cascade laser-based hyperspectral imaging of biological tissue
Kr ¨oger, N, Egl, A, Engel, M, Gretz, N, Haase, K, Herpich, I, et al. Quantum cascade laser-based hyperspectral imaging of biological tissue. Journal of biomedical optics 2014;19(11):111607–111607
2014
-
[4]
Quantum cascade lasers (QCLs) in biomedical spectroscopy
Schwaighofer, A, Brandstetter, M, Lendl, B. Quantum cascade lasers (QCLs) in biomedical spectroscopy. Chemical Society Reviews 2017;46(19):5903–5924
2017
-
[5]
Quantification of immunohistochemistry—issues concern- ing methods, utility and semiquantitative assessment i
Walker, RA. Quantification of immunohistochemistry—issues concern- ing methods, utility and semiquantitative assessment i. Histopathology 2006;49(4):406–410. doi:
2006
-
[6]
Infrared Orange: Connecting hyperspectral data with machine learning
Toplak, M, Birarda, G, Read, S, Sandt, C, Rosendahl, SM, Vaccari, L, et al. Infrared Orange: Connecting hyperspectral data with machine learning. Synchrotron Radiation News 2017;30(4):40–45. doi:
2017
-
[7]
Quasar: Easy machine learning for biospectroscopy
Toplak, M, Read, ST, Sandt, C, Borondics, F. Quasar: Easy machine learning for biospectroscopy. Cells 2021;10(9). doi:
2021
-
[8]
Cardinal: An R package for statistical anal- ysis of mass spectrometry-based imaging experiments
Bemis, KD, Harry, A, Eberlin, LS, Ferreira, C, van de Ven, SM, Mallick, P, et al. Cardinal: An R package for statistical anal- ysis of mass spectrometry-based imaging experiments. Bioinformatics 2015;31(14):2418–2420. doi:
2015
-
[9]
Cardinal v.3: A versatile open-source software for mass spectrometry imaging analysis
Bemis, KA, F ¨oll, MC, Guo, D, Lakkimsetty, SS, Vitek, O. Cardinal v.3: A versatile open-source software for mass spectrometry imaging analysis. Nature Methods 2023;20(12):1883–1886. doi:
2023
-
[10]
UMAP: Uniform mani- fold approximation and projection
McInnes, L, Healy, J, Saul, N, Grossberger, L. UMAP: Uniform mani- fold approximation and projection. The Journal of Open Source Software 2018;3(29):861
2018
-
[11]
Orange: Data mining toolbox in python
Dem ˇsar, J, Curk, T, Erjavec, A, Gorup, ˇC, Hoˇcevar, T, Milutinovi ˇc, M, et al. Orange: Data mining toolbox in python. the Journal of machine Learning research 2013;14(1):2349–2353
2013
-
[12]
Principal Component Analysis
Jolliffe, I. Principal Component Analysis. John Wiley & Sons, Ltd. ISBN 9780470013199; 2005,doi:
2005
-
[13]
CytoSpec: Software for hyperspectral imaging
Lasch, P. CytoSpec: Software for hyperspectral imaging. 2026. URL: https://www.cytospec.com/; Berlin, Germany. Accessed: March 26, 2026
2026
-
[14]
OPUS spectroscopy software
Bruker Optics GmbH, . OPUS spectroscopy software. 2026. URL: https://www.bruker.com/; Ettlingen, Germany. Accessed: March 26, 2026
2026
-
[15]
Pess ˆoa, G, Arruda, MAZ, Capelo-Mart ´ınez, JL, Fdez-Riverola, F, Glez-Pe ˜na, D, et al
L ´opez-Fern´andez, H, de S. Pess ˆoa, G, Arruda, MAZ, Capelo-Mart ´ınez, JL, Fdez-Riverola, F, Glez-Pe ˜na, D, et al. LA-iMageS: A software for elemental distribution bioimaging using LA–ICP-MS data. Journal of Cheminformatics 2016;8(1):65. doi:
2016
-
[16]
Iolite: Freeware for the visualisation and processing of mass spectrometric data
Paton, C, Hellstrom, J, Paul, B, Woodhead, J, Hergt, J. Iolite: Freeware for the visualisation and processing of mass spectrometric data. J Anal At Spectrom 2011;26:2508–2518. doi:
2011
-
[17]
HDIP (hdf-based image processing) soft- ware
Teledyne Photon Machines, . HDIP (hdf-based image processing) soft- ware. 2026. URL:https://www.teledynephotonmachines.com/ support/hdip; Belgrade, USA. Accessed: March 26, 2026
2026
-
[18]
Pew2: Open-source imaging software for laser ablation–inductively coupled plasma–mass spectrometry
Lockwood, TE, Westerhausen, MT, Doble, PA. Pew2: Open-source imaging software for laser ablation–inductively coupled plasma–mass spectrometry. Analytical Chemistry 2021;93(30):10418–10423. doi:; pMID: 34283564
2021
-
[19]
MeXpose–a modular imaging pipeline for the quantitative assess- ment of cellular metal bioaccumulation
Braun, G, Schaier, M, Werner, P, Theiner, S, Zanghellini, J, Wisgrill, L, et al. MeXpose–a modular imaging pipeline for the quantitative assess- ment of cellular metal bioaccumulation. JACS Au 2024;4(6):2197–2210. doi:
2024
-
[20]
TOFHunter–unlocking rapid untargeted screening of inductively cou- pled plasma–time-of-flight–mass spectrometry data
Andrews, HB, Hendriks, L, Irvine, SB, Dunlap, DR, Manard, BT. TOFHunter–unlocking rapid untargeted screening of inductively cou- pled plasma–time-of-flight–mass spectrometry data. J Anal At Spectrom 2025;40:910–920. doi:
2025
-
[21]
Exploring high-dimensional LA- ICP-TOFMS data with uniform manifold approximation and projection (umap)
Kronenberg, K, Rave, H, Ghaffari-Tabrizi-Wizsy, N, Nyckees, D, Elinkmann, M, Freitak, D, et al. Exploring high-dimensional LA- ICP-TOFMS data with uniform manifold approximation and projection (umap). J Anal At Spectrom 2025;40:3473–3484. doi:
2025
-
[22]
Mineral phase-resolved quantification in la-icp-ms imaging
Umfahrer, B, Buday, J, Po ˇr´ızka, P, Kaiser, J, Garofalo, PS, G¨unther, D. Mineral phase-resolved quantification in la-icp-ms imaging. Analytical Chemistry 2026;98(1):581–589. doi:; pMID: 41406395
2026
-
[23]
M2aia—interactive, fast, and memory-efficient analysis of 2d and 3d multi-modal mass spectrometry imaging data
Cordes, J, Enzlein, T, Marsching, C, Hinze, M, Engelhardt, S, Hopf, C, et al. M2aia—interactive, fast, and memory-efficient analysis of 2d and 3d multi-modal mass spectrometry imaging data. GigaScience 2021;10(7):giab049. doi:
2021
-
[24]
Visualizing data using t-SNE
van der Maaten, L, Hinton, GE. Visualizing data using t-SNE. Journal of Machine Learning Research 2008;9(86):2579–2605. URL:http:// jmlr.org/papers/v9/vandermaaten08a.html
2008
-
[25]
A critical analysis of the usage of dimensionality reduction in four do- mains
Cashman, D, Keller, M, Jeon, H, Kwon, BC, Wang, Q. A critical analysis of the usage of dimensionality reduction in four do- mains. IEEE Transactions on Visualization and Computer Graphics 2025;31(10):9405–9423. doi:
2025
-
[26]
Hi- erarchical stochastic neighbor embedding
Pezzotti, N, H ¨ollt, T, Lelieveldt, B, Eisemann, E, Vilanova, A. Hi- erarchical stochastic neighbor embedding. Computer Graphics Forum 2016;35(3):21–30. doi:
2016
-
[27]
Visual analysis of mass cytometry data by hierarchical stochastic neighbour embedding reveals rare cell types
van Unen, V , H ¨ollt, T, Pezzotti, N, Li, N, Reinders, M, Eisemann, E, et al. Visual analysis of mass cytometry data by hierarchical stochastic neighbour embedding reveals rare cell types. Nature Communications 2017;8(1). doi:
2017
-
[28]
From Louvain to Leiden: Guaran- teeing well-connected communities
Traag, V A, Waltman, L, van Eck, NJ. From Louvain to Leiden: Guaran- teeing well-connected communities. Scientific Reports 2019;9(1):5233. doi:
2019
-
[29]
PAGA: graph abstraction reconciles clustering with trajectory inference through a topology preserving map of single cells
Wolf, FA, Hamey, FK, Plass, M, Solana, J, Dahlin, JS, G ¨ottgens, B, et al. PAGA: graph abstraction reconciles clustering with trajectory inference through a topology preserving map of single cells. Genome Biology 2019;20(1):59. doi:
2019
-
[30]
hdbscan: Hierarchical density based clustering
McInnes, L, Healy, J, Astels, S, et al. hdbscan: Hierarchical density based clustering. J Open Source Softw 2017;2(11):205
2017
-
[31]
A novel framework for inter- active visualization and analysis of hyperspectral image data
Jordan, J, Angelopoulou, E, Maier, A. A novel framework for inter- active visualization and analysis of hyperspectral image data. Journal of Electrical and Computer Engineering 2016;2016(1):2635124. doi:
2016
-
[32]
Interactive visual analysis of mass spectrometry imaging data using linear and non-linear embeddings
Jawad, M, Soltwisch, J, Dreisewerd, K, Linsen, L. Interactive visual analysis of mass spectrometry imaging data using linear and non-linear embeddings. Information 2020;11(12). doi:
2020
-
[33]
Interactive visualization of hyperspectral images based on neural networks
Zhu, F, Pan, Y , Gao, T, Walia, H, Yu, H. Interactive visualization of hyperspectral images based on neural networks. IEEE Computer Graphics and Applications 2021;41(5):57–66. doi:
2021
-
[34]
Feature selection-oriented interactive visual anal- 12 Preprint Submitted for review/Computers & Graphics (2026) ysis approach for hyperspectral images
Yu, H, Li, S. Feature selection-oriented interactive visual anal- 12 Preprint Submitted for review/Computers & Graphics (2026) ysis approach for hyperspectral images. Information Visualization 2025;24(3):284–297. doi:
2026
-
[35]
Cell2Cell: Explorative cell interaction analysis in multi-volumetric tissue data
M ¨orth, E, Sidak, K, Maliga, Z, M ¨oller, T, Gehlenborg, N, Sorger, P, et al. Cell2Cell: Explorative cell interaction analysis in multi-volumetric tissue data. IEEE Transactions on Visualization and Computer Graphics 2025;31(1):569–579. doi:
2025
-
[36]
De-cluttering scatterplots with inte- gral images
Rave, H, Molchanov, V , Linsen, L. De-cluttering scatterplots with inte- gral images. IEEE Transactions on Visualization and Computer Graphics 2025;31(4):2114–2126. doi:
2025
-
[37]
On minimum-cost assignments in unbalanced bipartite graphs
Ramshaw, L, Tarjan, RE. On minimum-cost assignments in unbalanced bipartite graphs. HP Labs, Palo Alto, CA, USA, Tech Rep HPL-2012- 40R1 2012;20:14
2012
-
[38]
Rapid versus slow degeneration and complications of biomate- rials in patients with congenital heart disease
Peivandi, AD, Holtkamp, M, Rave, H, Linsen, L, Martens, S, M ¨uller, KM, et al. Rapid versus slow degeneration and complications of biomate- rials in patients with congenital heart disease. Cardiovascular Pathology 2025;75:107712. doi:
2025
-
[39]
SUS—a quick and dirty usability scale
Brooke, J, et al. SUS—a quick and dirty usability scale. Usability Eval- uation in Industry 1996;189(194):4–7
1996
-
[40]
Determining what individual SUS scores mean: Adding an adjective rating scale
Bangor, A, Kortum, P, Miller, J. Determining what individual SUS scores mean: Adding an adjective rating scale. Journal of Usability Stud- ies 2009;4(3):114–123
2009
-
[41]
Design study methodology: Re- flections from the trenches and the stacks
Sedlmair, M, Meyer, M, Munzner, T. Design study methodology: Re- flections from the trenches and the stacks. IEEE Transactions on Visual- ization and Computer Graphics 2012;18(12):2431–2440. doi:
2012
discussion (0)
Sign in with ORCID, Apple, or X to comment. Anyone can read and Pith papers without signing in.