Post Selection Estimation of Sharpe Ratios
Pith reviewed 2026-06-28 11:51 UTC · model grok-4.3
The pith
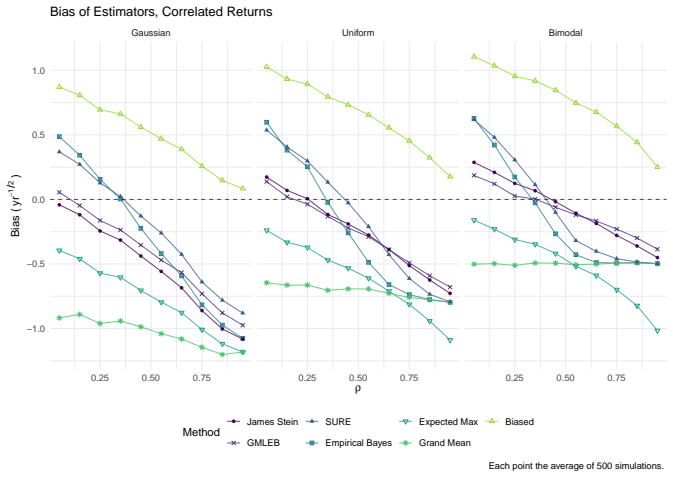
James-Stein shrinkage gives the lowest bias and root mean square error when estimating the true Sharpe ratio of the asset with the highest observed sample ratio.
A machine-rendered reading of the paper's core claim, the machinery that carries it, and where it could break.
Core claim
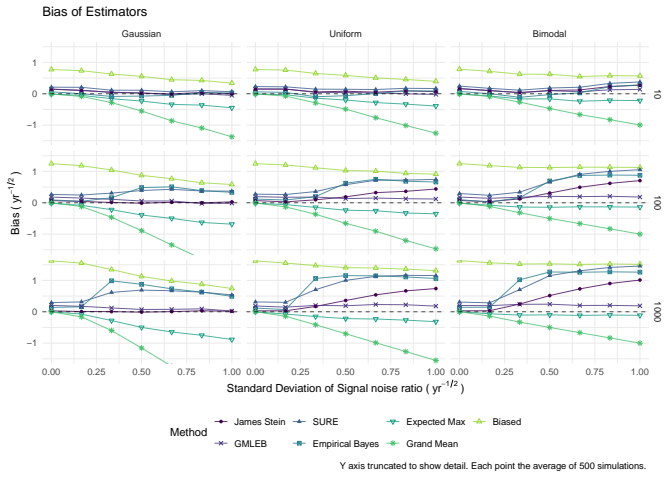
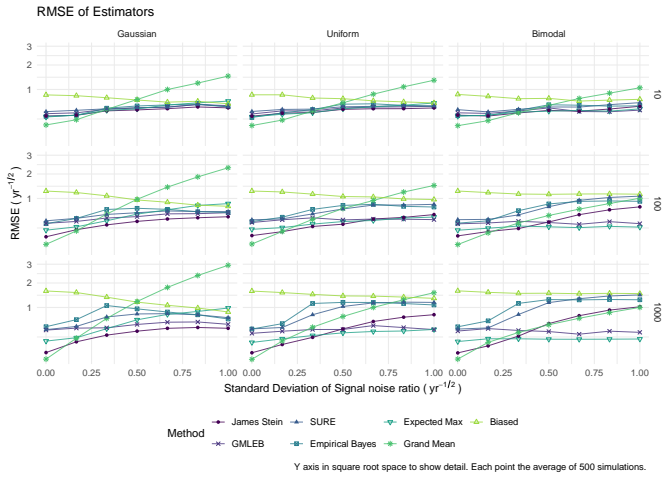
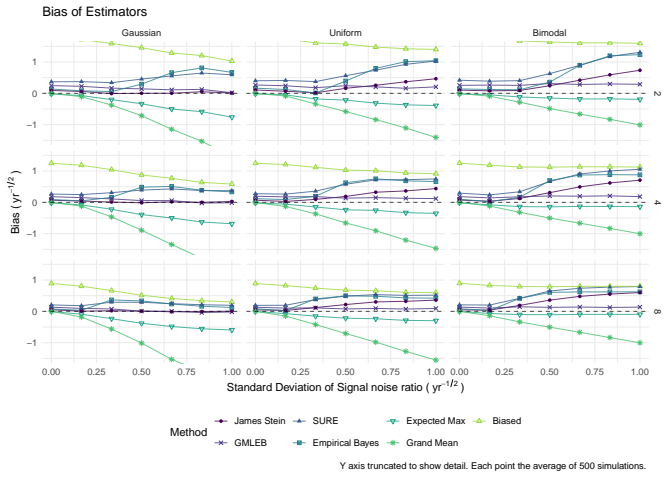
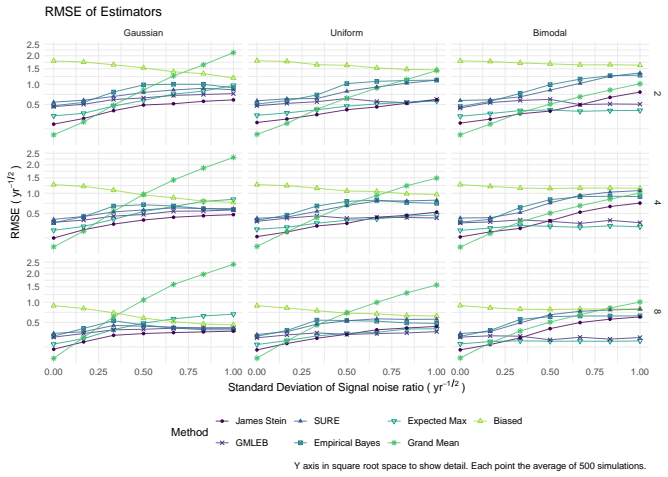
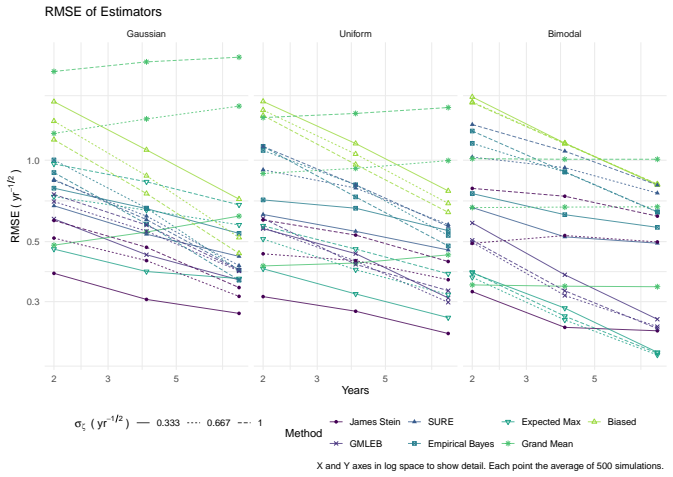
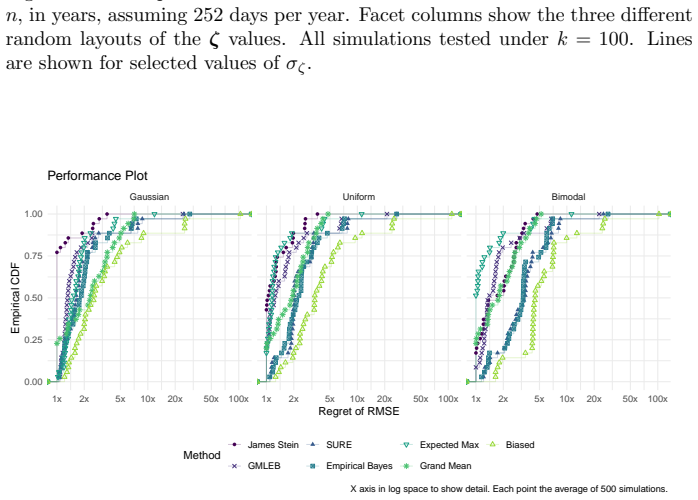
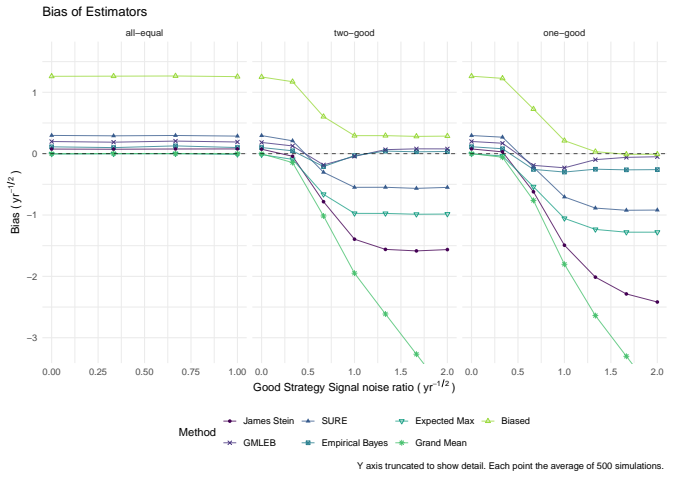
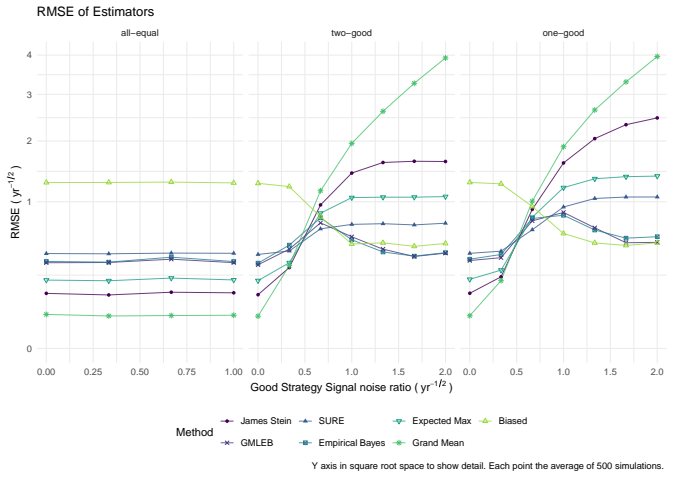
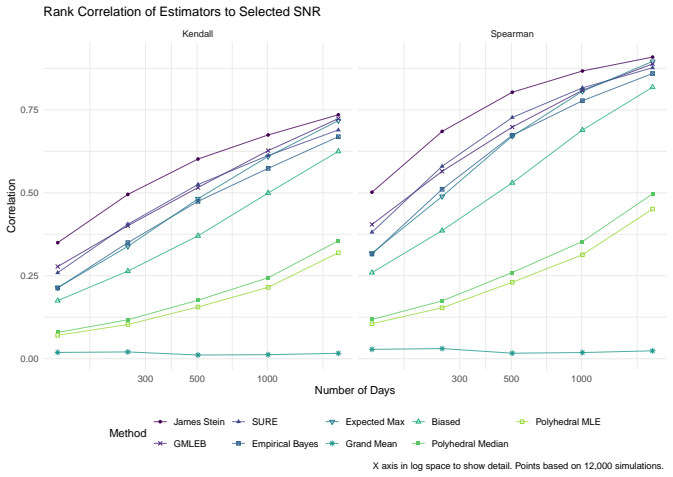
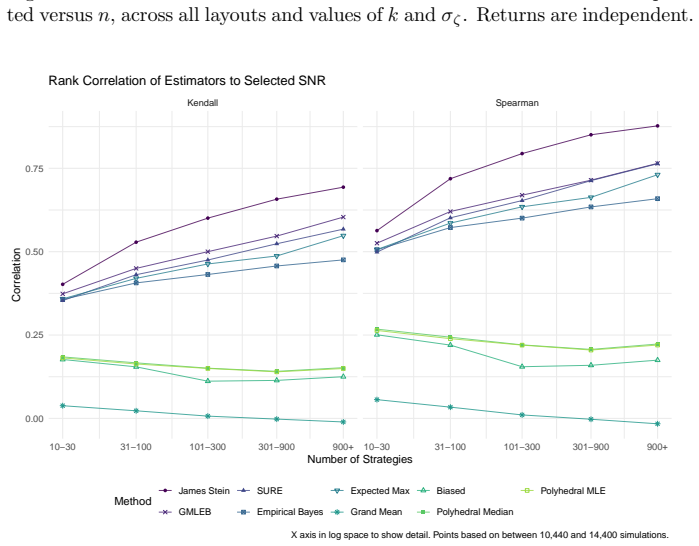
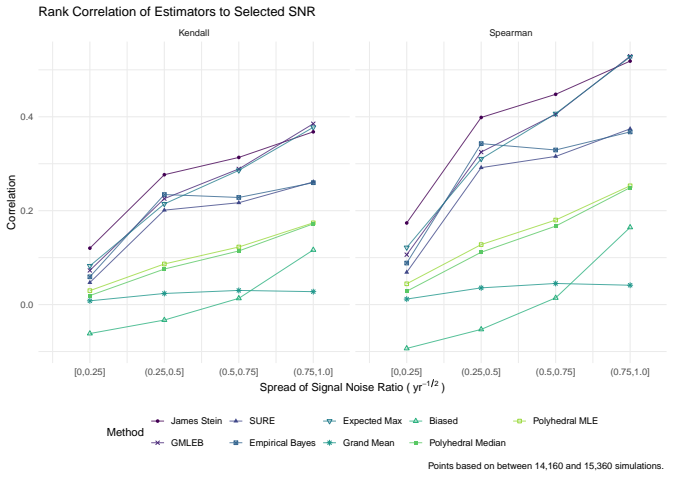
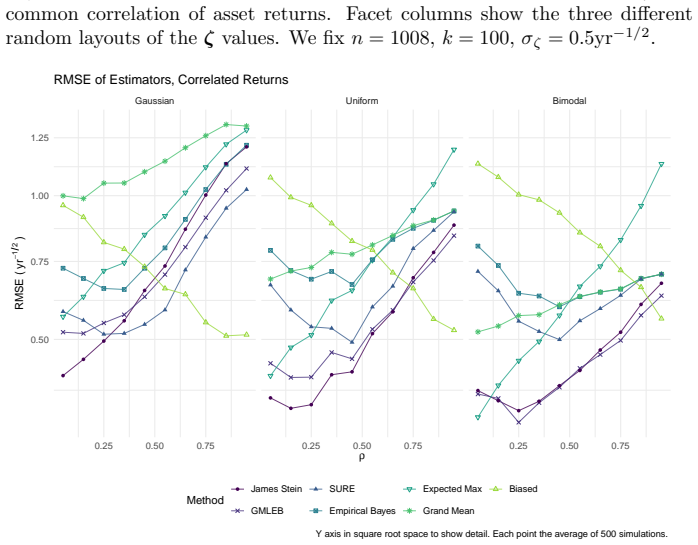
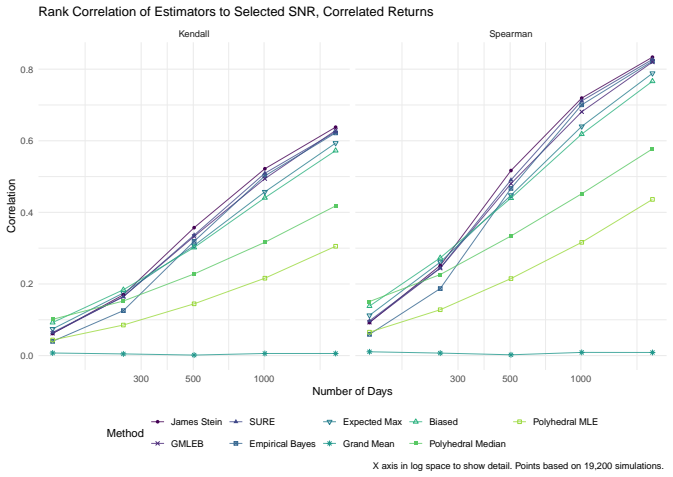
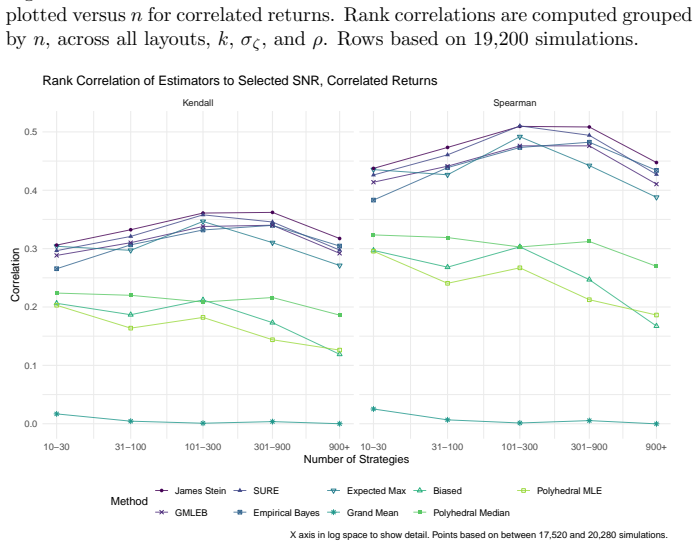
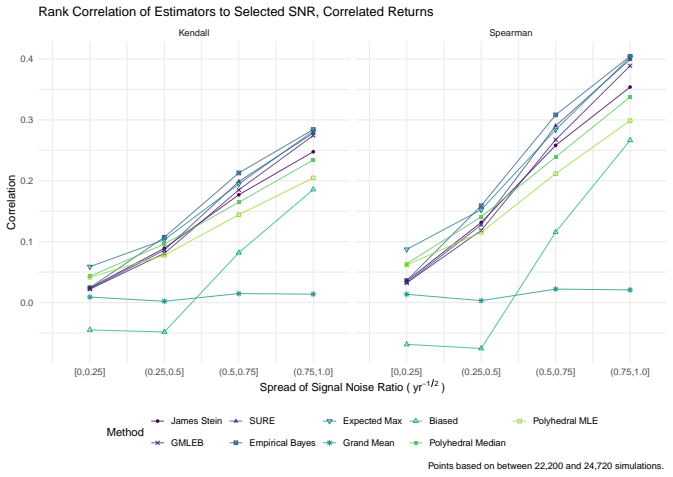
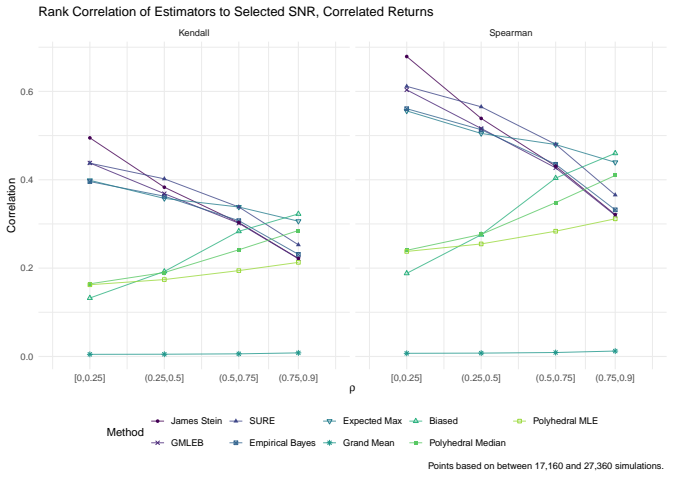
We consider the problem of estimating the true Sharpe ratio of an asset selected for having the highest observed in-sample Sharpe ratio among many assets. We discuss estimators based on the polyhedral lemma, James Stein shrinkage, debiasing the expected maximum Sharpe ratio, thresholding and empirical Bayes. We test these estimators in simulations, computing bias and root mean square error across different values of sample size, number of assets, and spread and shape of population Sharpe ratios. We also compute rank correlation of the estimators against the underlying quantity, simulating how these estimators might be used to compare or rank the output of different teams which perform this s
What carries the argument
James-Stein shrinkage estimator applied after selection of the maximum observed Sharpe ratio
Load-bearing premise
The simulation designs, including the ranges of sample sizes, number of assets, and distributions of true Sharpe ratios, match the conditions under which these estimators would be used in practice.
What would settle it
A new simulation or real dataset in which the polyhedral-lemma estimator or a simple debiasing method records lower root mean square error than James-Stein across the same grid of sample sizes and asset counts would overturn the reported ranking.
Figures
read the original abstract
We consider the problem of estimating the true Sharpe ratio of an asset selected for having the highest observed in-sample Sharpe ratio among many assets. We discuss estimators based on the polyhedral lemma, James Stein shrinkage, debiasing the expected maximum Sharpe ratio, thresholding and empirical Bayes. We test these estimators in simulations, computing bias and root mean square error across different values of sample size, number of assets, and spread and shape of population Sharpe ratios. We also compute rank correlation of the estimators against the underlying quantity, simulating how these estimators might be used to compare or rank the output of different teams which perform this selection process. We find that the James Stein estimator provides the best performance across many different realistic values of the relevant parameters, followed by the GMLEB estimator of Jiang and Zhang. These results are fairly robust to correlation of asset returns, with some caveats.
Editorial analysis
A structured set of objections, weighed in public.
Referee Report
Summary. The manuscript addresses post-selection estimation of the true Sharpe ratio for the asset with the highest observed in-sample Sharpe ratio. It considers estimators based on the polyhedral lemma, James-Stein shrinkage, debiasing the expected maximum Sharpe ratio, thresholding, and empirical Bayes (including GMLEB). These are evaluated via Monte Carlo simulations for bias, RMSE, and rank correlation across variations in sample size n, number of assets p, spread and shape of population Sharpe ratios, and asset return correlations. The central finding is that the James-Stein estimator performs best across many parameter values, followed by the GMLEB estimator of Jiang and Zhang, with results described as fairly robust to correlations.
Significance. If the simulation-based ranking holds under realistic conditions, the work would supply practical tools for correcting selection-induced upward bias in reported Sharpe ratios, a frequent issue when ranking assets or teams in quantitative portfolio management. The inclusion of rank-correlation metrics for comparing selection processes across teams is a useful extension beyond point estimation.
major comments (2)
- [Simulation study] Simulation study (abstract and methods): The generative model is restricted to i.i.d. Gaussian returns or simple constant-correlation structures with stylized draws (uniform or normal) for population Sharpes. Real equity returns exhibit fat tails, volatility clustering, and factor-driven dependence; these features can shift the bias-variance trade-off of shrinkage estimators and potentially reverse the reported ranking of James-Stein versus GMLEB or polyhedral methods. No sensitivity checks under t-distributed or GARCH-type returns are described.
- [Simulation study] Simulation study (abstract): No details are supplied on the exact return-distribution assumptions, simulation protocol (e.g., number of Monte Carlo replications, exact correlation matrices tested), or verification that the implemented estimators match their theoretical derivations. This makes the performance claims (James-Stein best, GMLEB second) difficult to reproduce or assess for robustness.
minor comments (2)
- The abstract refers to the 'polyhedral lemma' without a specific citation or brief explanation of how it is applied to Sharpe-ratio post-selection.
- Notation for the population versus sample Sharpe ratios and for the selection indicator should be introduced explicitly before the simulation results are presented.
Simulated Author's Rebuttal
We thank the referee for the thoughtful and constructive report. We address each major comment below and indicate the changes we will make to the manuscript.
read point-by-point responses
-
Referee: [Simulation study] Simulation study (abstract and methods): The generative model is restricted to i.i.d. Gaussian returns or simple constant-correlation structures with stylized draws (uniform or normal) for population Sharpes. Real equity returns exhibit fat tails, volatility clustering, and factor-driven dependence; these features can shift the bias-variance trade-off of shrinkage estimators and potentially reverse the reported ranking of James-Stein versus GMLEB or polyhedral methods. No sensitivity checks under t-distributed or GARCH-type returns are described.
Authors: We agree that the simulation design is limited to i.i.d. Gaussian returns (or constant-correlation Gaussian) and stylized population Sharpe draws. This is a standard modeling choice that permits direct comparison with the theoretical derivations of the estimators, but it does not capture fat tails, volatility clustering, or factor structure. Consequently, we cannot rule out that the relative performance of James-Stein versus GMLEB or the polyhedral estimator could change under more realistic return processes. In the revision we will add an explicit limitations paragraph in the discussion section that states this caveat and identifies non-Gaussian robustness checks as an important direction for future work. We will not, however, expand the Monte Carlo study to include t-distributed or GARCH returns in the present revision. revision: partial
-
Referee: [Simulation study] Simulation study (abstract): No details are supplied on the exact return-distribution assumptions, simulation protocol (e.g., number of Monte Carlo replications, exact correlation matrices tested), or verification that the implemented estimators match their theoretical derivations. This makes the performance claims (James-Stein best, GMLEB second) difficult to reproduce or assess for robustness.
Authors: We apologize for the insufficient documentation. The manuscript will be revised to include a new subsection in the methods that fully specifies: (i) the exact distributional assumptions (i.i.d. normal returns with mean zero and unit volatility, population Sharpes drawn from the stated uniform or normal distributions), (ii) the Monte Carlo protocol (number of replications, random seeds, and parameter grid), (iii) the precise correlation matrices employed (identity and constant-correlation cases), and (iv) the verification steps confirming that each estimator was coded according to the cited theoretical references. These additions will make the simulation results reproducible from the revised text alone. revision: yes
Circularity Check
No significant circularity; claims rest on independent Monte Carlo evaluation
full rationale
The paper evaluates post-selection Sharpe ratio estimators (polyhedral, James-Stein, GMLEB, etc.) via Monte Carlo simulation, reporting bias, RMSE, and rank correlation against known population parameters. These simulations generate returns and population Sharpes independently of the estimators under test. No equation or procedure reduces a reported performance metric to a fitted input by construction, nor does any central claim rely on a self-citation chain, imported uniqueness theorem, or ansatz smuggled from prior work. The comparison to external benchmarks (Jiang & Zhang GMLEB, classic James-Stein) is independent of the present paper's fitted values.
Axiom & Free-Parameter Ledger
Reference graph
Works this paper leans on
-
[1]
Pseudomathematics and financial charlatanism: The ef- fects of backtest over fitting on out-of-sample performance.Notices of the AMS, 61(5):458–471, 2014
David H Bailey, Jonathan M Borwein, Marcos L´ opez De Prado, and Qiji Jim Zhu. Pseudomathematics and financial charlatanism: The ef- fects of backtest over fitting on out-of-sample performance.Notices of the AMS, 61(5):458–471, 2014. URLhttps://papers.ssrn.com/sol3/ papers.cfm?abstract_id=2308659
2014
-
[2]
Teoria statistica delle classi e calcolo delle probabilita
Carlo Bonferroni. Teoria statistica delle classi e calcolo delle probabilita. Pubblicazioni del R istituto superiore di scienze economiche e commericiali di firenze, 8:3–62, 1936
1936
-
[3]
Cootner, editor.The Random Character of Stock Market Prices
Paul H. Cootner, editor.The Random Character of Stock Market Prices. MIT Press, 1964. ISBN 9780262030090. URLhttps://books.google. com/books?id=gcuMygAACAAJ
1964
-
[4]
Hsu, editors
Xinping Cui, Thorsten Dickhaus, Ying Ding, and Jason C. Hsu, editors. Handbook of Multiple Comparisons. Chapman and Hall/CRC, 2022. ISBN 9781032111551
2022
-
[5]
Dolan and Jorge J
Elizabeth D. Dolan and Jorge J. Mor´ e. Benchmarking optimization soft- ware with performance profiles, 2002. URLhttps://arxiv.org/abs/cs/ 0102001
2002
-
[6]
David L. Donoho and Iain M. Johnstone. Adapting to unknown smooth- ness via wavelet shrinkage.Journal of the American Statistical Associa- tion, 90(432):1200–1224, 1995. doi: 10.1080/01621459.1995.10476626. URL https://imjohnstone.su.domains/WEBLIST/1995/ausws.pdf
-
[7]
URLhttps://doi.org/10.1198/ jasa.2011.tm11181
Bradley Efron. Tweedie’s formula and selection bias.Journal of the Amer- ican Statistical Association, 106(496):1602–1614, 2011. ISSN 01621459. doi: 10.1198/jasa.2011.tm11181. URLhttps://pmc.ncbi.nlm.nih.gov/ articles/PMC3325056/
-
[8]
A test for superior predictive ability.Jour- nal of Business and Economic Statistics, 23(4), 2005
Peter Reinhard Hansen. A test for superior predictive ability.Jour- nal of Business and Economic Statistics, 23(4), 2005. doi: 10.1198/ 073500105000000063. URLhttp://pubs.amstat.org/doi/abs/10.1198/ 073500105000000063
2005
-
[9]
Estimation with quadratic loss
William James and Charles Stein. Estimation with quadratic loss. In Proceedings of the fourth Berkeley symposium on mathematical statistics and probability, pages 361–379. University of California Press, 1961
1961
-
[10]
Wenhua Jiang and Cun-Hui Zhang. General maximum likelihood empirical Bayes estimation of normal means.The Annals of Statistics, 37(4):1647– 1684, 2009. doi: 10.1214/08-AOS638. URLhttps://doi.org/10.1214/ 08-AOS638
-
[11]
General maximum likelihood empirical bayes estimation of normal means, 2009
Wenhua Jiang and Cun-Hui Zhang. General maximum likelihood empirical bayes estimation of normal means, 2009. URLhttps://arxiv.org/abs/ 0908.1709. 30
Pith/arXiv arXiv 2009
-
[12]
Iain Johnstone and Bernard W. Silverman. EbayesThresh: R programs for empirical Bayes thresholding.Journal of Statistical Software, 12(8): 1–38, 2005. doi: 10.18637/jss.v012.i08. URLhttps://www.jstatsoft. org/index.php/jss/article/view/v012i08
-
[13]
Iain M. Johnstone and Bernard W. Silverman. Needles and straw in haystacks: Empirical Bayes estimates of possibly sparse se- quences.The Annals of Statistics, 32(4):1594–1649, 2004. doi: 10.1214/009053604000000030. URLhttps://projecteuclid.org/ journals/annals-of-statistics/volume-32/issue-4/Needles-and- straw-in-haystacks--Empirical-Bayes-estimates-of/10...
-
[14]
Kaufman.Commodity Trading Systems and Methods
Perry J. Kaufman.Commodity Trading Systems and Methods. Wiley, 1978. ISBN 9780471035695
1978
-
[15]
Exact post-selection inference, with application to the lasso
Jason D. Lee, Dennis L. Sun, Yuekai Sun, and Jonathan E. Taylor. Ex- act post-selection inference, with application to the lasso, 2013. URL http://arxiv.org/abs/1311.6238. cite arxiv:1311.6238 Comment: Pub- lished at http://dx.doi.org/10.1214/15-AOS1371 in the Annals of Statistics (http://www.imstat.org/aos/) by the Institute of Mathematical Statistics (h...
work page internal anchor Pith review Pith/arXiv arXiv doi:10.1214/15-aos1371 2013
-
[16]
Paleologo.The Elements of Quantitative Investing
Giuseppe A. Paleologo.The Elements of Quantitative Investing. John Wiley and Sons, 2025. ISBN 9781394265459
2025
-
[17]
Steven E. Pav. Conditional inference on the asset with maximum Sharpe ra- tio. Privately Published, 2019. URLhttp://arxiv.org/abs/1906.00573
Pith/arXiv arXiv 2019
-
[18]
Pav.The Sharpe Ratio: Statistics and Applications
Steven E. Pav.The Sharpe Ratio: Statistics and Applications. CRC Press,
-
[19]
Stephen Reid, Jonathan Taylor, and Robert Tibshirani. Post-selection point and interval estimation of signal sizes in Gaussian samples.Canadian Journal of Statistics, 45(2):128–148, 2017. URLhttps://arxiv.org/abs/ 1405.3340
Pith/arXiv arXiv 2017
-
[20]
William F. Sharpe. Mutual fund performance.Journal of Business, 39:119,
-
[21]
URLhttp://dx.doi.org/10.1086/294846
doi: 10.1086/294846. URLhttp://dx.doi.org/10.1086/294846
-
[22]
Silvapulle and Pranab Kumar Sen.Constrained statistical infer- ence : inequality, order, and shape restrictions
Mervyn J. Silvapulle and Pranab Kumar Sen.Constrained statistical infer- ence : inequality, order, and shape restrictions. Wiley-Interscience, Hobo- ken, N.J., 2005. ISBN 0471208272. URLhttp://books.google.com/ books?isbn=0471208272
2005
-
[23]
Silverman, Ludger Evers, Kan Xu, Peter Carbonetto, and Matthew Stephens.EbayesThresh: Empirical Bayes Thresholding and Related Methods, 2017
Bernard W. Silverman, Ludger Evers, Kan Xu, Peter Carbonetto, and Matthew Stephens.EbayesThresh: Empirical Bayes Thresholding and Related Methods, 2017. URLhttps://CRAN.R-project.org/package= EbayesThresh. R package version 1.4-12
2017
-
[24]
of” in the title, which we felt was better than the original, “on
Halbert White. A reality check for data snooping.Econometrica, 68:1097– 1127, 2000. doi: 10.1111/1468-0262.00152. URLhttps://www.ssc.wisc. edu/~bhansen/718/White2000.pdf. 31 A AI Use Statement We attempted to use AI in the preparation of this manuscript: •We asked gemini 3.0 for advice naming this paper. This resulted in several awful suggestions, which w...
discussion (0)
Sign in with ORCID, Apple, or X to comment. Anyone can read and Pith papers without signing in.