Continuous Hidden Markov Models for Equity Returns: Heavy-Tail Emission Families and Regime-Conditional Value-at-Risk
Pith reviewed 2026-06-26 01:54 UTC · model grok-4.3
The pith
The failure of hidden Markov models for equity returns is distributional rather than temporal, fixed by heavy-tailed emissions.
A machine-rendered reading of the paper's core claim, the machinery that carries it, and where it could break.
Core claim
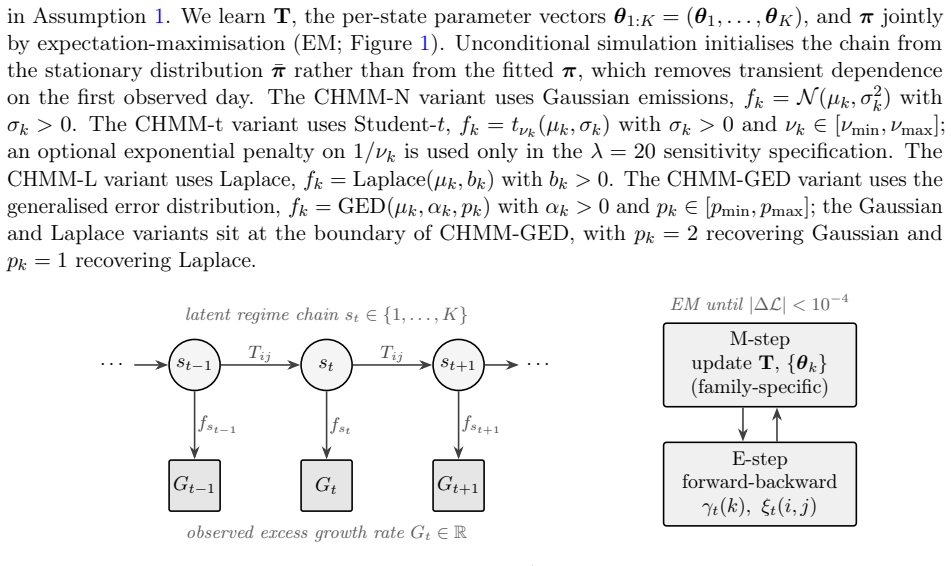
The original failure of hidden Markov models to capture equity return dynamics is distributional, not temporal. With a unified expectation-maximization framework for Gaussian, Student-t, Laplace, and generalized-error emissions, heavy-tailed marginals recover volatility clustering above the i.i.d. baseline and narrow the kurtosis gap, while the spectral bound on decay modes is not binding. On daily US equities the fitted model suffices for path simulation, regime-conditional VaR, and cross-asset correlation reproduction.
What carries the argument
The continuous hidden Markov model separating autocorrelation structure (regime chain) from marginal distributions (per-regime heavy-tailed densities), bounded by a spectral identity on the centred transition matrix.
If this is right
- Across SPY walk-forward folds and other panels, heavy-tailed marginals close most of the fit gap.
- The model yields regime-conditional Value-at-Risk passing a joint conditional-coverage test.
- A copula derived from the model reproduces cross-asset correlations.
- Unlike bootstrap or semi-Markov fits, the model serves both simulation and downstream risk tasks.
Where Pith is reading between the lines
- If the separation holds, similar heavy-tailed HMMs could address clustering in other financial time series without added model complexity.
- Testing on intraday data would check whether the distributional fix scales beyond daily returns.
- The regime-conditional outputs could improve scenario generation for portfolio optimization beyond what i.i.d. or single-distribution models allow.
Load-bearing premise
The regime chain governs the autocorrelation structure while per-regime densities govern the marginal distribution, separating temporal and distributional aspects.
What would settle it
Finding that even with heavy-tailed emissions the model cannot reproduce the slow decay of absolute-return autocorrelation on out-of-sample daily equity returns, or that the regime-conditional VaR fails the conditional coverage test.
Figures
read the original abstract
Synthetic generators of daily equity returns let practitioners stress test, backtest, and design scenarios that a single realized market history cannot supply, but only if the generator reproduces the stylized facts of real returns: heavy tails, negligible linear autocorrelation, and slow decay of the absolute-return autocorrelation. Hidden Markov models with few Gaussian states were long thought unable to reproduce that slow decay, and the standard fix was to abandon them for more complex hidden semi-Markov models. We revisit this issue with a continuous hidden Markov model whose regime chain governs the autocorrelation while per-regime densities govern the marginal, separating the temporal and distributional sides of the original failure. A unified expectation-maximization framework fits Gaussian, Student-t, Laplace, and generalized-error emissions under shared forward-backward recursions and quantile-based initialization, and a spectral identity bounds the number of decay modes by the rank of the centred transition matrix. Across SPY walk-forward folds, a sector-balanced 30-ticker panel, a CRSP cross-decade transfer, and a six-asset basket, that bound was not binding once a few states were used: heavy-tailed marginals, not additional decay modes, closed most of the fit gap, recovering volatility clustering above the i.i.d. baseline and narrowing the kurtosis gap without a tuning hyperparameter. The original failure is therefore distributional, not temporal. On daily US equities, a simple, interpretable Markov model suffices, and unlike a bootstrap or semi-Markov fit that wins only on a single-window fit, the fitted model also yields a regime-conditional Value-at-Risk that passes a joint conditional-coverage test and a copula that reproduces cross-asset correlations: one interpretable generator serving both path simulation and downstream risk and portfolio tasks.
Editorial analysis
A structured set of objections, weighed in public.
Referee Report
Summary. The manuscript claims that the failure of low-state Gaussian hidden Markov models to reproduce the slow decay of absolute-return autocorrelations in daily equity returns is distributional (insufficient tail weight in the per-regime marginals) rather than temporal (insufficient decay modes in the regime chain). By separating these roles explicitly—the transition matrix governs autocorrelation structure while heavy-tailed emissions (Student-t, Laplace, GED) govern the marginals—and using a spectral identity to bound the number of exponential decay modes by the rank of the centred transition matrix, the authors show via unified EM fitting (with quantile initialization) that a small number of states recovers volatility clustering above the i.i.d. baseline, narrows the kurtosis gap, and yields regime-conditional VaR that passes a joint conditional-coverage test plus a copula reproducing cross-asset correlations, across SPY walk-forward folds, a 30-ticker panel, CRSP transfer, and multi-asset basket. The original shortfall is therefore distributional, and a simple Markov model suffices.
Significance. If the empirical results and the spectral bound hold under full verification, the work supplies a parsimonious, interpretable generator for synthetic equity returns that matches key stylized facts while supporting downstream tasks such as stress testing and risk management. The explicit role separation, the parameter-free spectral bound, the unified EM framework, and the multi-diagnostic validation (autocorrelation decay, kurtosis, VaR coverage, copula correlations) across walk-forward and cross-decade settings are clear strengths that could reduce reliance on semi-Markov or bootstrap alternatives.
major comments (2)
- [§3] §3 (model definition) and the paragraph beginning 'We revisit this issue': the separation of temporal (transition matrix) and distributional (emissions) roles is imposed by construction; the claim that the original failure is therefore distributional therefore rests entirely on whether the fitted heavy-tailed models close the autocorrelation gap while the spectral bound remains non-binding. An explicit comparison—Gaussian emissions with increasing state count versus heavy-tailed emissions with small count—would isolate whether additional temporal modes could compensate for light tails; without it the attribution remains model-dependent rather than independently falsifiable.
- [§5.2] §5.2 and Table 3 (walk-forward results): the statement that 'the bound was not binding once a few states were used' is load-bearing for the central claim; the fitted transition matrices, their centred ranks, and the realized number of distinct exponential decay rates in the absolute-return ACF should be reported to confirm that the spectral identity is not violated and that heavy tails alone close the gap.
minor comments (2)
- [Methods] The quantile-based initialization procedure is mentioned in the abstract but its precise algorithm and sensitivity to starting quantiles should be stated explicitly in the methods section to ensure reproducibility.
- [Notation] Notation for the emission families (Student-t, Laplace, GED) and their parameterizations should be standardized in a single table or appendix to avoid ambiguity when comparing fits across datasets.
Simulated Author's Rebuttal
We thank the referee for the constructive report and positive recommendation. The two major comments both concern the strength of the attribution that the original shortfall is distributional rather than temporal. We address each below and will incorporate the requested material in a revised manuscript.
read point-by-point responses
-
Referee: [§3] §3 (model definition) and the paragraph beginning 'We revisit this issue': the separation of temporal (transition matrix) and distributional (emissions) roles is imposed by construction; the claim that the original failure is therefore distributional therefore rests entirely on whether the fitted heavy-tailed models close the autocorrelation gap while the spectral bound remains non-binding. An explicit comparison—Gaussian emissions with increasing state count versus heavy-tailed emissions with small count—would isolate whether additional temporal modes could compensate for light tails; without it the attribution remains model-dependent rather than independently falsifiable.
Authors: We agree that an explicit side-by-side comparison would make the distributional attribution more robust and falsifiable. Although the literature and our preliminary fits already indicate that Gaussian HMMs require many more states to approach the observed ACF decay (and still fall short on kurtosis), we will add a dedicated panel in the revision (new Table or Figure in §5.2) that directly compares (i) Gaussian emissions with 2–10 states against (ii) Student-t, Laplace and GED emissions with 3–4 states on the same SPY walk-forward folds, reporting both ACF lag-1 to lag-20 decay and the kurtosis gap. This will be obtained under the same EM procedure and quantile initialization so that the only difference is the emission family and state cardinality. revision: yes
-
Referee: [§5.2] §5.2 and Table 3 (walk-forward results): the statement that 'the bound was not binding once a few states were used' is load-bearing for the central claim; the fitted transition matrices, their centred ranks, and the realized number of distinct exponential decay rates in the absolute-return ACF should be reported to confirm that the spectral identity is not violated and that heavy tails alone close the gap.
Authors: We accept this verification request. In the revised §5.2 we will augment Table 3 (and the corresponding text) with, for each reported SPY fold and each emission family: (a) the estimated transition matrix, (b) the numerical rank of its centred version, and (c) the count of distinct exponential rates visible in the model-implied absolute-return ACF (obtained by fitting a sum-of-exponentials to the theoretical ACF derived from the spectral decomposition). These quantities will confirm that the observed number of decay modes never exceeds the centred rank and that the improvement over the Gaussian baseline is attributable to the heavier tails rather than to additional temporal modes. revision: yes
Circularity Check
No significant circularity identified
full rationale
The paper explicitly defines its HMM to separate the Markov chain's role in autocorrelation from the emission densities' role in marginals, then uses empirical fits on walk-forward SPY folds, cross-decade CRSP transfer, and multi-asset panels plus downstream VaR and copula checks to conclude that heavy-tailed marginals close the gap. This separation is an architectural choice whose adequacy is tested against external data rather than derived from itself; the spectral bound on decay modes is stated as a mathematical identity independent of the target result, and no step reduces a claimed prediction to a fitted parameter or self-citation by construction. The derivation chain remains self-contained against the reported benchmarks.
Axiom & Free-Parameter Ledger
Reference graph
Works this paper leans on
-
[1]
arXiv preprint arXiv:2205.03257 , year=
James Jordon, Lukasz Szpruch, Florimond Houssiau, Mirko Bottarelli, Giovanni Cherubin, Carsten Maple, Samuel N. Cohen, and Adrian Weller. Synthetic data: what, why and how? arXiv preprint arXiv:2205.03257, 2022. doi: 10.48550/arXiv.2205.03257. URLhttps://arxiv. org/abs/2205.03257
-
[2]
Assefa, Danial Dervovic, Mahmoud Mahfouz, Robert E
Samuel A. Assefa, Danial Dervovic, Mahmoud Mahfouz, Robert E. Tillman, Prashant Reddy, and Manuela Veloso. Generating synthetic data in finance: opportunities, challenges and pitfalls. InProceedings of the First ACM International Conference on AI in Finance, pages 1–8, 2020
2020
-
[3]
Abdulrahman Alswaidan and Jeffrey D. Varner. Hybrid hidden markov model for modeling equity excess growth rate dynamics: A discrete-state approach with jump-diffusion.arXiv preprint arXiv:2603.10202, 2026. doi: 10.48550/arXiv.2603.10202. URLhttps://arxiv.org/ abs/2603.10202. Preprint, not yet peer-reviewed
-
[4]
The variation of certain speculative prices.The Journal of Business, 36(4): 394–419, 1963
Benoit Mandelbrot. The variation of certain speculative prices.The Journal of Business, 36(4): 394–419, 1963. 16
1963
-
[5]
R. Cont. Empirical properties of asset returns: stylized facts and statistical issues.Quantitative Finance, 1(2):223–236, 2001
2001
-
[6]
Robert F. Engle. Autoregressive conditional heteroscedasticity with estimates of the variance of united kingdom inflation.Econometrica, 50(4):987–1007, 1982
1982
-
[7]
Generalized autoregressive conditional heteroscedasticity.Journal of Economet- rics, 31(3):307–327, 1986
Tim Bollerslev. Generalized autoregressive conditional heteroscedasticity.Journal of Economet- rics, 31(3):307–327, 1986
1986
-
[8]
Bootstrap methods: Another look at the jackknife.The Annals of Statistics, 7 (1):1–26, 1979
Bradley Efron. Bootstrap methods: Another look at the jackknife.The Annals of Statistics, 7 (1):1–26, 1979
1979
-
[9]
Time-series generative adversarial networks
Jinsung Yoon, Daniel Jarrett, and Mihaela van der Schaar. Time-series generative adversarial networks. InAdvances in Neural Information Processing Systems (NeurIPS), volume 32, 2019
2019
-
[10]
Quant GANs: Deep generation of financial time series.Quantitative Finance, 20(9):1419–1440, 2020
Magnus Wiese, Robert Knobloch, Ralf Korn, and Peter Kretschmer. Quant GANs: Deep generation of financial time series.Quantitative Finance, 20(9):1419–1440, 2020
2020
-
[11]
Autoregressive denoising diffusion models for multivariate probabilistic time series forecasting
Kashif Rasul, Calvin Seward, Ingmar Schuster, and Roland Vollgraf. Autoregressive denoising diffusion models for multivariate probabilistic time series forecasting. InProceedings of the 38th International Conference on Machine Learning, pages 8857–8868, 2021
2021
-
[12]
Stylized facts of daily return series and the hidden Markov model.Journal of Applied Econometrics, 13(3):217–244, 1998
Tobias Rydén, Timo Teräsvirta, and Stefan Åsbrink. Stylized facts of daily return series and the hidden Markov model.Journal of Applied Econometrics, 13(3):217–244, 1998
1998
-
[13]
Stylized facts of financial time series and hidden semi-Markov models
Jan Bulla and Ingo Bulla. Stylized facts of financial time series and hidden semi-Markov models. Computational Statistics & Data Analysis, 51(4):2192–2209, 2006
2006
-
[14]
Hamilton.Time Series Analysis
James D. Hamilton.Time Series Analysis. Princeton University Press, Princeton, NJ, 1994
1994
-
[15]
Springer, Berlin, 1997
Hans-Martin Krolzig.Markov-Switching Vector Autoregressions: Modelling, Statistical Inference, and Application to Business Cycle Analysis, volume 454 ofLecture Notes in Economics and Mathematical Systems. Springer, Berlin, 1997
1997
-
[16]
Moments of Markov switching models.Journal of Econometrics, 96(1): 75–111, 2000
Allan Timmermann. Moments of Markov switching models.Journal of Econometrics, 96(1): 75–111, 2000
2000
-
[17]
Christoffersen
Peter F. Christoffersen. Evaluating interval forecasts.International Economic Review, 39(4): 841–862, 1998
1998
-
[18]
Hamilton
James D. Hamilton. A new approach to the economic analysis of nonstationary time series and the business cycle.Econometrica, 57(2):357–384, 1989
1989
-
[19]
Regime switching in stock market returns.Applied Financial Economics, 7(2):177–191, 1997
Huntley Schaller and Simon Van Norden. Regime switching in stock market returns.Applied Financial Economics, 7(2):177–191, 1997
1997
-
[20]
Long memory of financial time series and hidden markov models with time-varying parameters.Journal of Forecasting, 36(8):989–1002, 2017
Peter Nystrup, Henrik Madsen, and Erik Lindström. Long memory of financial time series and hidden markov models with time-varying parameters.Journal of Forecasting, 36(8):989–1002, 2017
2017
-
[21]
McLachlan
David Peel and Geoffrey J. McLachlan. Robust mixture modelling using thet distribution. Statistics and Computing, 10(4):339–348, 2000. 17
2000
-
[22]
Chuanhai Liu and Donald B. Rubin. ML estimation of thet distribution using EM and its extensions, ECM and ECME.Statistica Sinica, 5(1):19–39, 1995
1995
-
[23]
M. T. Subbotin. On the law of frequency of error.Matematicheskii Sbornik, 31(2):296–301, 1923
1923
-
[24]
George E. P. Box and George C. Tiao.Bayesian Inference in Statistical Analysis. Addison-Wesley, Reading, MA, 1973
1973
-
[25]
A conditionally heteroskedastic time series model for speculative prices and rates of return.Review of Economics and Statistics, 69(3):542–547, 1987
Tim Bollerslev. A conditionally heteroskedastic time series model for speculative prices and rates of return.Review of Economics and Statistics, 69(3):542–547, 1987
1987
-
[26]
Daniel B. Nelson. Conditional heteroskedasticity in asset returns: A new approach.Econometrica, 59(2):347–370, 1991
1991
-
[27]
Glosten, Ravi Jagannathan, and David E
Lawrence R. Glosten, Ravi Jagannathan, and David E. Runkle. On the relation between the expected value and the volatility of the nominal excess return on stocks.The Journal of Finance, 48(5):1779–1801, 1993
1993
-
[28]
Threshold heteroskedastic models.Journal of Economic Dynamics and Control, 18(5):931–955, 1994
Jean-Michel Zakoïan. Threshold heteroskedastic models.Journal of Economic Dynamics and Control, 18(5):931–955, 1994
1994
-
[29]
Paolella
Markus Haas, Stefan Mittnik, and Marc S. Paolella. A new approach to Markov-switching GARCH models.Journal of Financial Econometrics, 2(4):493–530, 2004
2004
-
[30]
David Ardia, Keven Bluteau, Kris Boudt, Leopoldo Catania, and Denis-Alexandre Trottier. Markov-switching GARCH models in R: The MSGARCH package.Journal of Statistical Software, 91(4):1–38, 2019. doi: 10.18637/jss.v091.i04
-
[31]
Andersen and Tim Bollerslev
Torben G. Andersen and Tim Bollerslev. Heterogeneous information arrivals and return volatility dynamics: Uncovering the long-run in high frequency returns.The Journal of Finance, 52(3): 975–1005, 1997
1997
-
[32]
A simple approximate long-memory model of realized volatility.Journal of Financial Econometrics, 7(2):174–196, 2009
Fulvio Corsi. A simple approximate long-memory model of realized volatility.Journal of Financial Econometrics, 7(2):174–196, 2009
2009
-
[33]
Stephen J. Taylor. Financial returns modelled by the product of two stochastic processes – a study of the daily sugar prices 1961–79. In O. D. Anderson, editor,Time Series Analysis: Theory and Practice 1, pages 203–226. North-Holland, Amsterdam, 1982
1961
-
[34]
Polson, and Peter E
Eric Jacquier, Nicholas G. Polson, and Peter E. Rossi. Bayesian analysis of stochastic volatility models.Journal of Business & Economic Statistics, 12(4):371–389, 1994
1994
-
[35]
Stochastic volatility: likelihood inference and comparison with ARCH models.Review of Economic Studies, 65(3):361–393, 1998
Sangjoon Kim, Neil Shephard, and Siddhartha Chib. Stochastic volatility: likelihood inference and comparison with ARCH models.Review of Economic Studies, 65(3):361–393, 1998
1998
-
[36]
Alessandro Rossi and Giampiero M. Gallo. Volatility estimation via hidden Markov models. Journal of Empirical Finance, 13(2):203–230, 2006
2006
-
[37]
Abanto-Valle, Roland Langrock, Ming-Hui Chen, and Michel V
Carlos A. Abanto-Valle, Roland Langrock, Ming-Hui Chen, and Michel V. Cardoso. Maximum likelihood estimation for stochastic volatility in mean models with heavy-tailed distributions. Applied Stochastic Models in Business and Industry, 33(4):394–408, 2017. 18
2017
-
[38]
Mike K. P. So, K. Lam, and W. K. Li. A stochastic volatility model with Markov switching. Journal of Business & Economic Statistics, 16(2):244–253, 1998
1998
-
[39]
Modeling financial time-series with generative adversarial networks.Physica A: Statistical Mechanics and its Applications, 527: 121261, 2019
Shuntaro Takahashi, Yu Chen, and Kumiko Tanaka-Ishii. Modeling financial time-series with generative adversarial networks.Physica A: Statistical Mechanics and its Applications, 527: 121261, 2019
2019
-
[40]
Can GANs learn the stylized facts of financial time series? In Proceedings of the 5th ACM International Conference on AI in Finance, pages 126–133, 2024
Sohyeon Kwon and Yongjae Lee. Can GANs learn the stylized facts of financial time series? In Proceedings of the 5th ACM International Conference on AI in Finance, pages 126–133, 2024
2024
-
[41]
Ilya Chevyrev and Andrey Kormilitzin. A primer on the signature method in machine learning. arXiv preprint arXiv:1603.03788, 2016. doi: 10.48550/arXiv.1603.03788. URLhttps://arxiv. org/abs/1603.03788
-
[42]
Sig-Wasserstein GANs for time series generation.arXiv preprint arXiv:2111.01207, 2021
Hao Ni, Lukasz Szpruch, Marc Sabate-Vidales, Baoren Xiao, Magnus Wiese, and Shujian Liao. Sig-Wasserstein GANs for time series generation.arXiv preprint arXiv:2111.01207, 2021. doi: 10.48550/arXiv.2111.01207. URLhttps://arxiv.org/abs/2111.01207
-
[43]
A data-driven market simulator for small data environments.arXiv preprint arXiv:2006.14498, 2020
Hans Bühler, Blanka Horvath, Terry Lyons, Imanol Perez Arribas, and Ben Wood. A data-driven market simulator for small data environments.arXiv preprint arXiv:2006.14498, 2020. doi: 10.48550/arXiv.2006.14498. URLhttps://arxiv.org/abs/2006.14498
-
[44]
Denoising diffusion probabilistic models
Jonathan Ho, Ajay Jain, and Pieter Abbeel. Denoising diffusion probabilistic models. In Advances in Neural Information Processing Systems, volume 33, pages 6840–6851, 2020
2020
-
[45]
CSDI: Conditional score-based diffusion models for probabilistic time series imputation
Yusuke Tashiro, Jiaming Song, Yang Song, and Stefano Ermon. CSDI: Conditional score-based diffusion models for probabilistic time series imputation. InAdvances in Neural Information Processing Systems, volume 34, 2021
2021
-
[46]
William F. Sharpe. A simplified model for portfolio analysis.Management Science, 9(2):277–293, 1963
1963
-
[47]
A. Sklar. Fonctions de répartition àn dimensions et leurs marges.Publications de l’Institut de Statistique de l’Université de Paris, 8:229–231, 1959
1959
-
[48]
Nelsen.An Introduction to Copulas
Roger B. Nelsen.An Introduction to Copulas. Springer, 2 edition, 2006
2006
-
[49]
Stefano Demarta and Alexander J. McNeil. Thet copula and related copulas.International Statistical Review, 73(1):111–129, 2005
2005
-
[50]
McNeil, Rüdiger Frey, and Paul Embrechts.Quantitative Risk Management: Concepts, Techniques and Tools
Alexander J. McNeil, Rüdiger Frey, and Paul Embrechts.Quantitative Risk Management: Concepts, Techniques and Tools. Princeton University Press, revised edition, 2015
2015
-
[51]
Iman and W
Ronald L. Iman and W. J. Conover. A distribution-free approach to inducing rank correlation among input variables.Communications in Statistics–Simulation and Computation, 11(3): 311–334, 1982
1982
-
[52]
Robert F. Engle. Dynamic conditional correlation: a simple class of multivariate generalized autoregressive conditional heteroskedasticity models.Journal of Business & Economic Statistics, 20(3):339–350, 2002
2002
-
[53]
Cavit Pakel, Neil Shephard, Kevin Sheppard, and Robert F. Engle. Fitting vast dimensional time-varying covariance models.Journal of Business & Economic Statistics, 39(3):652–668, 2021. 19
2021
-
[54]
Thinking in categories: A survey on assessing the quality for time series synthesis.Journal of Data and Information Quality, 16(2):1–32, 2024
Michael Stenger, André Bauer, Thomas Prantl, Robert Leppich, Nathaniel Hudson, Kyle Chard, Ian Foster, and Samuel Kounev. Thinking in categories: A survey on assessing the quality for time series synthesis.Journal of Data and Information Quality, 16(2):1–32, 2024
2024
-
[55]
Strictlyproperscoringrules, prediction, andestimation
TilmannGneitingandAdrianE.Raftery. Strictlyproperscoringrules, prediction, andestimation. Journal of the American Statistical Association, 102(477):359–378, 2007
2007
-
[56]
Probabilistic forecasting.Annual Review of Statistics and Its Application, 1:125–151, 2014
Tilmann Gneiting and Matthias Katzfuss. Probabilistic forecasting.Annual Review of Statistics and Its Application, 1:125–151, 2014
2014
-
[57]
Diebold and Roberto S
Francis X. Diebold and Roberto S. Mariano. Comparing predictive accuracy.Journal of Business & Economic Statistics, 13(3):253–263, 1995
1995
-
[58]
Borgwardt, Malte J
Arthur Gretton, Karsten M. Borgwardt, Malte J. Rasch, Bernhard Schölkopf, and Alexander Smola. A kernel two-sample test.Journal of Machine Learning Research, 13(1):723–773, 2012
2012
-
[59]
Conditional Sig- Wasserstein GANs for time series generation.arXiv preprint arXiv:2006.05421, 2020
Hao Ni, Lukasz Szpruch, Magnus Wiese, Shujian Liao, and Baoren Xiao. Conditional Sig- Wasserstein GANs for time series generation.arXiv preprint arXiv:2006.05421, 2020. doi: 10.48550/arXiv.2006.05421. URLhttps://arxiv.org/abs/2006.05421
-
[60]
Stambaugh
Ľuboš Pástor and Robert F. Stambaugh. The equity premium and structural breaks.Journal of Finance, 56(4):1207–1239, 2001
2001
-
[61]
Detecting multiple breaks in financial market volatility dynamics.Journal of Applied Econometrics, 17(5):579–600, 2002
Elena Andreou and Eric Ghysels. Detecting multiple breaks in financial market volatility dynamics.Journal of Applied Econometrics, 17(5):579–600, 2002
2002
-
[62]
Regime changes and financial markets.Annual Review of Financial Economics, 4(1):313–337, 2012
Andrew Ang and Allan Timmermann. Regime changes and financial markets.Annual Review of Financial Economics, 4(1):313–337, 2012
2012
-
[63]
Hashem Pesaran and Allan Timmermann
M. Hashem Pesaran and Allan Timmermann. Selection of estimation window in the presence of breaks.Journal of Econometrics, 137(1):134–161, 2007
2007
-
[64]
Online EM algorithm for hidden Markov models.Journal of Computational and Graphical Statistics, 20(3):728–749, 2011
Olivier Cappé. Online EM algorithm for hidden Markov models.Journal of Computational and Graphical Statistics, 20(3):728–749, 2011
2011
-
[65]
Bayesian Online Changepoint Detection
Ryan P. Adams and David J. C. MacKay. Bayesian online changepoint detection.arXiv preprint arXiv:0710.3742, 2007. doi: 10.48550/arXiv.0710.3742. URLhttps://arxiv.org/abs/0710. 3742
work page internal anchor Pith review Pith/arXiv arXiv doi:10.48550/arxiv.0710.3742 2007
-
[66]
On-line inference for multiple changepoint problems.Journal of the Royal Statistical Society: Series B (Statistical Methodology), 69(4):589–605, 2007
Paul Fearnhead and Zhen Liu. On-line inference for multiple changepoint problems.Journal of the Royal Statistical Society: Series B (Statistical Methodology), 69(4):589–605, 2007
2007
-
[67]
Rabiner and B
L. Rabiner and B. Juang. An introduction to hidden Markov models.IEEE ASSP Magazine, 3 (1):4–16, 1986
1986
-
[68]
Jeff A. Bilmes. A gentle tutorial of the em algorithm and its application to parameter estimation for gaussian mixture and hidden markov models. Technical Report TR-97-021, International Computer Science Institute, 1998
1998
-
[69]
Baum, Ted Petrie, George Soules, and Norman Weiss
Leonard E. Baum, Ted Petrie, George Soules, and Norman Weiss. A maximization technique occurring in the statistical analysis of probabilistic functions of markov chains.The Annals of Mathematical Statistics, 41(1):164–171, 1970. 20
1970
-
[70]
C. F. Jeff Wu. On the convergence properties of the EM algorithm.The Annals of Statistics, 11 (1):95–103, 1983
1983
-
[71]
Xiao-Li Meng and Donald B. Rubin. Maximum likelihood estimation via the ECM algorithm: A general framework.Biometrika, 80(2):267–278, 1993
1993
-
[72]
A. N. Kolmogorov. Sulla determinazione empirica di una legge di distribuzione.Giornale dell’Istituto Italiano degli Attuari, 4:83–91, 1933
1933
-
[73]
N. Smirnov. Table for estimating the goodness of fit of empirical distributions.The Annals of Mathematical Statistics, 19(2):279–281, 1948
1948
-
[74]
Paul H. Kupiec. Techniques for verifying the accuracy of risk measurement models.Journal of Derivatives, 3(2):73–84, 1995
1995
-
[75]
Levin and Yuval Peres.Markov Chains and Mixing Times
David A. Levin and Yuval Peres.Markov Chains and Mixing Times. American Mathematical Society, 2 edition, 2017
2017
-
[76]
VaR without correlations for portfolios of derivative securities.Journal of Futures Markets, 19(5):583–602, 1999
Giovanni Barone-Adesi, Kostas Giannopoulos, and Les Vosper. VaR without correlations for portfolios of derivative securities.Journal of Futures Markets, 19(5):583–602, 1999
1999
-
[77]
Engle and Simone Manganelli
Robert F. Engle and Simone Manganelli. CAViaR: Conditional autoregressive value at risk by regression quantiles.Journal of Business & Economic Statistics, 22(4):367–381, 2004
2004
-
[78]
Journal of the Royal Statistical Society Series B: Statistical Methodology , author =
Yoav Benjamini and Yosef Hochberg. Controlling the false discovery rate: A practical and powerful approach to multiple testing.Journal of the Royal Statistical Society: Series B (Methodological), 57(1):289–300, 1995. doi: 10.1111/j.2517-6161.1995.tb02031.x
-
[79]
Scholz and Michael A
Fritz W. Scholz and Michael A. Stephens. K-sample Anderson–Darling tests.Journal of the American Statistical Association, 82(399):918–924, 1987
1987
-
[80]
Springer, 2003
Paul Glasserman.Monte Carlo Methods in Financial Engineering. Springer, 2003
2003
discussion (0)
Sign in with ORCID, Apple, or X to comment. Anyone can read and Pith papers without signing in.