Optimizing Visual Analytics Workflows: From Theory to Practice
Pith reviewed 2026-06-25 22:55 UTC · model grok-4.3
The pith
Case studies show that an information-theoretic methodology for optimizing visual analytics workflows is feasible in practice, with obstacles addressed by a proposed roadmap.
A machine-rendered reading of the paper's core claim, the machinery that carries it, and where it could break.
Core claim
The theory-based methodology for optimizing VA workflows demonstrates strengths and feasibility through case studies, with obstacles that can be addressed by the proposed roadmap.
What carries the argument
Action research method applied to case studies that test hypotheses about using the ontology for information-theoretic trade-off analysis in VA workflows.
If this is right
- The methodology enables systematic reasoning about trade-offs when building integrated VA workflows.
- Researchers can apply the approach across application domains regardless of their specific background knowledge.
- Obstacles identified in the studies can be removed using the outlined roadmap for broader adoption.
- Human-centric and machine-centric processes can complement each other more effectively once the methodology is in routine use.
Where Pith is reading between the lines
- The same action-research approach could be used to test the methodology in additional domains not covered by the original case studies.
- If the roadmap succeeds, the ontology could become a standard reference for designing new VA tools that balance visualization and computation.
- Long-term tracking of workflow performance before and after applying the methodology would provide direct measures of optimization gains.
Load-bearing premise
The selected case studies across domains and with researchers of varying backgrounds provide representative evidence sufficient to evaluate broad practicality and to identify generalizable obstacles.
What would settle it
A new set of case studies conducted after following the roadmap that still encounter persistent, unaddressed obstacles to applying the methodology would show the approach is not broadly deployable.
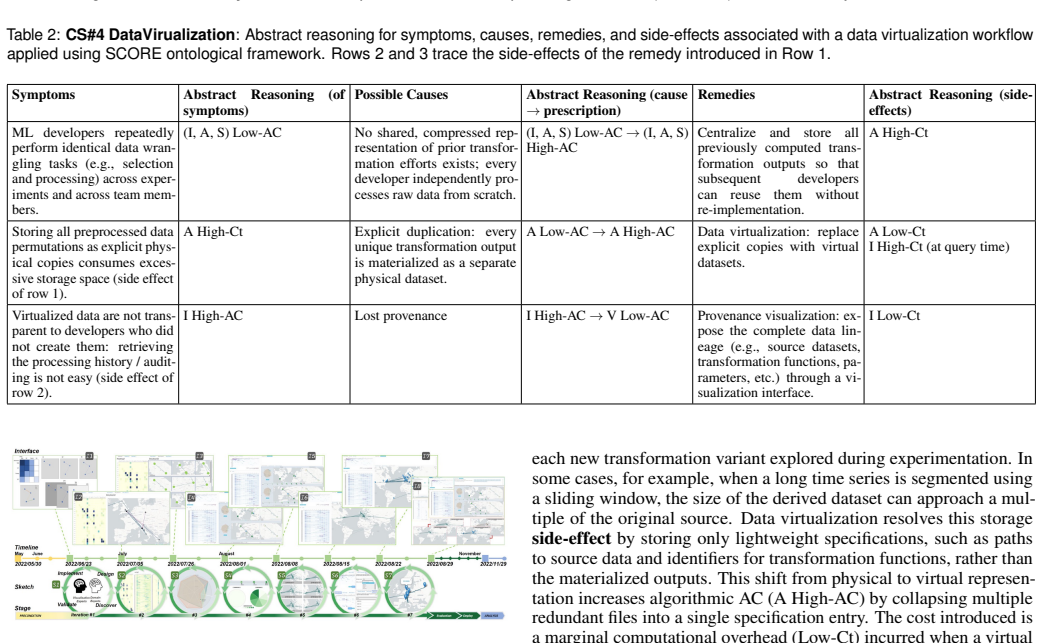
Figures
read the original abstract
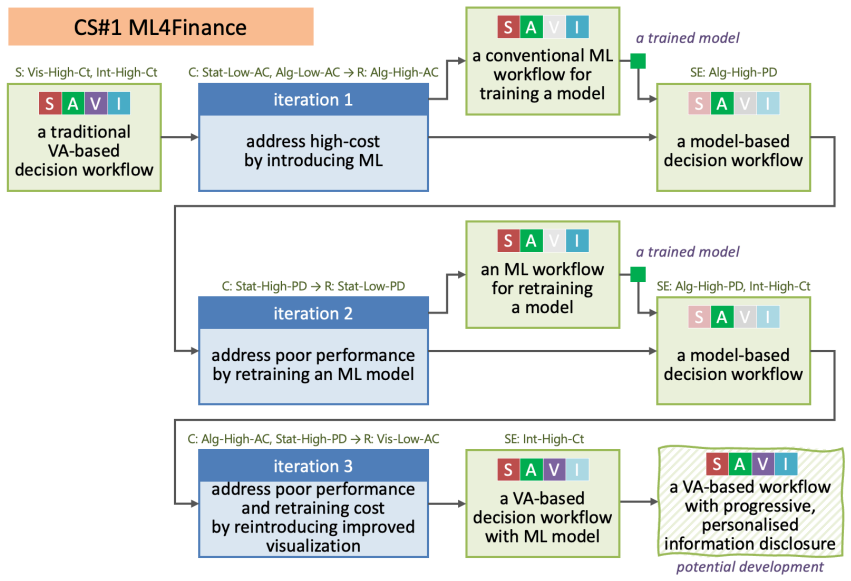
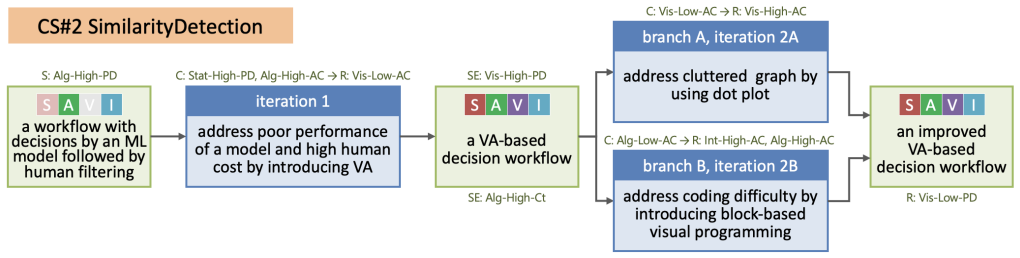
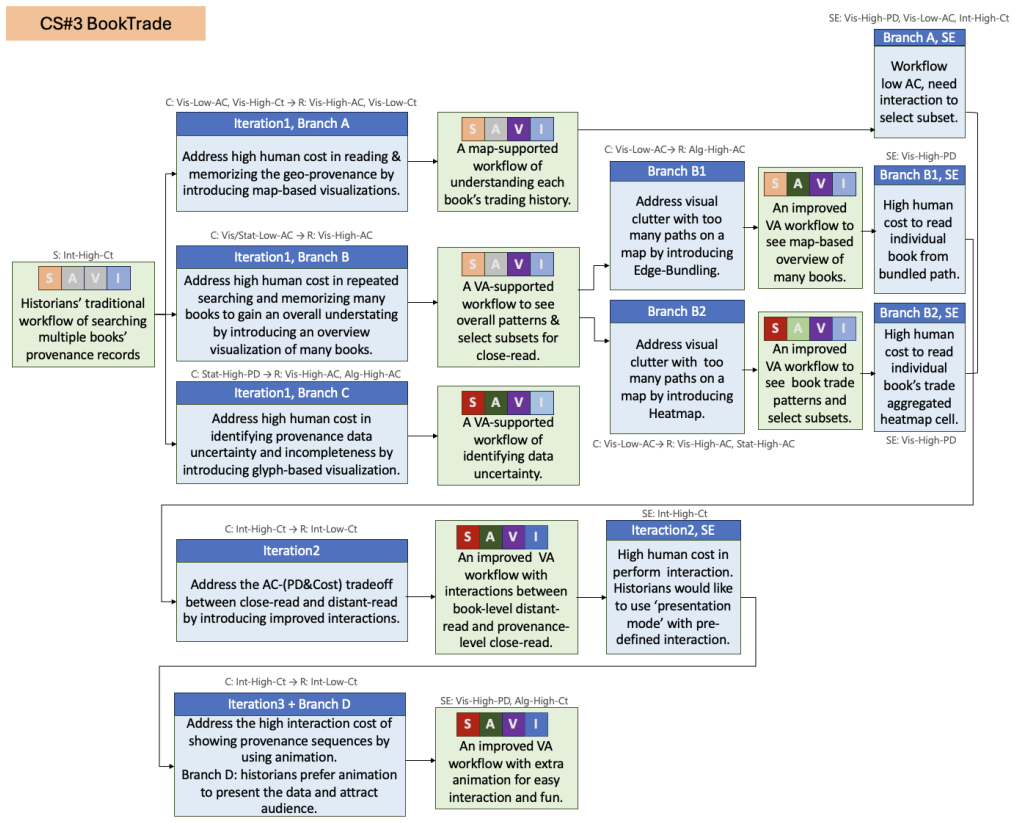
The principle of visual analytics (VA) is to provide integrated workflows where human-centric processes (e.g., visualization and interaction) and machine-centric processes (e.g., statistics and algorithms) complement each other. To implement this principle in practice, it is necessary to reason about the trade-offs among different processes and make optimal use of them in a workflow. Building on an existing ontology of the methodology for analyzing such trade-offs information-theoretically and for optimizing VA workflows systematically, we investigate ways to transform this methodology from theory to practice. In particular, we adopted the action research method. Through case studies in different application domains, VA researchers with different background knowledge and experiences offered their answers to several hypotheses about using the methodology in practice and proposed ways forward. In this paper, we present our collective analysis, the strengths and feasibility of this theory-based methodology, as well as the obstacles to its broad deployment in practice. To address these challenges, we outline a roadmap to remove such obstacles.
Editorial analysis
A structured set of objections, weighed in public.
Referee Report
Summary. The paper claims that an existing information-theoretic ontology for analyzing trade-offs in visual analytics workflows can be transitioned from theory to practice via action research. Case studies conducted in different application domains with VA researchers of varying backgrounds and experiences are used to test several hypotheses, identify strengths and feasibility, surface obstacles to broad deployment, and outline a roadmap for addressing those obstacles.
Significance. If the case-study evidence is representative, the work would provide a concrete bridge between abstract optimization frameworks and deployable VA practice, with explicit attention to human factors and workflow integration that is currently underrepresented in the literature.
major comments (2)
- [Abstract and Methods description of case studies] The central claim that the case studies demonstrate generalizable strengths, feasibility, and obstacles rests on the representativeness of the participant pool and domains. The manuscript provides no selection criteria, sample size, domain coverage statistics, or protocol for assessing generalizability (see the description of the action-research method and collective analysis).
- [Results / collective analysis section] Without explicit reporting of how the 'several hypotheses' were operationalized, measured, or falsified in each case study, it is not possible to evaluate whether the reported obstacles are load-bearing or merely anecdotal (see the section presenting collective analysis of answers to hypotheses).
minor comments (2)
- [Abstract] The abstract references an 'existing ontology' but does not cite its prior publication or clarify the degree of author overlap, which affects assessment of novelty.
- [Introduction / background] Notation for the information-theoretic quantities (e.g., trade-off measures) is not introduced in the provided summary, making it difficult to connect the practical findings back to the theoretical claims.
Simulated Author's Rebuttal
We thank the referee for these constructive comments, which highlight opportunities to strengthen the methodological transparency of our action research study. We address each point below and will revise the manuscript to provide the requested details.
read point-by-point responses
-
Referee: [Abstract and Methods description of case studies] The central claim that the case studies demonstrate generalizable strengths, feasibility, and obstacles rests on the representativeness of the participant pool and domains. The manuscript provides no selection criteria, sample size, domain coverage statistics, or protocol for assessing generalizability (see the description of the action-research method and collective analysis).
Authors: We agree that the manuscript would benefit from explicit reporting of these elements. While action research emphasizes contextual depth and practical insights over statistical representativeness, we will revise the methods section to describe the participant selection process (based on domain relevance, availability, and diversity of backgrounds), report the exact sample size and domains covered, and outline the protocol used in the collective analysis to evaluate transferability of findings. These additions will better ground the claims about strengths, feasibility, and obstacles. revision: yes
-
Referee: [Results / collective analysis section] Without explicit reporting of how the 'several hypotheses' were operationalized, measured, or falsified in each case study, it is not possible to evaluate whether the reported obstacles are load-bearing or merely anecdotal (see the section presenting collective analysis of answers to hypotheses).
Authors: The hypotheses were explored through qualitative responses collected via discussions and workshops in each case study, with the collective analysis identifying recurring themes across participants. We acknowledge that the current description does not detail the operationalization steps. We will revise the collective analysis section to explicitly describe how each hypothesis was formulated and posed, the data collection approach, and the thematic synthesis process used to assess responses, thereby clarifying the evidential basis for the reported obstacles. revision: yes
Circularity Check
No significant circularity detected
full rationale
The paper applies action research and case studies to assess the practicality of a pre-existing ontology for VA workflow optimization. The new empirical content (case studies across domains) is independent of the cited ontology. No mathematical derivations, self-definitional constructs, fitted inputs presented as predictions, or load-bearing self-citations that reduce claims to prior inputs by construction are present. The reference to the ontology functions as standard background rather than a circular foundation for the reported strengths, feasibility, or roadmap.
Axiom & Free-Parameter Ledger
Reference graph
Works this paper leans on
-
[1]
A. Abdul-Rahman, J. Lein, K. Coles, E. Maguire, M. Meyer, M. Wynne et al. Rule-based visual mappings – with a case study on poetry visualization. Computer Graphics Forum, 32(3pt4):381–390, 2013. doi: 10.1111/cgf. 12125 7
work page doi:10.1111/cgf 2013
-
[2]
A. Abdul-Rahman, G. Roe, M. Olsen, C. Gladstone, R. Whaling, N. Cronk et al. Constructive visual analytics for text similarity detection.Computer Graphics Forum, 36(1):237–248, 2017. doi: 10.1111/cgf.12798 3, 12, 13
- [3]
-
[4]
D. Akbaba, D. Lange, M. Correll, A. Lex, and M. Meyer. Troubling col- laboration: Matters of care for visualization design study. InProceedings of the 2023 CHI Conference on Human Factors in Computing Systems, pp. 1–15. ACM, 4 2023. doi: 10.1145/3544548.3581168 2
-
[5]
Araújo, J
T. Araújo, J. Alves, B. Marques, P. Dias, B. S. Meiguins, and B. S. San- tos. A focus group study on visualization-based reinforcement learning interpretability. InProc. 29th International Conference on Information Visualisation (IV), pp. 326–331, 2025. 2
2025
-
[6]
B. Bach, E. Freeman, A. Abdul-Rahman, C. Turkay, S. Khan, Y . Fan et al. Dashboard design patterns.IEEE Transactions on Visualization and Computer Graphics, 29(1):342–352, 2023. 2, 3, 20
2023
-
[7]
R. Borgo, K. Proctor, M. Chen, H. Jänicke, T. Murray, and I. Thornton. Evaluating the impact of task demands and block resolution on the effec- tiveness of pixel-based visualization.IEEE Transactions on Visualization and Computer Graphics, 16(6):963–972, 2010. doi: 10.1109/TVCG.2010. 150 12, 19
-
[8]
C. CERL. Material Evidence in Incunabula. https://data.cerl.org/ mei/_search, 2015. Accessed: 2025-06-30. 13
2015
-
[9]
M. Chen. Is information loss good or bad? https://www.youtube.com/watch?v=miCMxfe4jsA, 2022. BCS Oxfordshire. 7
2022
-
[10]
M. Chen. IV AS: Improving Visual Analytics Systems. https://sites.google.com/view/ivas/home, last accessed: March 2026. 1, 2, 3, 12, 20
2026
-
[11]
M. Chen, A. Abdul-Rahman, D. Silver, and M. Sbert. A bounded mea- sure for estimating the benefit of visualization (part ii): case studies and empirical evaluation.Entropy, 24(2):#282, 37 pages, 2022. 2
2022
-
[12]
Chen and D
M. Chen and D. Ebert. How to reject a vis paper, or not?IEEE Computer Graphics and Applications, 45(6):101–111, 2025. 1
2025
-
[13]
Chen and D
M. Chen and D. S. Ebert. An ontological framework for supporting the design and evaluation of visual analytics systems.Computer Graphics Forum, 38(3):131–144, 2019. 1, 2, 4, 6, 9, 12, 16, 18, 19, 20
2019
-
[14]
Chen and A
M. Chen and A. Golan. What may visualization processes optimize?IEEE Transactions on Visualization and Computer Graphics, 22(12):2619–2632,
-
[15]
Chen and H
M. Chen and H. Jänicke. An information-theoretic framework for visu- alization.IEEE Transactions on Visualization and Computer Graphics, 16(6):1206–1215, 2010. 2
2010
-
[16]
M. Chen and M. Sbert. A bounded measure for estimating the benefit of visualization (part i): Theoretical discourse and conceptual evaluation. Entropy, 24:#228, 25 pages, 1 2022. doi: 10.3390/e24020228 2
-
[17]
A. Diehl, A. Abdul-Rahman, B. Bach, M. El-Assady, M. Kraus, R. S. Laramee et al. An analysis of the interplay and mutual benefits of grounded theory and visualization.IEEE Transactions on Visualization and Computer Graphics, 31:5462–5479, 9 2025. doi: 10.1109/TVCG. 2024.3452985 2
-
[18]
Y . Drocourt, R. Borgo, K. Scharrer, T. Murray, S. I. Bevan, and M. Chen. Temporal visualization of boundary-based geo-information using radial projection.Computer Graphics Forum, 30(3):981–990, 2011. doi: 10. 1111/j.1467-8659.2011.01947.x 3, 19
arXiv 2011
-
[19]
K. W. Hall, A. J. Bradley, U. Hinrichs, S. Huron, J. Wood, C. Collins et al. Design by immersion: A transdisciplinary approach to problem- driven visualizations.IEEE Transactions on Visualization and Computer Graphics, 26:109–118, 1 2020. doi: 10.1109/TVCG.2019.2934790 2
-
[20]
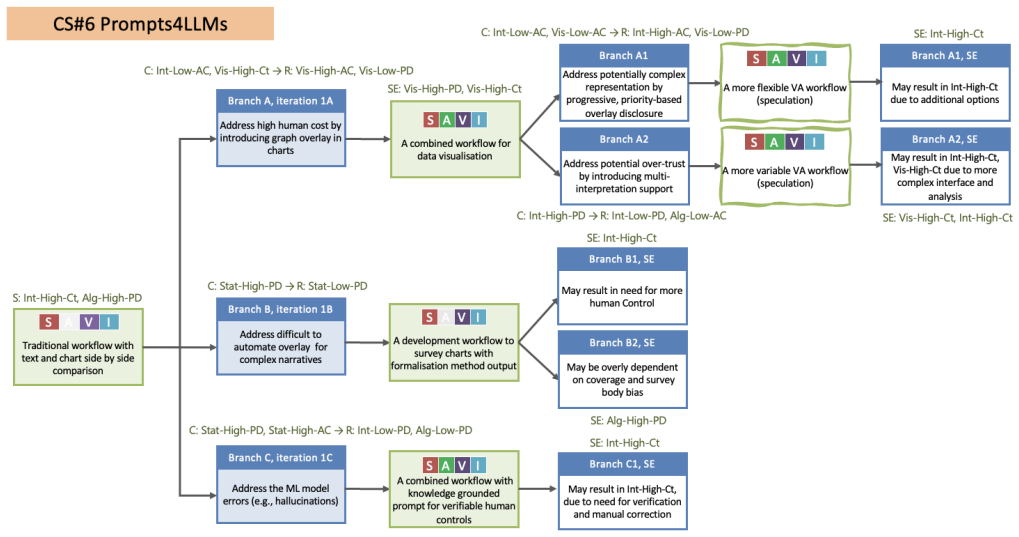
J. Hao, M. Yang, Q. Shi, Y . Jiang, G. Zhang, and W. Zeng. Finflier: Automating graphical overlays for financial visualizations with knowledge- grounding large language model.IEEE Transactions on Visualization and Computer Graphics, 31:6353–6369, 9 2025. doi: 10.1109/TVCG.2024. 3514138 3, 12, 17, 18
-
[21]
G. R. Hayes. The relationship of action research to human-computer interaction.ACM Trans. Comput.-Hum. Interact., 18(3), art. no. 15, 20 pages, Aug. 2011. doi: 10.1145/1993060.1993065 2
-
[22]
Hsieh, A
H.-P. Hsieh, A. Zavatsky, and M. Chen. Multi-criteria decision analysis for aiding glyph design.IEEE Transactions on Visualization and Computer Graphics, 31(10):6705–6718, 2025. 9
2025
-
[23]
Hullman and N
J. Hullman and N. Diakopoulos. Visualization rhetoric: Framing effects in narrative visualization.IEEE Transactions on Visualization and Computer Graphics, 17(12):2231–2240, 2011. 2
2011
-
[24]
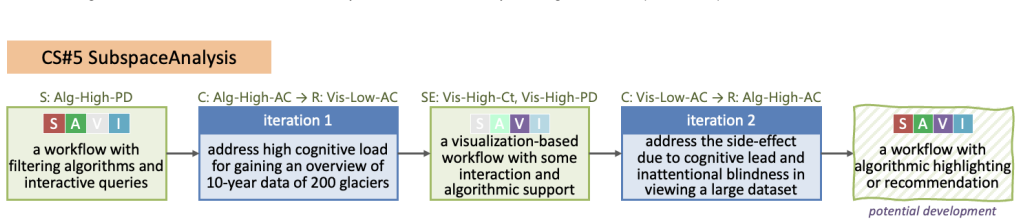
W. Jentner, G. Lindholz, H. Hauptmann, M. El-Assady, K.-L. Ma, and D. Keim. Visual analytics of co-occurrences to discover subspaces in structured data.ACM Trans. Interact. Intell. Syst., 13(2), art. no. 10, 49 pages, June 2023. doi: 10.1145/3579031 3, 12, 16
-
[25]
Y . Jin, T. J. A. de Jong, M. Tennekes, and M. Chen. Radial Icicle Tree (RIT): Node separation and area constancy.IEEE Transactions on Vi- sualization and Computer Graphics, 30(1):251–261, 2024. 1, 2, 3, 4, 20
2024
-
[26]
Kandel, A
S. Kandel, A. Paepcke, J. M. Hellerstein, and J. Heer. Enterprise data analysis and visualization: An interview study.IEEE Transactions on Visualization and Computer Graphics, 18:2917–2926, 12 2012. doi: 10. 1109/TVCG.2012.219 2
2012
-
[27]
D. A. Keim, G. L. Andrienko, C. G. J. Fekete, J. Kohlhammer, and G. Melançon. Visual analytics: Definition, process, and challenges. In Information Visualization - Human-Centered Issues and Perspectives, pp. 154–175. Springer, 2008. 1
2008
-
[28]
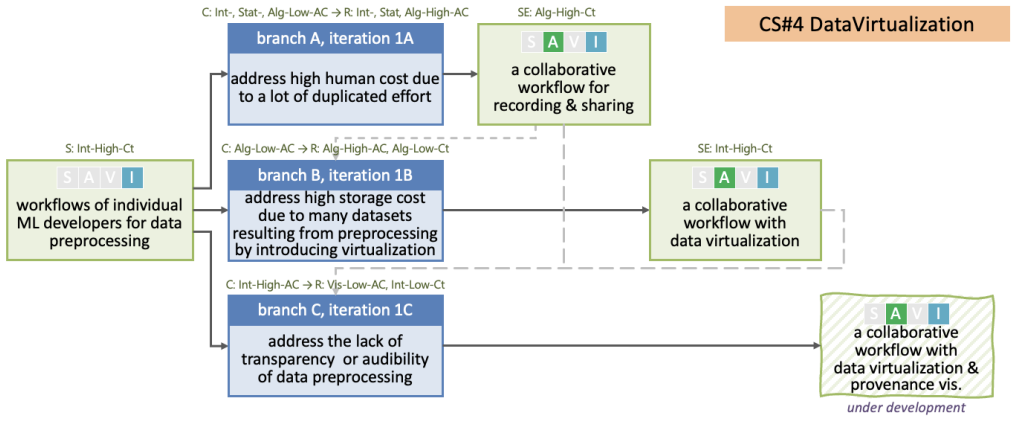
S. Khan, J. Chakraborty, P. Beaucamp, N. Bhujel, and M. Chen. Data Virtualization for Machine Learning. InInternational Conference on Services Computing (SCC), pp. 69–84. Springer Nature Switzerland, 2025. 3, 12, 14
2025
-
[29]
H. Lam, E. Bertini, P. Isenberg, C. Plaisant, and S. Carpendale. Empirical studies in information visualization: Seven scenarios.IEEE Transactions on Visualization and Computer Graphics, 18:1520–1536, 9 2012. doi: 10. 1109/TVCG.2011.279 2
2012
-
[30]
Larman.Agile and Iterative Development: A Manager’s Guide
C. Larman.Agile and Iterative Development: A Manager’s Guide. Addison-Wesley Professional, 2003. 1
2003
-
[31]
K. Lewin. Action research and minority problems.Journal of Social Issues, 2(4):34–46, 1946. doi: 10.1111/j.1540-4560.1946.tb02295.x 2
-
[32]
R. C. Martin.Agile Software Development, Principles, Patterns, and Practices. Pearson, 2014. 1
2014
-
[33]
McCurdy, J
N. McCurdy, J. Dykes, and M. Meyer. Action design research and visu- alization design. InProceedings of the Sixth Workshop on Beyond Time and Errors on Novel Evaluation Methods for Visualization, BELIV ’16, pp. 10–18. Association for Computing Machinery, New York, NY , USA,
-
[34]
doi: 10.1145/2993901.2993916 2
-
[35]
McNiff.Action Research: Principles and Practice
J. McNiff.Action Research: Principles and Practice. Routledge, 3rd ed.,
-
[36]
Meyer and J
M. Meyer and J. Dykes. Criteria for rigor in visualization design study. IEEE Transactions on Visualization and Computer Graphics, pp. 1–1,
-
[37]
doi: 10.1109/TVCG.2019.2934539 2
-
[38]
Moretti.Distant Reading
F. Moretti.Distant Reading. Verso Books, London, 2013. 7
2013
-
[39]
T. Munzner. A nested model for visualization design and validation.IEEE Transactions on Visualization and Computer Graphics, 15:921–928, 2009. doi: 10.1109/TVCG.2009.111 1, 2, 3, 6
-
[40]
Reason and H
P. Reason and H. Bradbury, eds.Handbook of Action Research: Participa- tive Inquiry and Practice. Sage, London, 2001. 1, 2
2001
-
[41]
Rydow, R
E. Rydow, R. Borgo, H. Fang, T. Torsney-Weir, B. Swallow, T. Porphyre et al. Development and evaluation of two approaches of visual sensitivity analysis to support epidemiological modelling.IEEE Transactions on Visualization and Computer Graphics, 29(1):1255–1265, 2023. 2, 3, 20
2023
-
[42]
Saner and M
A. Saner and M. Chen. Music similarity detection through comparative imagery data.Applied Sciences, 15(14):#7706 (25 pages), 2025. 2
2025
-
[43]
Sedlmair, M
M. Sedlmair, M. Meyer, and T. Munzner. Design study methodology: Reflections from the trenches and the stacks.IEEE Transactions on Visualization and Computer Graphics, 18(12):2431–2440, 2012. 1, 2
2012
-
[44]
M. K. Sein, O. Henfridsson, S. Purao, M. Rossi, and R. Lindgren. Action design research.Management Information Systems Quarterly, 35(1):37– 56, 03 2011. doi: 10.2307/23043488 2
-
[45]
J. J. Thomas and K. A. Cook.Illuminating the Path: The Research and Development Agenda for Visual Analytics. IEEE Computer Society Press, Los Alamitos, 2005. 1
2005
-
[46]
P. C. Wong and J. Thomas. Visual analytics.IEEE Computer Graphics and Applications, 24(5):20–21, 2004. 1
2004
-
[47]
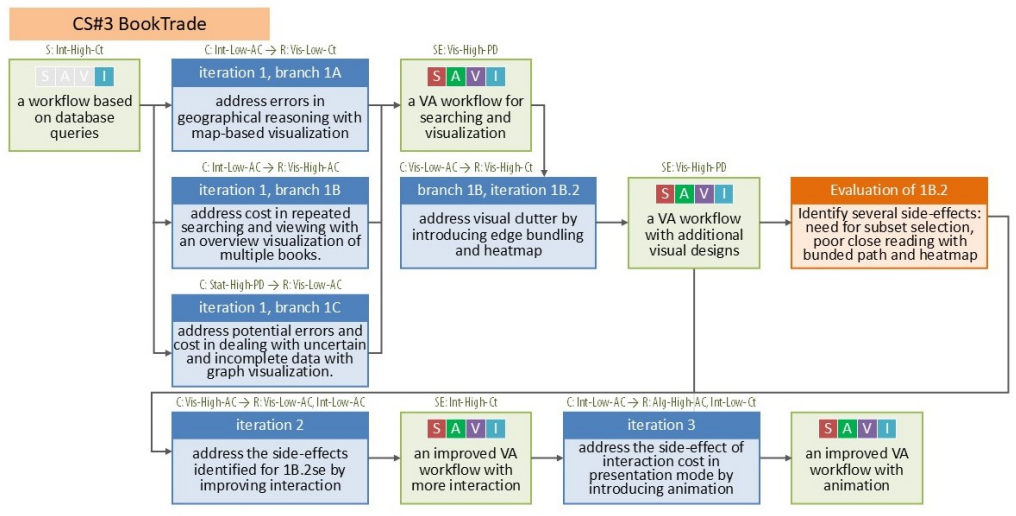
Y . Xing, C. Dondi, R. Borgo, and A. Abdul-Rahman. Visualizing histor- ical book trade data: An iterative design study with close collaboration with domain experts.IEEE Transactions on Visualization and Computer Graphics, 30(1):540–550, 2024. doi: 10.1109/TVCG.2023.3326923 3, 7, 12, 13
-
[48]
F. Yan, Y . Wang, X. Yue, K.-K. Wong, K. Mao, R. Zhang et al. FundSelec- tor: A visual analysis system for mutual fund selection.Visual Informatics, 9(4):100258, 12 2025. doi: 10.1016/j.visinf.2025.100258 3, 6, 12
-
[49]
F. Yan, Y . Wang, X. Yue, K.-K. Wong, K. Mao, R. Zhang et al. Visual anal- ysis approach for mutual fund selection.Frontiers of Computer Science, 19:195604, 5 2025. doi: 10.1007/s11704-024-40742-x 3, 6, 12
-
[50]
Ye and M
Z. Ye and M. Chen. Visualizing ensemble predictions of music mood. IEEE Transactions on Visualization and Computer Graphics, 29(1):864– 874, 2023. 1, 2, 3, 4, 20
2023
-
[51]
Zhang, B
J. Zhang, B. Ahlbrand, A. Malik, J. Chae, Z. Min, S. Ko et al. A visual analytics framework for microblog data analysis at multiple scales of aggregation.Computer Graphics Forum, 35(3):441–450, 2016. 1, 2, 3, 20
2016
-
[52]
Zhang, C
J. Zhang, C. Surakitbanharn, N. Elmqvist, R. Maciejewski, Z. Qian, and D. S. Ebert. TopoText: Context-preserving text data exploration across multiple spatial scales. InProc. ACM CHI Conference on Human Factors in Computing Systems. Montreal QC, 2018. Paper No. 37. 1, 2, 3
2018
-
[53]
Y . Zhang, Y . Sun, J. D. Gaggiano, N. Kumar, C. Andris, and A. G. Parker. Visualization design practices in a crisis: Behind the scenes with covid-19 dashboard creators.IEEE Transactions on Visualization and Computer Graphics, pp. 1–11, 2022. doi: 10.1109/TVCG.2022.3209493 2
-
[54]
the car drives this road and then that one
J. Zhao, A. Malik, H. Xu, G. Wang, J. Zhang, C. Surakitbanharn et al. Metricsvis: A visual analytics framework for performance evaluation of law enforcement officers. InProc. IEEE Symposium on Technologies for Homeland Security. Waltham, MA, 2017. 1, 2, 3, 20 APPENDICES Optimizing Visual Analytics Workflows: From Theory to Practice P. Beaucamp1, A. Abdul-...
2017
discussion (0)
Sign in with ORCID, Apple, or X to comment. Anyone can read and Pith papers without signing in.