Evaluation of medium range machine learning models for sub-seasonal prediction
Pith reviewed 2026-06-25 20:10 UTC · model grok-4.3
The pith
Machine learning models built for medium-range forecasts show skill on sub-seasonal timescales comparable to physics-based ensembles.
A machine-rendered reading of the paper's core claim, the machinery that carries it, and where it could break.
Core claim
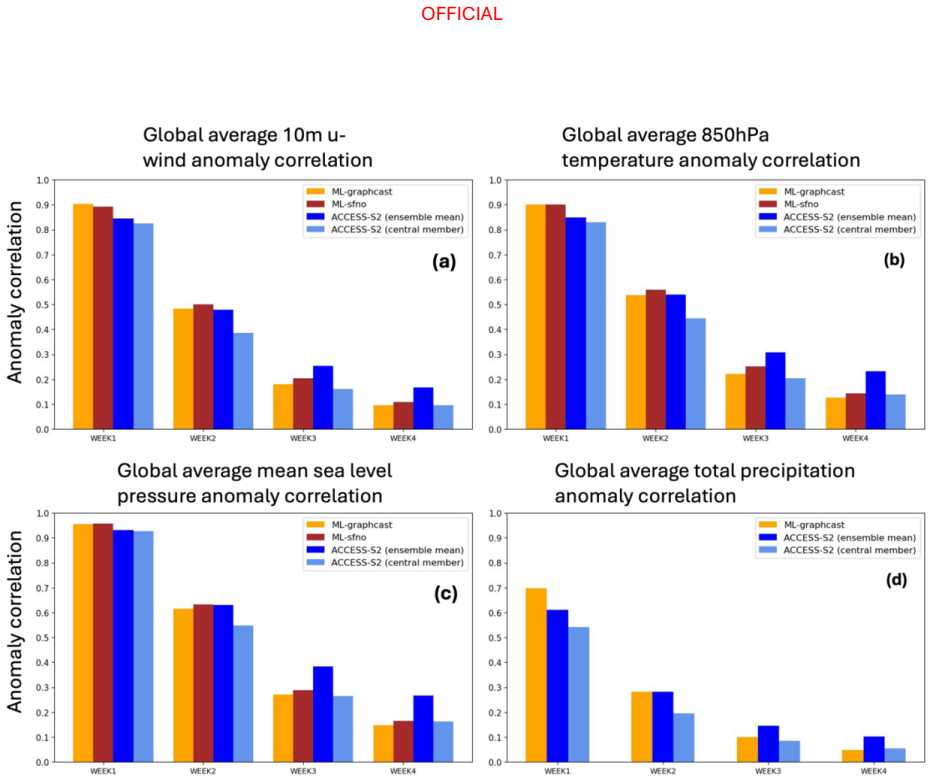
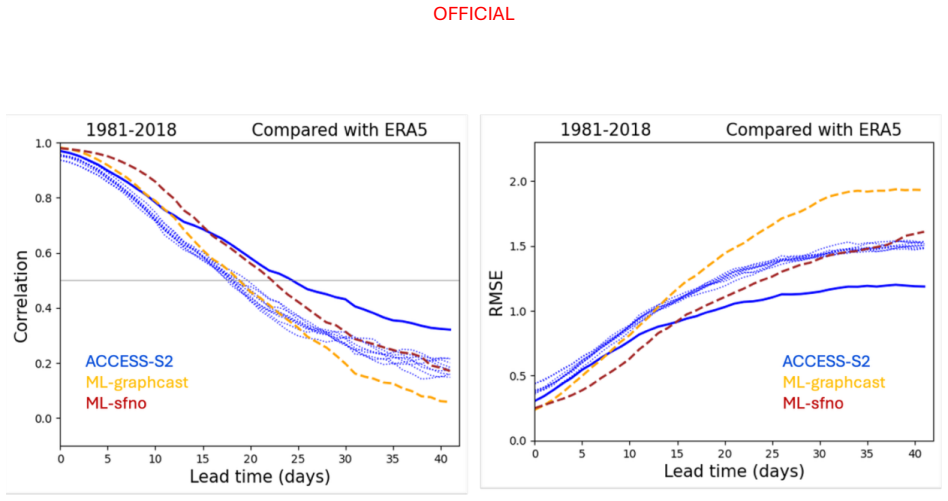
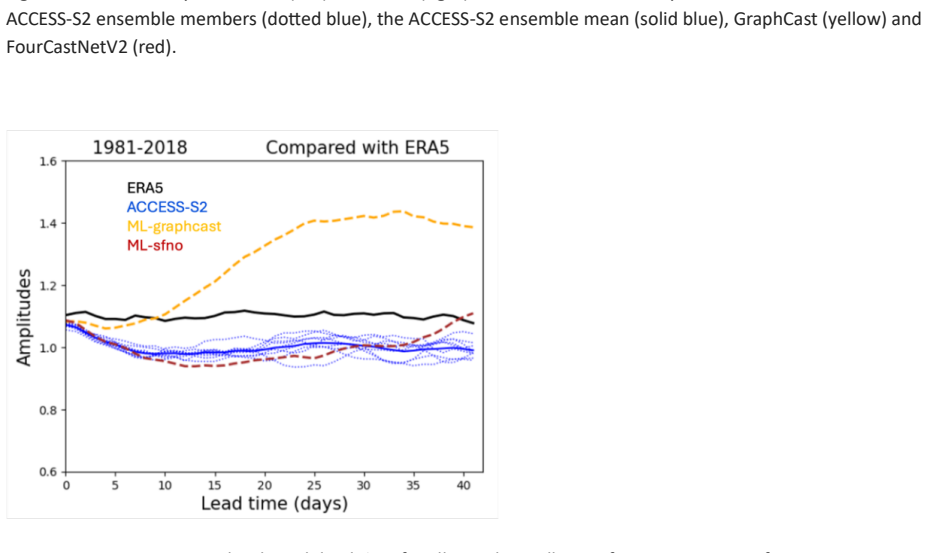
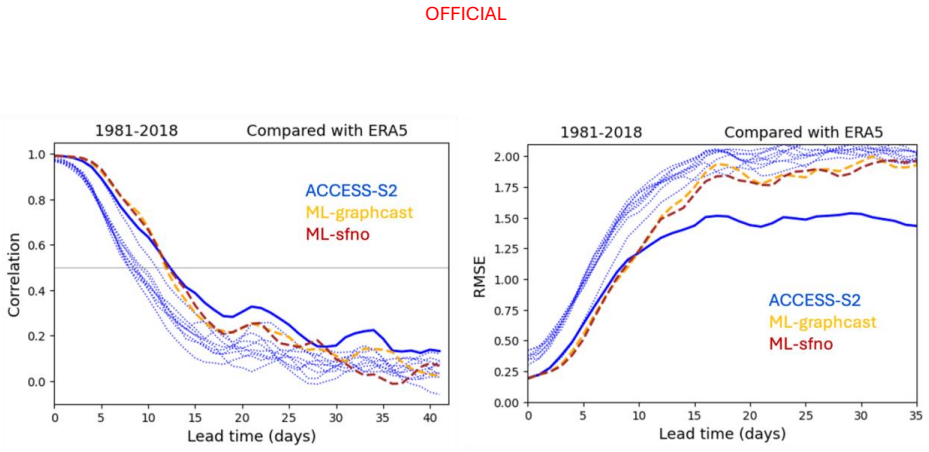
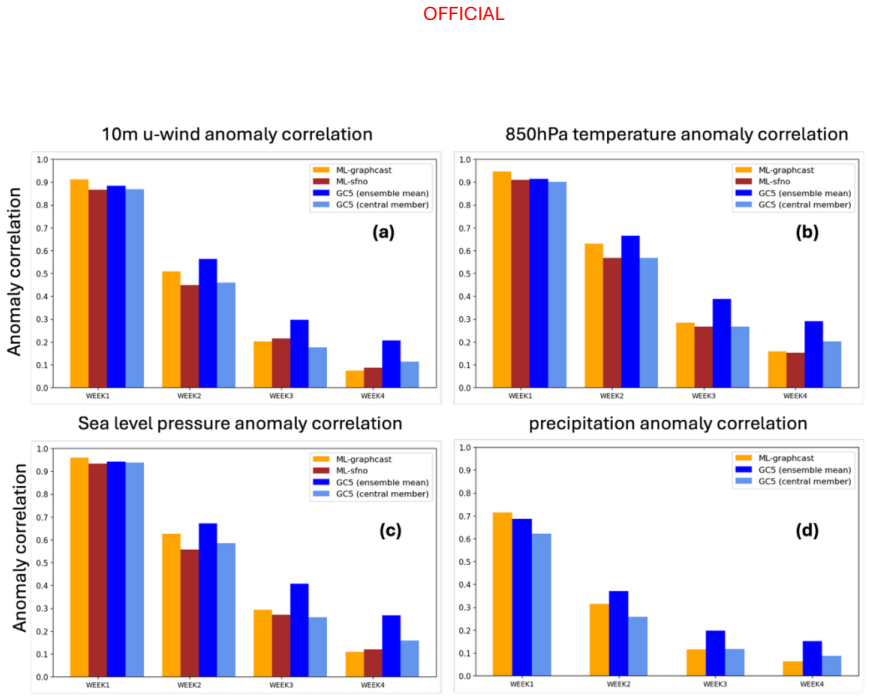
Across the two evaluation periods, both ML models have surprisingly good skill for sub-seasonal timescales, given they were designed for forecasting on medium range timescales. In general, the ML models are as skilful as the physical model ensemble mean at shorter lead times and comparable to the physical model ensemble members at longer lead times.
What carries the argument
Dual hindcast evaluation that pairs a long overlapping period with a short independent period to compare ML deterministic and probabilistic skill against physics ensemble means and members.
If this is right
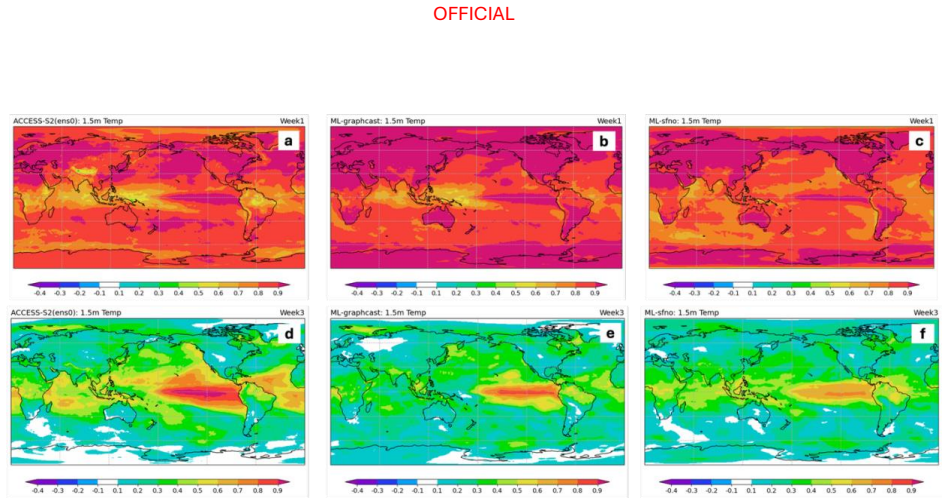
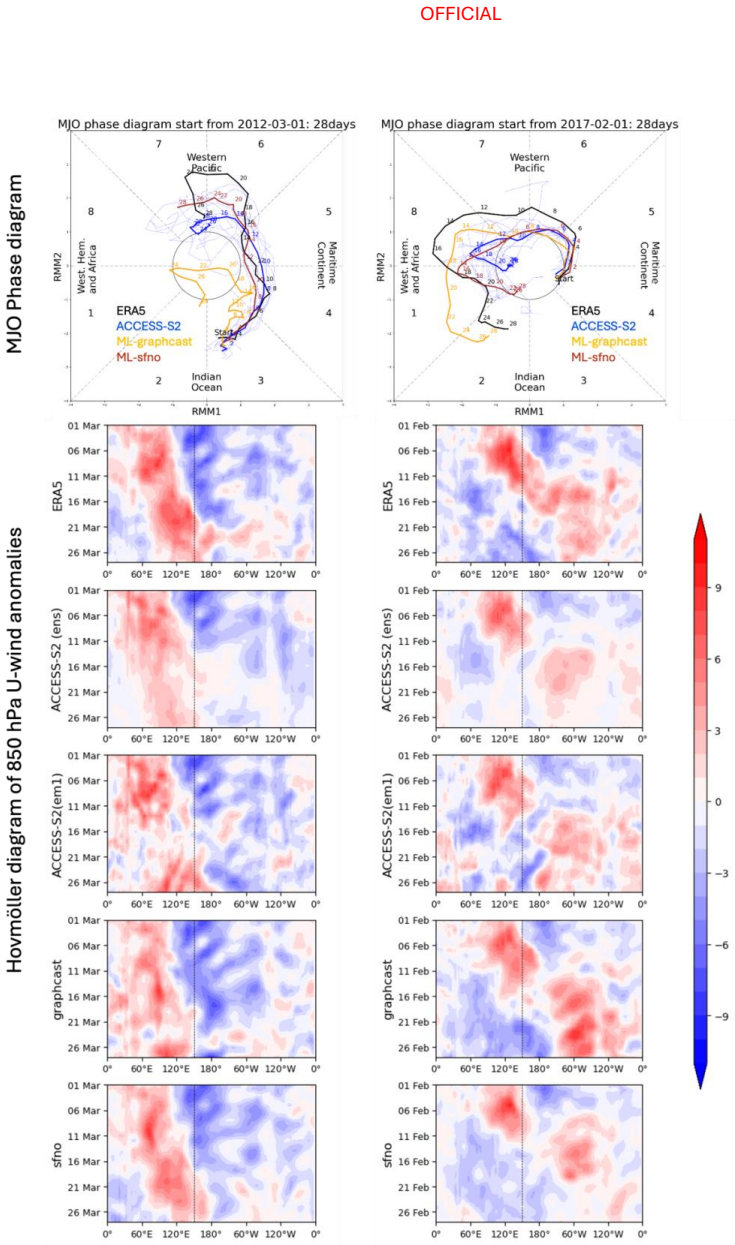
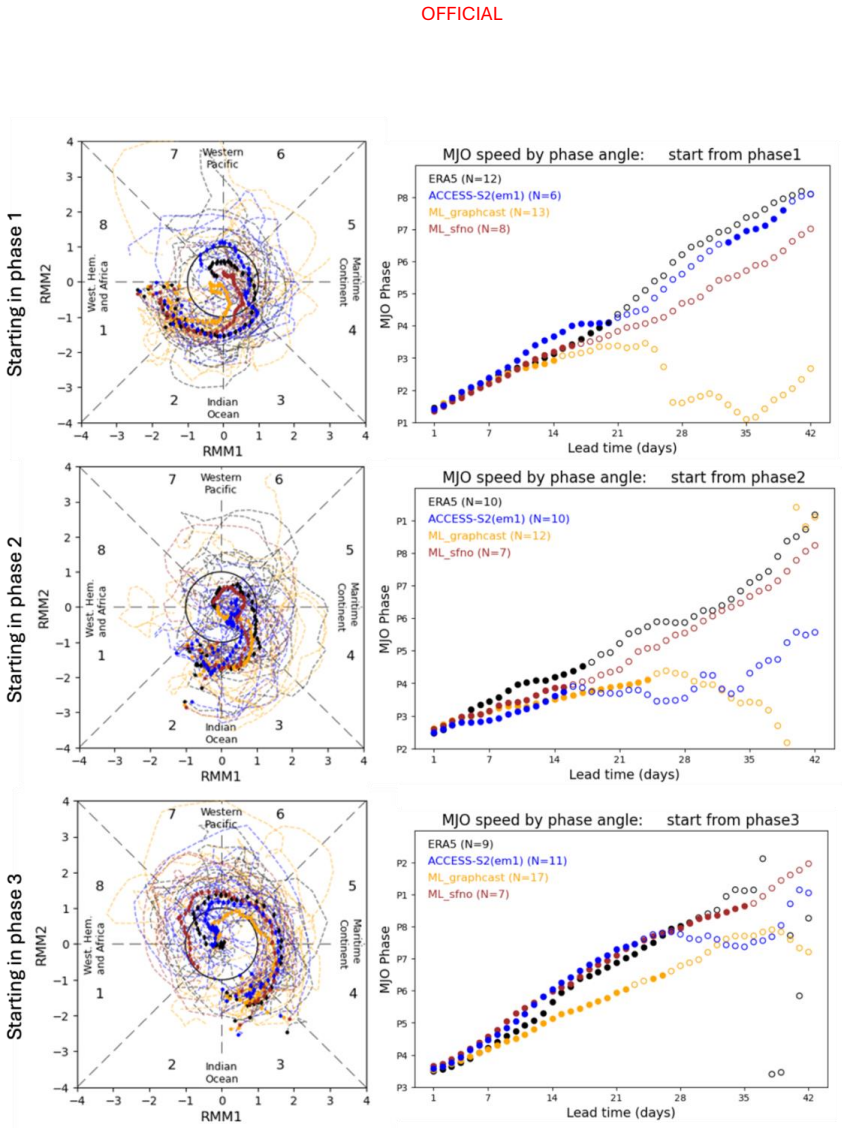
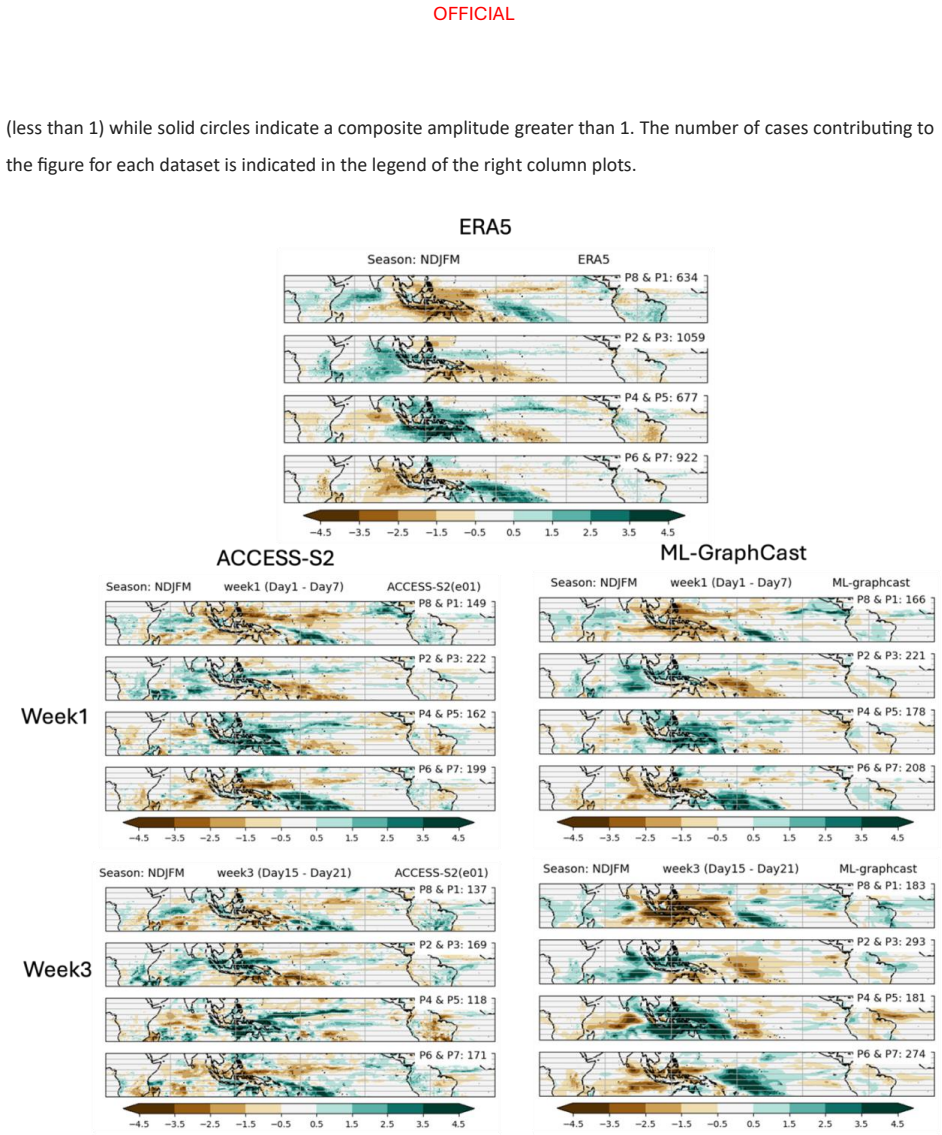
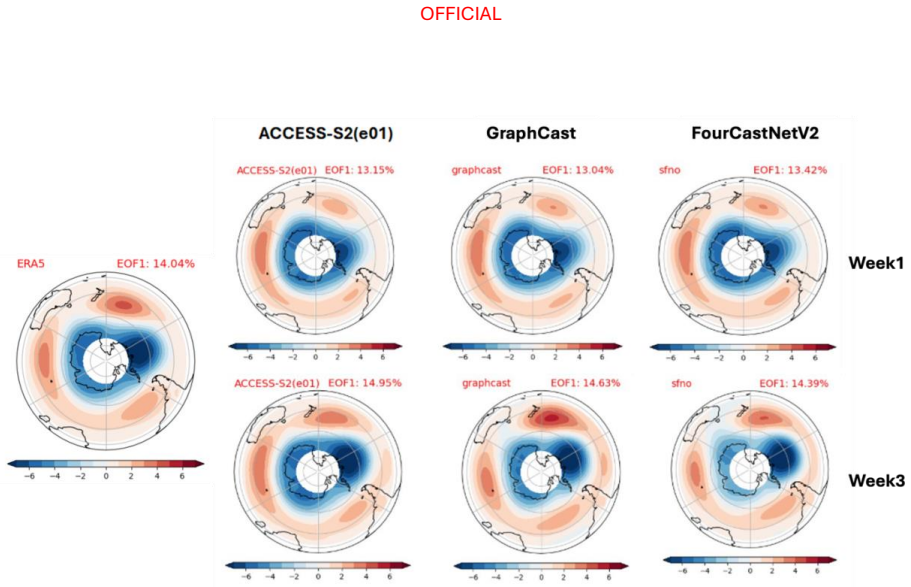
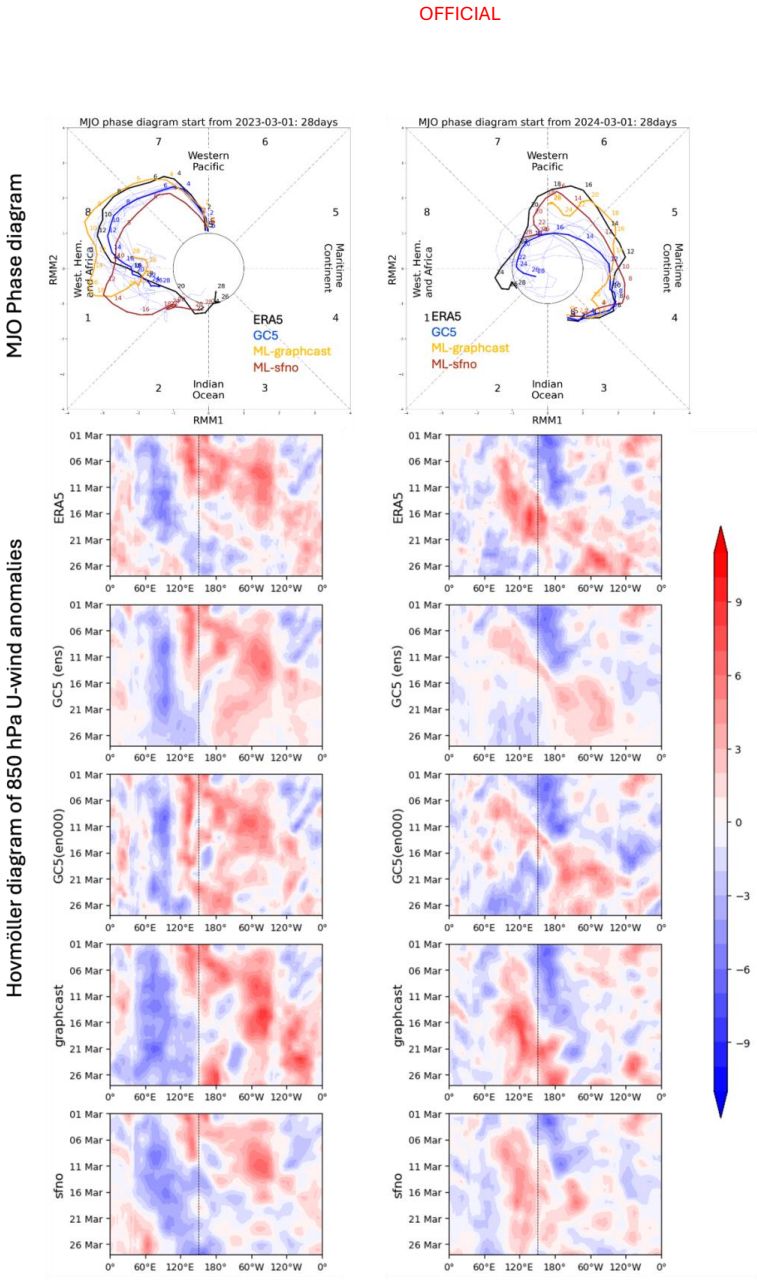
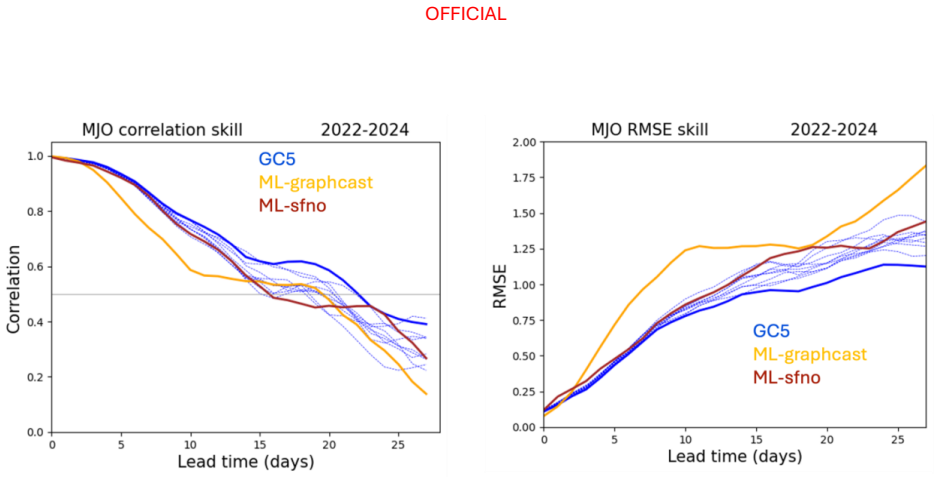
- The ML models capture the MJO and SAM with skill levels similar to the physics models.
- The overlapping-plus-independent period method provides a workable compromise for skill assessment when fully independent data are scarce.
- At longer leads the ML models behave like individual ensemble members rather than the ensemble mean.
- Operational sub-seasonal systems could add ML components at selected leads without immediate loss of overall skill.
Where Pith is reading between the lines
- If the result holds on additional independent data, ML models could lower the cost of running large sub-seasonal ensembles.
- The finding suggests medium-range ML training may transfer to longer leads without retraining from scratch.
- The same models could be tested for seasonal prediction or additional climate drivers as a direct next step.
- Hybrid ML-physics systems for sub-seasonal forecasting become a natural follow-on question.
Load-bearing premise
That skill measured partly on periods overlapping the models' training data still indicates real forecasting ability rather than memorization of seen cases.
What would settle it
A fresh multi-year independent hindcast set in which the ML models produce skill scores clearly below the physics ensemble mean at all sub-seasonal lead times would falsify the central claim.
Figures
read the original abstract
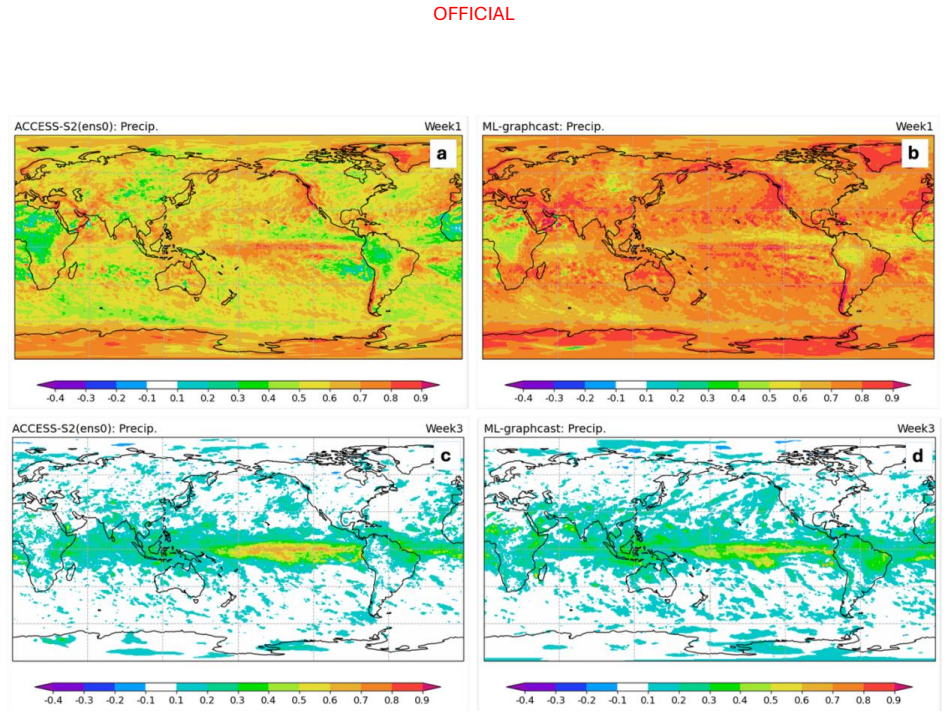
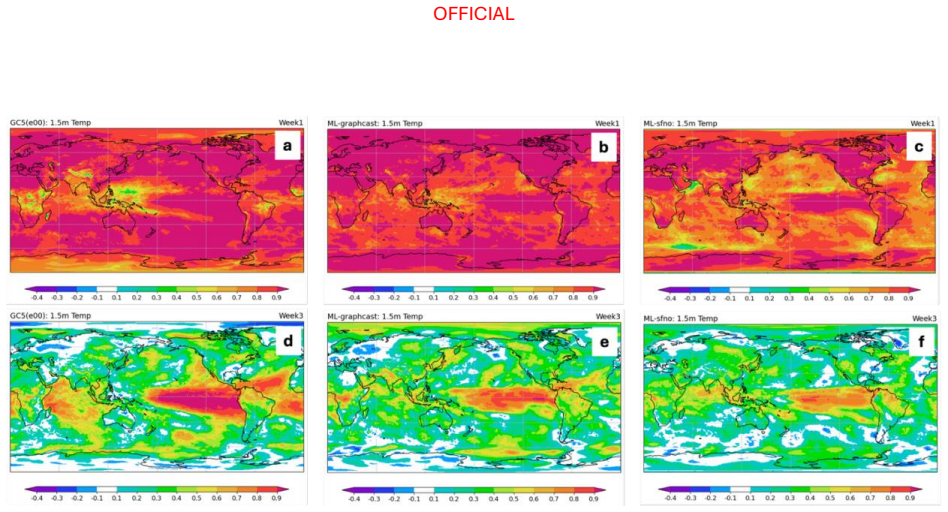
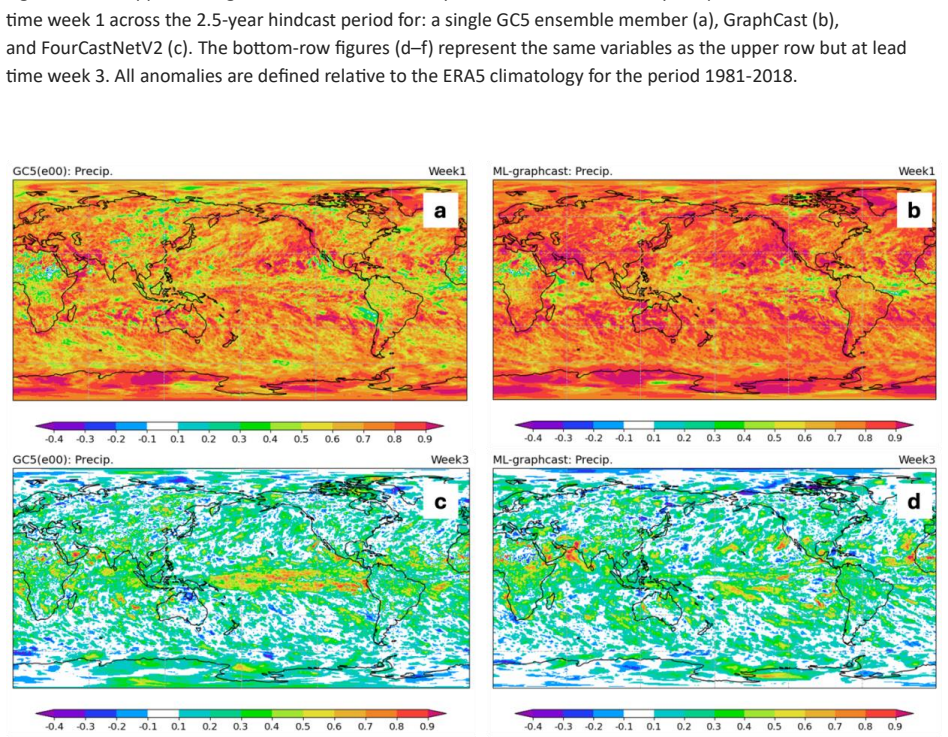
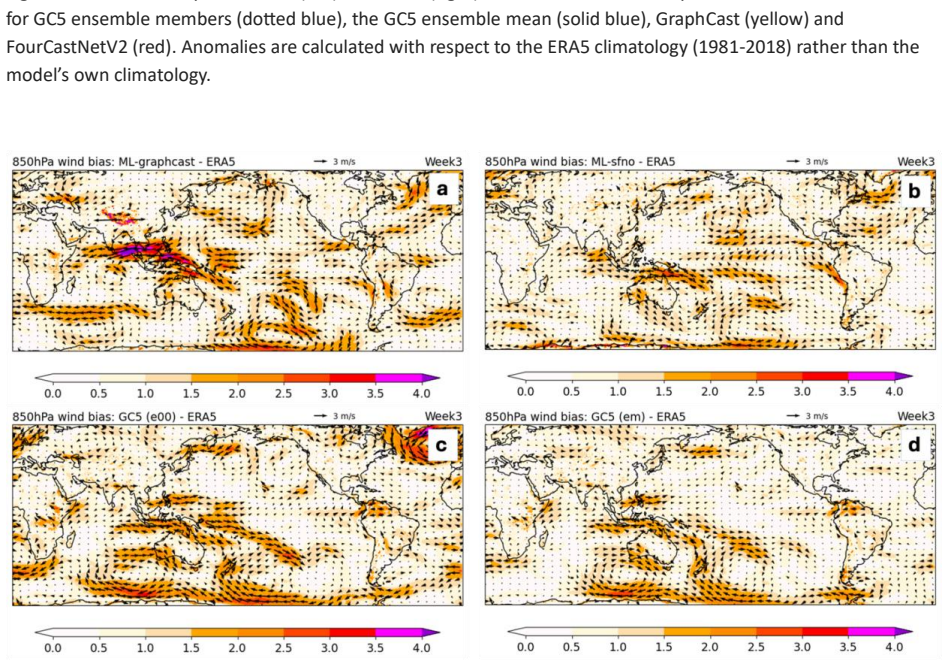
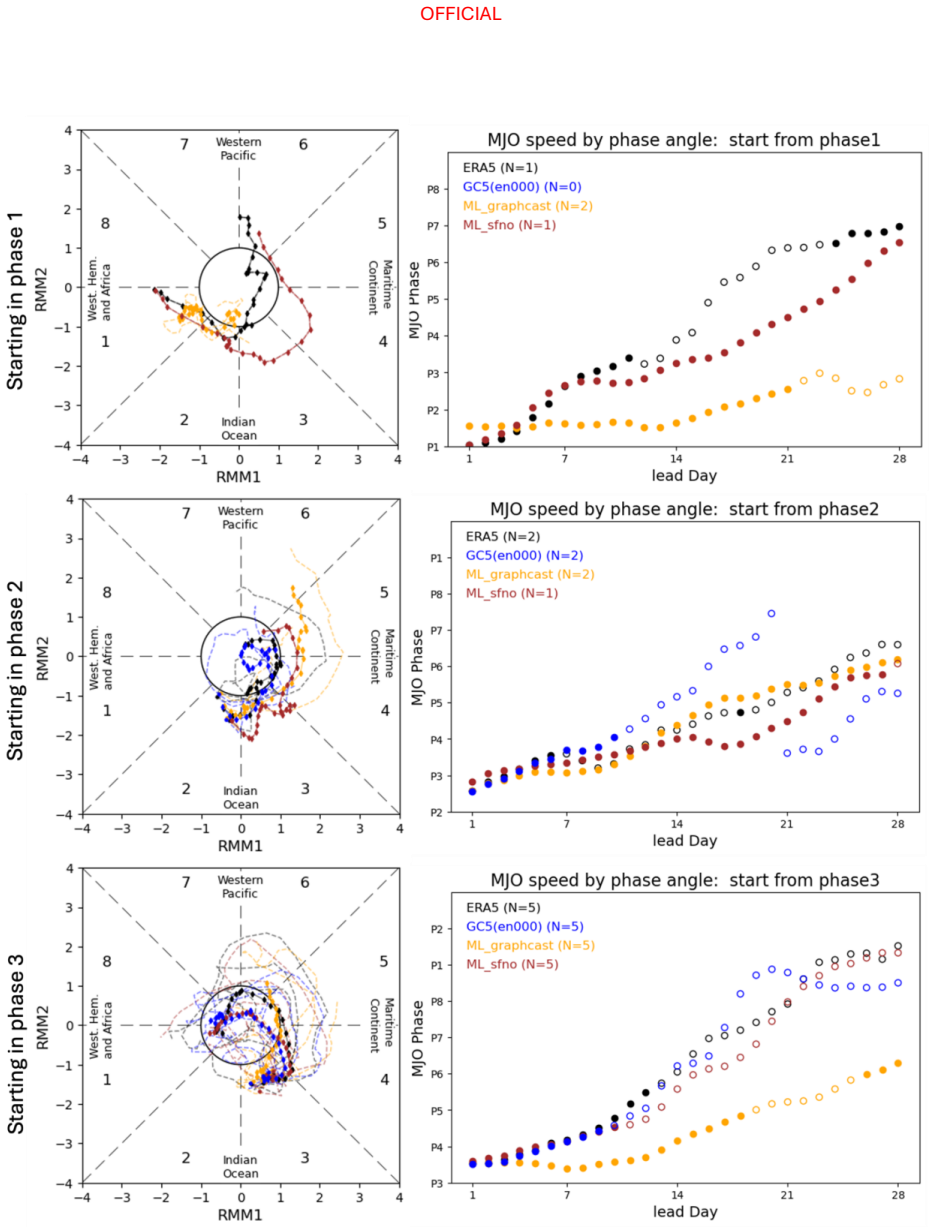
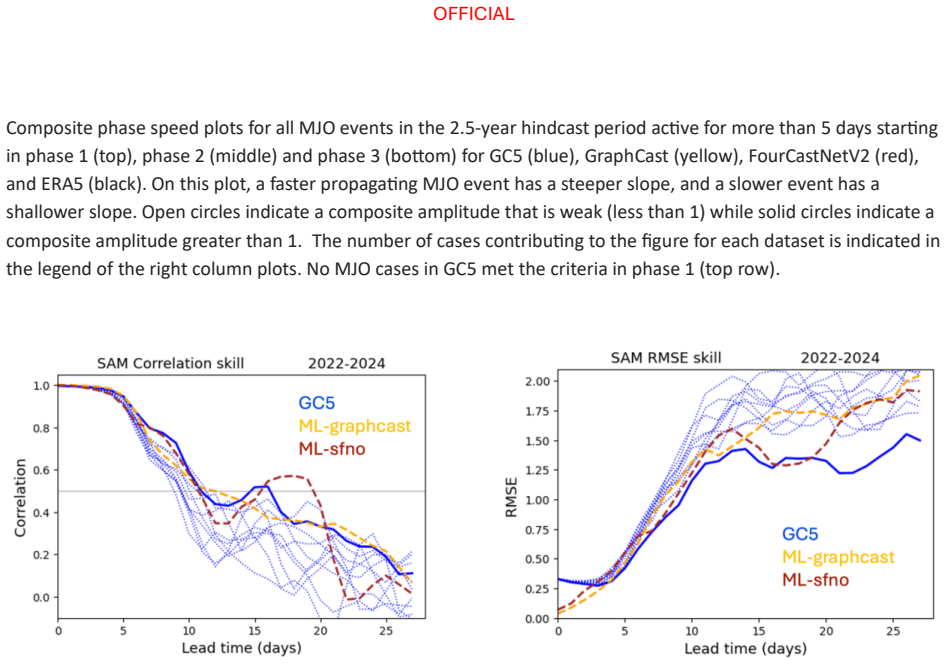
The performance of two machine learning (ML) atmosphere models - GraphCast and FourCastNetV2 - is evaluated in the context of sub-seasonal prediction, including their ability to represent key climate drivers of variability, namely the Madden-Julian Oscillation and the Southern Annular Mode. Model skill is assessed over both a 38-year hindcast period and a 2.5-year hindcast period. The longer period overlaps with the training windows of the ML models but provides a larger sample for robust evaluation, while the shorter period is independent of the ML model training period. This dual evaluation illustrates a compromise approach to the problem of insufficient independent data for evaluation of the models for sub-seasonal prediction. The ML models are compared against the Bureau of Meteorology's physics-based seasonal prediction system, ACCESS-S2, for the 38-year period, and a more recent physics-based coupled model for the shorter hindcast period. Across the two evaluation periods, both ML models have surprisingly good skill for sub-seasonal timescales, given they were designed for forecasting on medium range timescales. In general, the ML models are as skilful as the physical model ensemble mean at shorter lead times and comparable to the physical model ensemble members at longer lead times.
Editorial analysis
A structured set of objections, weighed in public.
Referee Report
Summary. The manuscript evaluates GraphCast and FourCastNetV2 for sub-seasonal prediction skill, including their representation of the MJO and SAM. It employs a dual hindcast strategy: a 38-year period overlapping the ML training windows and a 2.5-year independent period. The ML models are compared to ACCESS-S2 (38-year) and a more recent coupled physics model (2.5-year). The central claim is that both ML models exhibit surprisingly good sub-seasonal skill, performing comparably to the physical ensemble mean at shorter leads and to individual ensemble members at longer leads.
Significance. If the skill comparisons hold after addressing overlap and sample-size concerns, the result would indicate that medium-range ML models can usefully extend to sub-seasonal regimes without retraining, which is relevant for operational forecasting systems seeking to augment or replace physics-based ensembles.
major comments (2)
- [Abstract] Abstract: The headline claim that the ML models show 'surprisingly good skill' and are 'as skilful as the physical model ensemble mean at shorter lead times' rests on the 38-year hindcast, yet this period overlaps the GraphCast/FourCastNetV2 training windows. Without explicit verification that the reported metrics (e.g., anomaly correlation or RMSE at 2–6 week leads) remain unchanged when restricted to the independent 2.5-year window, the comparison risks reflecting training-data leakage rather than generalization to sub-seasonal regimes.
- [Abstract] Abstract and methods (dual-evaluation description): The 2.5-year independent period supplies only ~130 weekly cases. At sub-seasonal leads this yields limited degrees of freedom for distinguishing skill from sampling variability, especially when comparing against ensemble members whose spread is itself a source of uncertainty. No power analysis or bootstrap confidence intervals on the skill differences are mentioned, weakening support for the 'comparable to ensemble members at longer lead times' statement.
minor comments (1)
- [Abstract] The abstract refers to 'a more recent physics-based coupled model' for the shorter period without naming it; this should be identified in the abstract or first paragraph of the introduction for clarity.
Simulated Author's Rebuttal
We thank the referee for their constructive and detailed comments. We address each major comment below and describe the revisions we will make to strengthen the statistical rigor and clarity of the evaluation.
read point-by-point responses
-
Referee: [Abstract] Abstract: The headline claim that the ML models show 'surprisingly good skill' and are 'as skilful as the physical model ensemble mean at shorter lead times' rests on the 38-year hindcast, yet this period overlaps the GraphCast/FourCastNetV2 training windows. Without explicit verification that the reported metrics (e.g., anomaly correlation or RMSE at 2–6 week leads) remain unchanged when restricted to the independent 2.5-year window, the comparison risks reflecting training-data leakage rather than generalization to sub-seasonal regimes.
Authors: We agree that the overlap between the 38-year hindcast and the ML training windows is a legitimate concern for interpreting generalization. The manuscript already introduces the dual-evaluation design specifically to address this, stating that the 2.5-year period is independent and that results hold 'across the two evaluation periods.' However, the referee is correct that the abstract does not explicitly demonstrate that the headline skill comparisons are reproduced in the independent window. We will therefore revise the abstract to qualify the claims more precisely and add a new results subsection (with accompanying figure) that reports anomaly correlation and RMSE for the 2–6 week leads restricted to the 2.5-year independent period, allowing direct comparison with the 38-year results. revision: yes
-
Referee: [Abstract] Abstract and methods (dual-evaluation description): The 2.5-year independent period supplies only ~130 weekly cases. At sub-seasonal leads this yields limited degrees of freedom for distinguishing skill from sampling variability, especially when comparing against ensemble members whose spread is itself a source of uncertainty. No power analysis or bootstrap confidence intervals on the skill differences are mentioned, weakening support for the 'comparable to ensemble members at longer lead times' statement.
Authors: We concur that ~130 cases provide limited statistical power at sub-seasonal leads and that ensemble spread adds further uncertainty to the comparisons. The manuscript presents the 2.5-year period as an independent check despite its small size, but we did not quantify sampling uncertainty. In revision we will add bootstrap confidence intervals (resampling over the 130 cases) to all skill-score differences shown for the 2.5-year period. We will also expand the discussion to note the additional uncertainty arising from ensemble spread. A formal a-priori power analysis is difficult without pre-specified effect sizes, but the bootstrap intervals will allow readers to assess the robustness of the 'comparable to ensemble members' statements. revision: yes
Circularity Check
No circularity: purely empirical model evaluation against external benchmarks
full rationale
The paper performs direct skill comparisons of GraphCast and FourCastNetV2 against ACCESS-S2 and another physics model over two hindcast periods. No derivations, equations, fitted parameters, or self-citation chains appear in the central claims. The dual-period evaluation is presented as an explicit compromise for data limitations rather than a derivation that reduces to its inputs. All reported skill metrics are computed from independent verification data against external physical-model references, satisfying the self-contained criterion.
Axiom & Free-Parameter Ledger
Reference graph
Works this paper leans on
-
[1]
Alet, F., Price, I., El-Kadi, A., Masters, D., Markou, S., Andersson, T. R., ... & Battaglia, P. (2025). Skillful joint probabilistic weather forecasting from marginals. arXiv preprint arXiv:2506.10772. Antonio, B., Strommen, K., & Christensen, H. M. (2025). Seasonal forecasting using the GenCast probabilistic machine learning model. arXiv preprint arXiv:...
arXiv 2025
-
[2]
An Image is Worth 16x16 Words: Transformers for Image Recognition at Scale
Cowan, T., Wheeler, M. C., & Marshall, A. G. (2023). The combined influence of the Madden–Julian Oscillation and El Niño–Southern Oscillation on Australian rainfall. Journal of Climate, 36(2), 313–334. https://doi.org/10.1175/JCLI-D-22-0357.1[1] DeMaria, M., Franklin, J. L., Chirokova, G., Radford, J., DeMaria, R., Musgrave, K. D., & Ebert-Uphoff, I. (202...
work page internal anchor Pith review Pith/arXiv arXiv doi:10.1175/jcli-d-22-0357.1 2023
-
[3]
Dunstan, T., Strickson, O., Bennett, T., Bowyer, J., Burnand, M., Chappell, J., ... & Hosking, J. S. (2025). FastNet: Improving the physical consistency of machine-learning weather prediction models through loss function design. arXiv preprint arXiv:2509.17601. Gillett NP, Kell TD, Jones PD (2006) Regional climate impacts of the southern annular mode. Geo...
-
[4]
Hersbach, H., Bell, B., Berrisford, P., Hirahara, S., Horányi, A., Muñoz‐Sabater, J., ... & Thépaut, J. N. (2020). The ERA5 global reanalysis. Quarterly Journal of the Royal Meteorological Society, 146(730), 1999-2049. Hudson, D., Alves, O., Hendon, H.H., et al. 2017: ACCESS-S1: The new Bureau of Meteorology multi- week to seasonal prediction system. Jour...
-
[5]
Lang, S., Alexe, M., Chantry, M., Dramsch, J., Pinault, F., Raoult, B., ... & Rabier, F. (2024a). AIFS- ECMWF's data-driven forecasting system. arXiv preprint arXiv:2406.01465. OFFICIAL OFFICIAL Lang, S., Alexe, M., Clare, M. C., Roberts, C., Adewoyin, R., Bouallègue, Z. B., ... & Leutbecher, M. (2024b). AIFS-CRPS: Ensemble forecasting using a model train...
discussion (0)
Sign in with ORCID, Apple, or X to comment. Anyone can read and Pith papers without signing in.