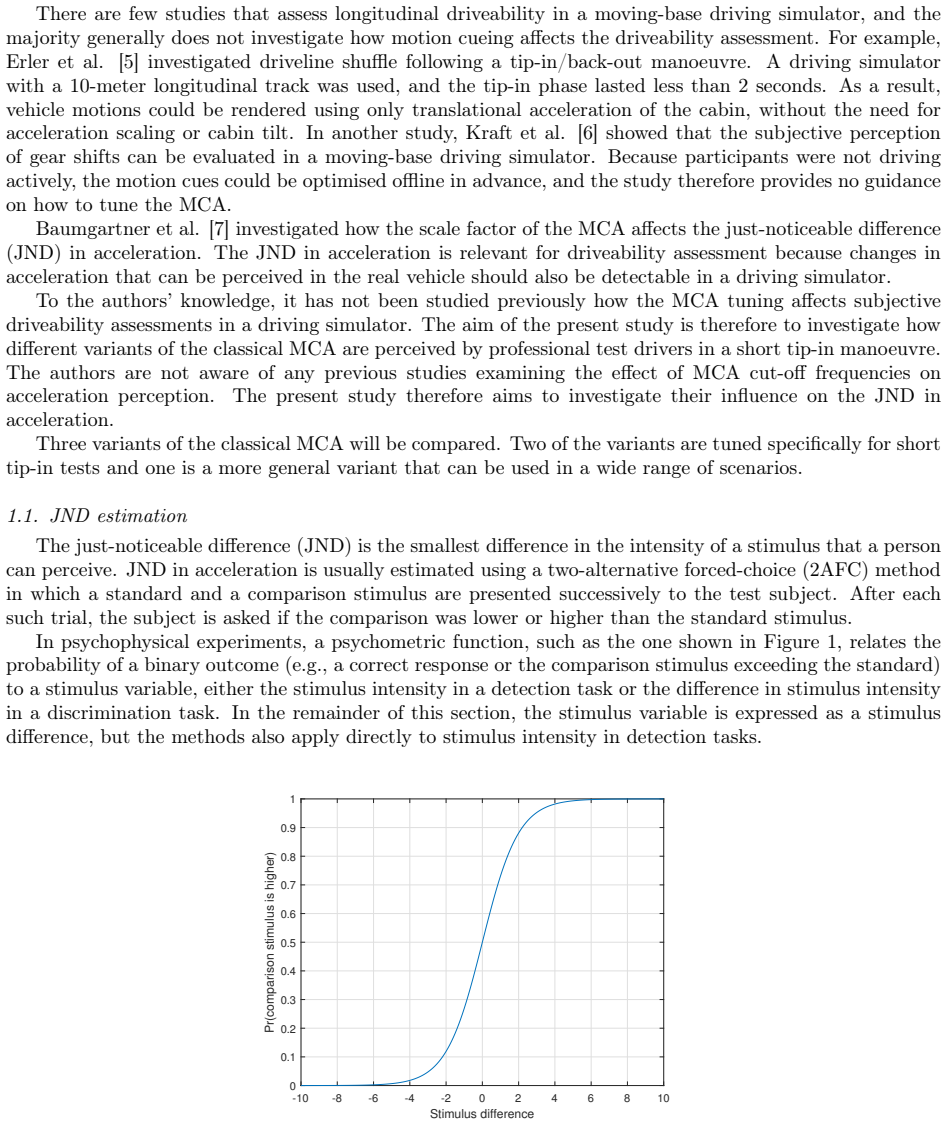
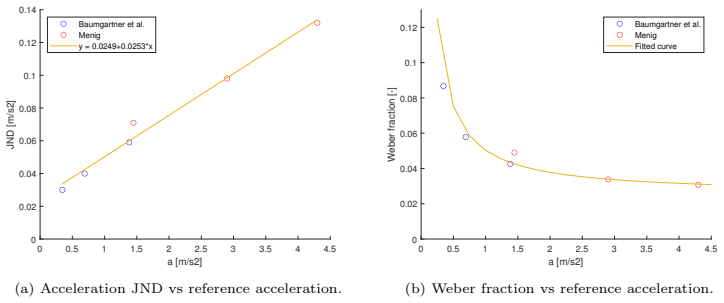
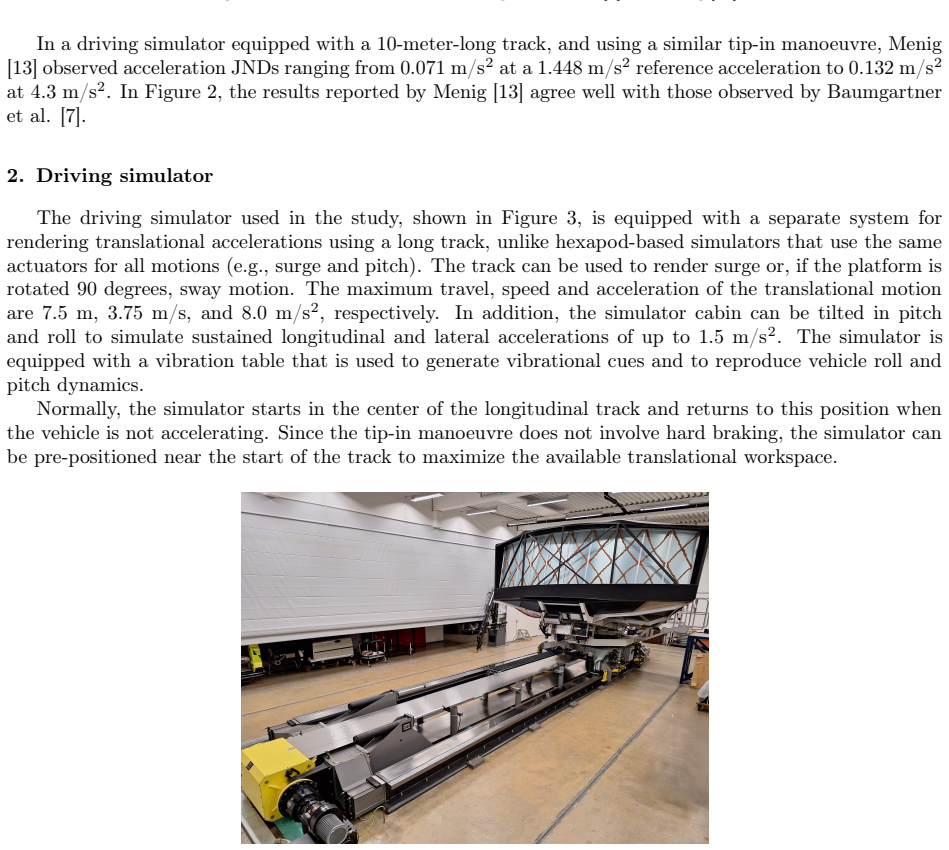
Effects of motion cueing on longitudinal acceleration perception in a driving simulator
Pith reviewed 2026-06-29 03:08 UTC · model grok-4.3
The pith
Different motion cueing algorithms show no significant effect on the just-noticeable difference for longitudinal acceleration in driving simulators.
A machine-rendered reading of the paper's core claim, the machinery that carries it, and where it could break.
Core claim
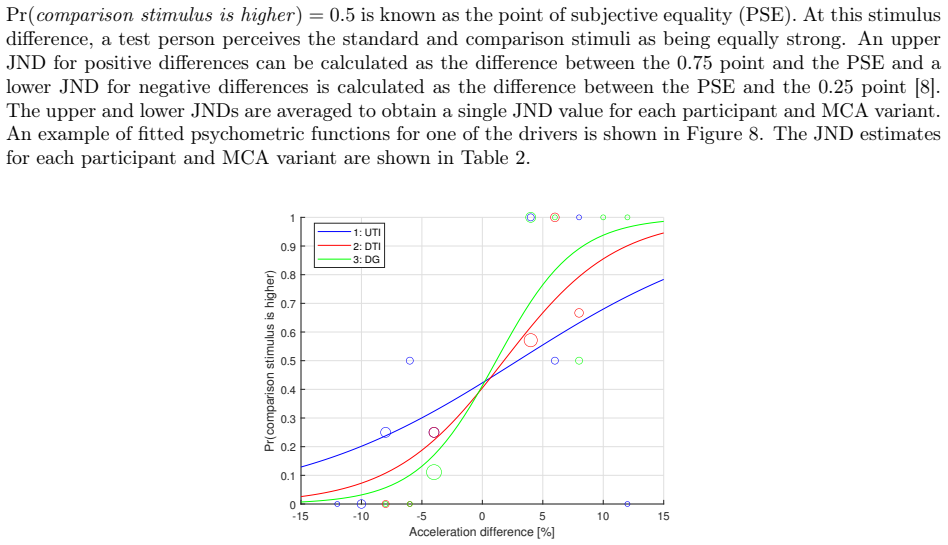
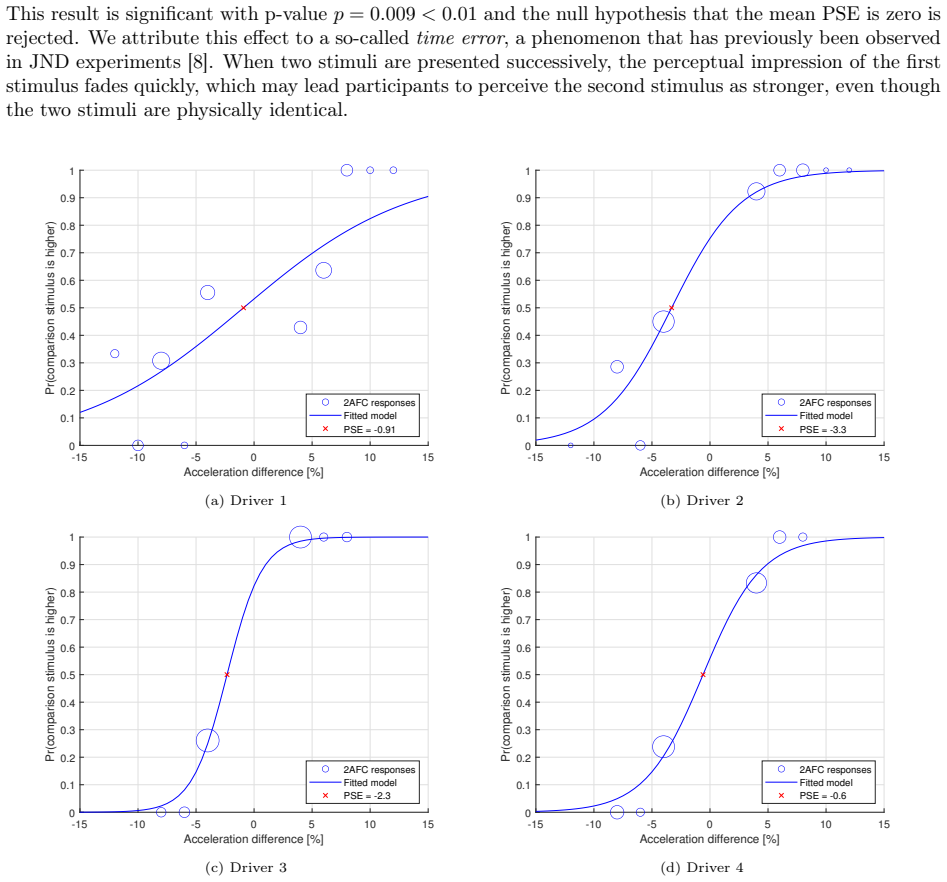
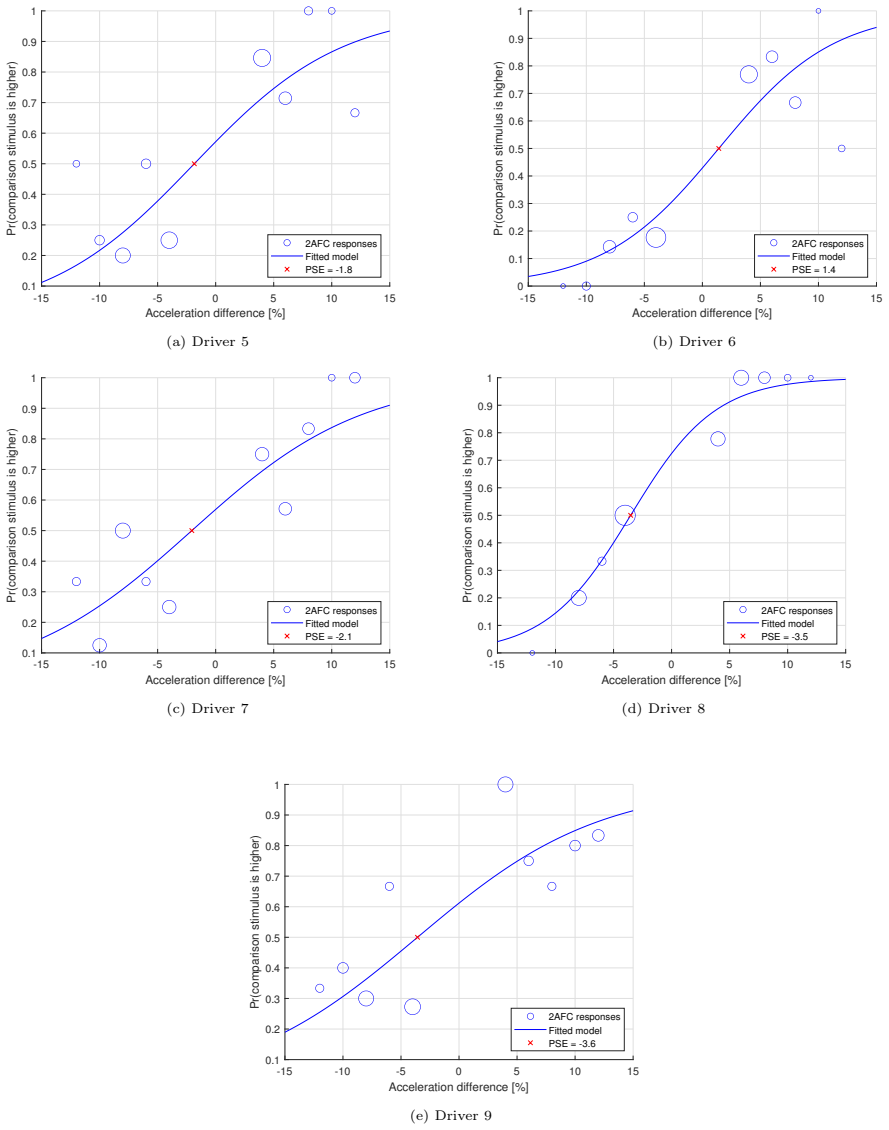
No significant differences in JND were found between the motion cueing variants. The mean JND across all participants and MCA variants was 5.4%. The mean point of subjective equality was -1.9%, indicating participants perceived the acceleration as higher in the second stimulus of a pair. In subjective comparison, most participants preferred the motion cueing variants tuned for launch manoeuvres.
What carries the argument
The weighted staircase procedure with GLM-fitted psychometric functions to determine JND for different MCA variants tuned for tip-in/launch tests versus a general variant.
If this is right
- Virtual prototypes in simulators can assess driveability based on small acceleration differences.
- The 5.4% mean JND sets a benchmark for detectable changes in longitudinal acceleration.
- Subjective preference favors MCA variants tuned specifically for launch manoeuvres.
- The negative PSE suggests a potential order bias in paired stimulus comparisons.
Where Pith is reading between the lines
- Simulator designs might need to account for the observed perceptual bias in sequential presentations.
- This JND level could be compared to real vehicle tests to validate simulator fidelity.
- Future work could test if lower JND is achievable with other cueing methods or hardware.
Load-bearing premise
The weighted staircase procedure combined with GLM-fitted psychometric functions isolates true perceptual thresholds without systematic bias from simulator motion artifacts, participant adaptation, or MCA tuning choices.
What would settle it
A direct comparison showing significantly different JND values when the same procedure is applied in a real vehicle versus the simulator, or when using a different measurement method.
Figures
read the original abstract
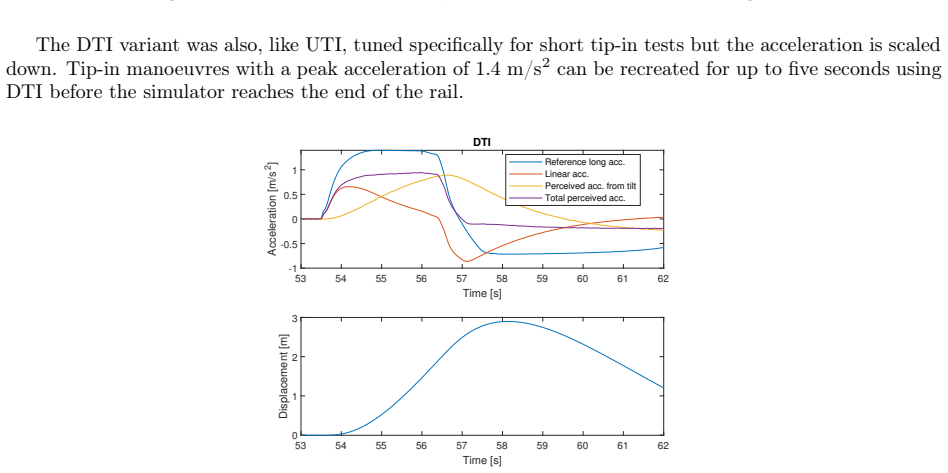
The driveability of a new heavy-truck driveline is traditionally assessed using physical prototypes. Enabling early evaluation of the driving experience in a human-in-the-loop driving simulator using a virtual prototype has the potential to significantly improve development efficiency. To enable driveability assessment using a moving-base simulator, participants must be able to perceive small differences in longitudinal acceleration. The just-noticeable difference (JND) was therefore evaluated for two variants of the classical motion-cueing algorithm (MCA) tuned specifically for tip-in/launch tests and compared to a more general variant in a driving simulator with a long linear track. Psychometric functions were fitted to responses obtained using a weighted staircase procedure and analysed using a generalized linear model. No significant differences in JND were found between the motion cueing variants. The mean JND across all participants and MCA variants was 5.4%. The mean point of subjective equality in the JND experiment was -1.9%, suggesting that participants perceived the acceleration as higher in the second stimulus of a pair. In a subjective comparison, most participants preferred the motion cueing variants that were tuned for launch manoeuvres over the general variant.
Editorial analysis
A structured set of objections, weighed in public.
Referee Report
Summary. The paper evaluates just-noticeable differences (JND) in longitudinal acceleration perception for heavy-truck driveline assessment in a moving-base driving simulator with a long linear track. It compares two motion-cueing algorithm (MCA) variants tuned for tip-in/launch maneuvers against a general MCA variant using a weighted staircase procedure to collect responses, followed by GLM fitting of psychometric functions. The central empirical result is that no significant JND differences were found across MCA variants, with a mean JND of 5.4% across participants; a mean PSE of -1.9% is also reported, and participants subjectively preferred the tuned variants.
Significance. If the empirical result holds, the work provides a useful benchmark (JND ≈ 5.4%) for perceptual thresholds in simulator-based driveability evaluation, supporting earlier virtual-prototype assessment of heavy-truck drivelines and potentially reducing reliance on physical prototypes. The use of standard psychophysical tools (weighted staircase + GLM psychometric fitting) is a methodological strength that aligns with conventional practice for 2AFC discrimination tasks.
major comments (3)
- [Methods] Methods: The number of participants and any power analysis or exclusion criteria are not reported. This information is required to evaluate the statistical power supporting the claim of no significant JND differences across MCA variants.
- [Methods] Methods: Exact MCA tuning parameters (e.g., specific gains or filters for tip-in/launch) are not provided. Without these, the claim that the tuned variants produce equivalent perceptual thresholds cannot be reproduced or assessed for sensitivity to the chosen tuning.
- [Results] Results: Error-bar details, exact p-values or test statistics for the no-difference result, and how the GLM handled the reported PSE bias are not specified. These omissions leave the central no-difference claim under-supported.
minor comments (1)
- [Methods] The abstract states the GLM was applied to paired responses, but the precise link function and how constant bias was absorbed into the location parameter should be stated explicitly for clarity.
Simulated Author's Rebuttal
We thank the referee for their constructive feedback on our manuscript. We address each of the major comments below and will update the manuscript to incorporate the suggested improvements.
read point-by-point responses
-
Referee: [Methods] Methods: The number of participants and any power analysis or exclusion criteria are not reported. This information is required to evaluate the statistical power supporting the claim of no significant JND differences across MCA variants.
Authors: We agree with the referee that this information is crucial for assessing the robustness of our findings. The revised version of the manuscript will include the number of participants, details on any power analysis conducted, and the exclusion criteria used in the study. revision: yes
-
Referee: [Methods] Methods: Exact MCA tuning parameters (e.g., specific gains or filters for tip-in/launch) are not provided. Without these, the claim that the tuned variants produce equivalent perceptual thresholds cannot be reproduced or assessed for sensitivity to the chosen tuning.
Authors: We concur that providing the exact tuning parameters is necessary for reproducibility. In the revised manuscript, we will supply the specific gains, filter coefficients, and other parameters used in the tuned MCA variants for the tip-in/launch maneuvers. revision: yes
-
Referee: [Results] Results: Error-bar details, exact p-values or test statistics for the no-difference result, and how the GLM handled the reported PSE bias are not specified. These omissions leave the central no-difference claim under-supported.
Authors: We appreciate this observation. The revised Results section will provide detailed information on error bars, the exact p-values and test statistics from the GLM analysis, and an explanation of how the model accounted for the observed PSE bias of -1.9%. This will strengthen the support for the no-difference claim. revision: yes
Circularity Check
No circularity: purely empirical measurement study
full rationale
This is an experimental psychophysics paper that collects human response data via weighted staircase procedure in a driving simulator and fits psychometric functions with GLM. No derivations, first-principles predictions, fitted parameters renamed as independent results, or load-bearing self-citations appear. The central claim (no significant JND difference across MCA variants, mean 5.4%) is a direct statistical outcome of the collected responses and standard analysis; it does not reduce to any input by construction. The method is conventional and externally falsifiable.
Axiom & Free-Parameter Ledger
free parameters (1)
- MCA tuning parameters for tip-in/launch
axioms (1)
- standard math Responses from weighted staircase procedure can be modeled by psychometric functions fitted via generalized linear model
Reference graph
Works this paper leans on
-
[1]
R. A. Krenz, Vehicle response to throttle tip-in/tip-out, 1985. doi:10.4271/850967
-
[2]
S. Kim, J. Yang, Toward better drivability: Investigating user preferences for tip-in acceleration profiles in electric vehicles, PLoS ONE 19 (12 2024). doi:10.1371/journal.pone.0311504
-
[3]
C. Dorsch, X. Wang, F. Küçükay, Objective rating of the launch behavior of conventional, hybrid and electric vehicles, Automotive Innovation 4 (2021) 70–80. doi:10.1007/s42154-020-00131-z
-
[4]
L. D. Reid, M. A. Nahon, Flight simulation motion-base drive algorithms: Part 1 - Developing and testing the equations, 1985
1985
-
[5]
P. Erler, A. Menig, F. Uphaus, C. A. M. Makosi, S. Rinderknecht, J. Vogt, Investigating the percep- tion of powertrain shuffle with a longitudinal dynamic driving simulator, IEEE, 2018, pp. 1427–1431. doi:10.1109/AIM.2018.8452255
-
[6]
E. Kraft, A. Viehmann, P. Erler, S. Rinderknecht, Virtual driving tests of powertrain systems in the driving simulator, ATZ worldwide 123 (2021) 40–45. doi:10.1007/s38311-020-0624-z
-
[7]
E. Baumgartner, A. Ronellenfitsch, H. C. Reuss, D. Schramm, A perceptual approach for evaluating vehicle drivability in a dynamic driving simulator, Transportation Research Part F: Traffic Psychology and Behaviour 63 (2019) 83–92. doi:10.1016/j.trf.2019.03.013
-
[8]
G. A. Gescheider, Psychophysics: the fundamentals, Psychology Press, 2013
2013
-
[9]
M. R. Leek, Adaptive procedures in psychophysical research, Perception & Psychophysics 63 (2001) 1279–1292. doi:10.3758/BF03194543
-
[10]
C. Kaernbach, Simple adaptive testing with the weighted up-down method, Perception & Psychophysics 49 (1991) 227–229. doi:10.3758/BF03214307
-
[11]
T. Müller, H. Hajek, L. Radić-Weißenfeld, K. Bengler, Can you feel the difference? the just noticeable difference of longitudinal acceleration, in: Proceedings of the Human Factors and Ergonomics Society, 2013, pp. 1219–1223. doi:10.1177/1541931213571271
-
[12]
A. R. Naseri, P. R. Grant, Human discrimination of translational accelerations, Experimental Brain Research 218 (2012) 455–464. doi:10.1007/s00221-012-3035-6
-
[13]
Menig, Der eben merkliche unterschied von längsbeschleunigung im fahrsimulator–experimentelle analysen unter berücksichtigung verschiedener einflussfaktoren, Ph.D
A. Menig, Der eben merkliche unterschied von längsbeschleunigung im fahrsimulator–experimentelle analysen unter berücksichtigung verschiedener einflussfaktoren, Ph.D. thesis (2025)
2025
-
[14]
E. L. Groen, W. Bles, How to use body tilt for the simulation of linear self motion, Journal of Vestibular Research 14 (5) (2004) 375–385
2004
-
[15]
B. Keshavarz, H. Hecht, Validating an efficient method to quantify motion sickness, Hu- man Factors: The Journal of the Human Factors and Ergonomics Society 53 (2011) 415–426. doi:10.1177/0018720811403736. 15
-
[16]
G. B. Wetherill, H. Chen, R. B. Vasudeva, Sequential estimation of quantal response curves: A new method of estimation, Biometrika 53 (1966) 439. doi:10.2307/2333650
-
[17]
J. L. Hall, Hybrid adaptive procedure for estimation of psychometric functions, The Journal of the Acoustical Society of America 69 (6) (1981) 1763–1769
1981
-
[18]
M. A. Garcıa-Pérez, Forced-choice staircases with fixed step sizes: asymptotic and small-sample prop- erties, Vision research 38 (12) (1998) 1861–1881
1998
-
[19]
E. Baumgartner, A. Ronellenfitsch, H. C. Reuss, D. Schramm, Using a dynamic driving simulator for perception-based powertrain development, Transportation Research Part F: Traffic Psychology and Behaviour 61 (2019) 281–290. doi:10.1016/j.trf.2017.08.012. 16
discussion (0)
Sign in with ORCID, Apple, or X to comment. Anyone can read and Pith papers without signing in.