Automated Vector-Scanning Spectroscopy for Large-Scale Characterization of Single Quantum Emitters
Pith reviewed 2026-06-30 00:32 UTC · model grok-4.3
The pith
An automated platform combines wide-field imaging with vector-stage-scanning confocal spectroscopy to characterize thousands of single quantum dots on one chip.
A machine-rendered reading of the paper's core claim, the machinery that carries it, and where it could break.
Core claim
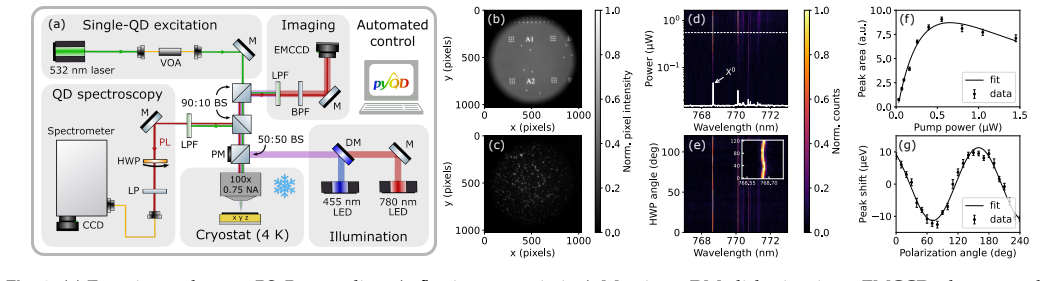
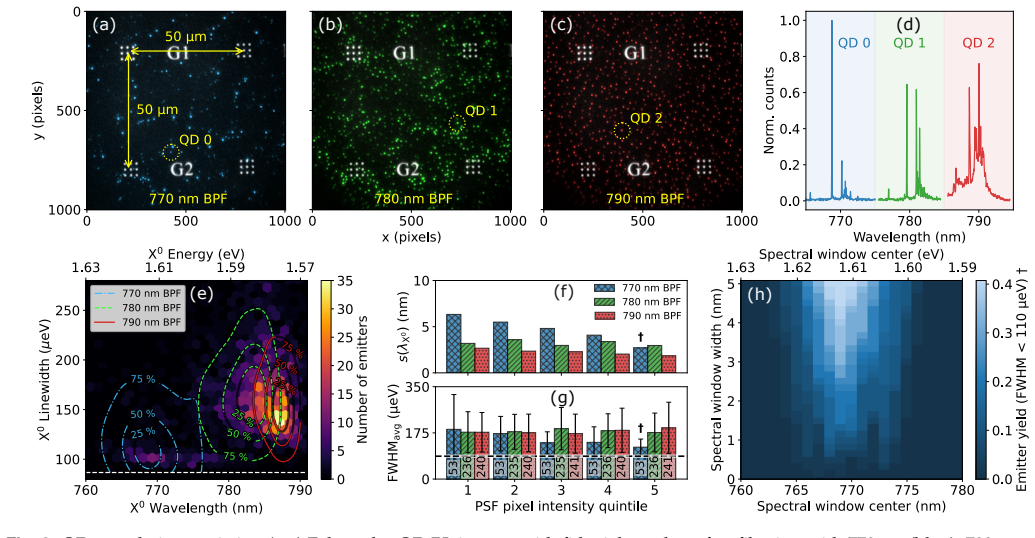
The platform unites wide-field photoluminescence imaging with vector-stage-scanning confocal spectroscopy inside a cryogenic environment, allowing automatic, targeted optical characterization of individual quantum dots at chip scale, as shown by the collection of photoluminescence data from thousands of GaAs/AlGaAs emitters on a single chip.
What carries the argument
Automated cryogenic measurement platform that pairs wide-field photoluminescence imaging with vector-stage-scanning confocal spectroscopy for targeted single-emitter measurements.
If this is right
- The collected spectra allow direct identification of high-performance emitters for deterministic nanophotonic device fabrication.
- Statistical trends extracted from thousands of dots become visible and can guide materials improvements.
- Data-efficient targeted measurements replace exhaustive manual scanning and scale to full-chip characterization.
- The same automation framework supports the high-throughput needs of large-scale quantum photonic integration.
Where Pith is reading between the lines
- The localization-plus-scanning sequence could be adapted to other classes of solid-state emitters whose positions are similarly random.
- Coupling the output list of selected emitters directly to lithography tools would close the loop between characterization and fabrication.
- Large statistical datasets on spectral heterogeneity could be used to test growth-parameter models that are currently under-constrained.
Load-bearing premise
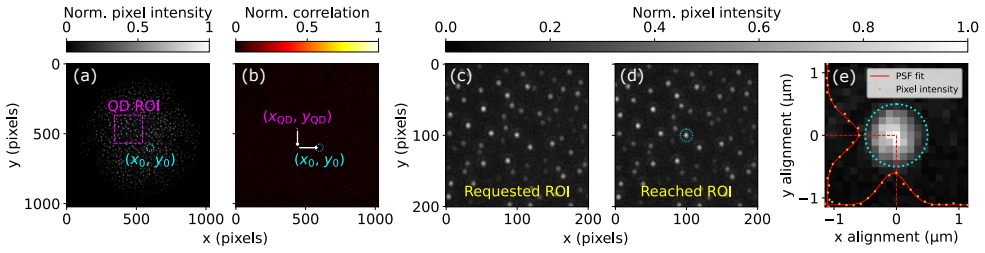
Wide-field imaging supplies localization accuracy high enough for the scanning confocal stage to isolate each quantum dot without crosstalk or positioning errors in a dense ensemble.
What would settle it
Frequent crosstalk signals or missed emitters when the system attempts to address dense clusters of quantum dots on the chip would show that localization accuracy is insufficient.
Figures
read the original abstract
The inherent spatial randomness and broad spectral heterogeneity of epitaxial quantum dots (QDs) -- one of the most mature classes of solid-state quantum emitters -- remains a major obstacle to their scalable deployment in integrated photonic quantum technologies. Overcoming this challenge requires deterministic fabrication strategies capable of precisely aligning nanophotonic structures with high-quality emitters, which in turn demands efficient and automated single-QD characterization. Despite substantial progress in optical measurement techniques, a platform capable of autonomous, data-efficient, and sufficiently versatile characterization of single quantum dots at the chip scale remains lacking. Here, we introduce an automated cryogenic measurement platform that combines wide-field photoluminescence imaging with vector-stage-scanning confocal spectroscopy to enable high-throughput, chip-scale targeted optical characterization of individual QDs. Using this platform, we automatically acquire photoluminescence data from thousands of GaAs/AlGaAs QDs on a single chip. We demonstrate how this extensive dataset enables identification of high-performance emitters for future deterministic device fabrication, while simultaneously revealing statistical trends across the QD ensemble. By uniting data-efficient targeted measurements with scalable automation, our platform establishes a foundation for large-scale quantum photonic integration and the high throughput characterization framework needed to accelerate materials optimization.
Editorial analysis
A structured set of objections, weighed in public.
Referee Report
Summary. The manuscript introduces an automated cryogenic measurement platform that combines wide-field photoluminescence imaging with vector-stage-scanning confocal spectroscopy to enable high-throughput, chip-scale targeted optical characterization of individual quantum dots (QDs). It claims to automatically acquire photoluminescence data from thousands of GaAs/AlGaAs QDs on a single chip, enabling identification of high-performance emitters for deterministic device fabrication and revealing statistical trends across the QD ensemble.
Significance. If the localization and isolation claims hold, the work would be significant for scalable quantum photonic integration. It directly tackles the spatial randomness and spectral heterogeneity of epitaxial QDs by providing a practical, automated framework for large-scale single-emitter characterization, which could accelerate materials optimization and deterministic nanophotonic device fabrication. The combination of wide-field imaging for localization with targeted confocal spectroscopy offers a data-efficient approach at chip scale.
major comments (1)
- [Platform description and methods section] Platform description and methods section: The central claim of acquiring data from thousands of individual QDs depends on wide-field PL imaging supplying localization coordinates accurate enough for the vector-scanning confocal measurements to isolate single emitters without crosstalk or multi-emitter contamination in dense ensembles. No quantitative metrics on localization precision, inter-dot spacing statistics, positioning errors, success rates of single-emitter isolation, or cross-validation (e.g., second-order correlation or spatial mapping) are reported, leaving the key assumption untested.
minor comments (1)
- [Abstract] Abstract: The abstract asserts platform performance and data acquisition from thousands of QDs but supplies no quantitative metrics, error analysis, or success rates; adding even summary statistics would strengthen the presentation.
Simulated Author's Rebuttal
We thank the referee for their constructive feedback and recommendation for major revision. We address the single major comment below regarding quantitative validation of the localization and isolation performance.
read point-by-point responses
-
Referee: [Platform description and methods section] Platform description and methods section: The central claim of acquiring data from thousands of individual QDs depends on wide-field PL imaging supplying localization coordinates accurate enough for the vector-scanning confocal measurements to isolate single emitters without crosstalk or multi-emitter contamination in dense ensembles. No quantitative metrics on localization precision, inter-dot spacing statistics, positioning errors, success rates of single-emitter isolation, or cross-validation (e.g., second-order correlation or spatial mapping) are reported, leaving the key assumption untested.
Authors: We agree that the manuscript lacks explicit quantitative metrics on localization precision, inter-dot spacing, positioning errors, isolation success rates, and cross-validation. In the revised manuscript we will add: (i) measured localization precision of the wide-field imaging step (e.g., standard deviation of repeated localizations on test emitters), (ii) histogram of nearest-neighbor distances extracted from the wide-field images to quantify ensemble density, (iii) positioning error statistics between wide-field coordinates and subsequent confocal centering, (iv) success rate defined as the fraction of targeted positions that yielded clean single-QD spectra versus multi-emitter or empty spectra, and (v) g^(2)(0) measurements on a representative subset of emitters together with spatial maps confirming isolation. These additions will be placed in an expanded Methods section and a new supplementary figure. revision: yes
Circularity Check
No circularity; experimental instrumentation paper with no derivations or predictions
full rationale
The paper introduces an automated cryogenic measurement platform combining wide-field imaging and vector-stage-scanning confocal spectroscopy for QD characterization. Claims rest on direct hardware operation and data acquisition from thousands of emitters, followed by statistical trends in the measured dataset. No mathematical derivations, equations, fitted parameters renamed as predictions, or first-principles results are present. The localization accuracy assumption is a methodological precondition for the experiment but is not derived from or equivalent to any input by construction. No self-citation chains or ansatzes are invoked to support any derivation chain. The work is self-contained as an experimental methods contribution.
Axiom & Free-Parameter Ledger
axioms (1)
- domain assumption Cryogenic temperatures are necessary to obtain high-quality, narrow-linewidth photoluminescence spectra from GaAs/AlGaAs quantum dots.
Reference graph
Works this paper leans on
-
[1]
scikit-image: image processing in Python,
S. v. d. Walt, J. L. Schönberger, J. Nunez-Iglesias, F. Boulogne, J. D. Warner, N. Yager, E. Gouil- lart, and T. Yu, “scikit-image: image processing in Python,” PeerJ2, e453 (2014)
2014
-
[2]
Software and Data Supplement: Automated Vector-Scanning Spectroscopy for Large-Scale Characterization of Single Quantum Emitters,
W. Eshbaugh, A. Chanana, E. Perez, J. Song, C. R. Copeland, S. Al Ghadani, D. McBride, P . Si- wakoti, M. C. Volpato, A. Rastelli, S. F. Covre da Silva, I. Segovia-Dominguez, S. Addamane, K. Srinivasan, E. B. Flagg, and M. Davanco, “Software and Data Supplement: Automated Vector-Scanning Spectroscopy for Large-Scale Characterization of Single Quantum Emit...
2026
-
[3]
SciPy 1.0: Fundamental Algorithms for Scientific Computing in Python,
P . Virtanen, R. Gommers, T. E. Oliphant, M. Haberland, T. Reddy, D. Cournapeau, E. Burovski, P . Peterson, W. Weckesser, J. Bright, S. J. van der Walt, M. Brett, J. Wilson, K. J. Millman, N. Mayorov, A. R. J. Nelson, E. Jones, R. Kern, E. Larson, C. J. Carey,˙I. Polat, Y. Feng, E. W. Moore, J. VanderPlas, D. Laxalde, J. Perktold, R. Cimrman, I. Henriksen...
2020
-
[4]
A density-based algorithm for discovering clusters in large spatial databases with noise,
M. Ester, H.-P . Kriegel, J. Sander, and X. Xu, “A density-based algorithm for discovering clusters in large spatial databases with noise,” inProceedings of the Second International Conference on Knowledge Discovery and Data Mining,(AAAI Press, Portland, Oregon, 1996), KDD’96, pp. 226–231
1996
-
[5]
Scikit-learn: Machine Learning in Python,
F. Pedregosa, G. Varoquaux, A. Gramfort, V . Michel, B. Thirion, O. Grisel, M. Blondel, P . Prettenhofer, R. Weiss, V . Dubourg, J. Vanderplas, A. Passos, D. Cournapeau, M. Brucher, M. Perrot, and É. Duchesnay, “Scikit-learn: Machine Learning in Python,” J. Mach. Learn. Res.12, 2825–2830 (2011)
2011
-
[6]
Efficient demultiplexed single-photon source with a quantum dot coupled to a nanophotonic waveguide,
T. Hummel, C. Ouellet-Plamondon, E. Ugur, I. Kulkova, T. Lund-Hansen, M. A. Broome, R. Uppu, and P . Lodahl, “Efficient demultiplexed single-photon source with a quantum dot coupled to a nanophotonic waveguide,” Appl. Phys. Lett.115(2019)
2019
-
[7]
Statistics of quantum dot exciton fine structure splittings and their polarization orientations,
S. Seidl, B. D. Gerardot, P . A. Dalgarno, K. Kowalik, A. W. Holleitner, P . M. Petroff, K. Karrai, and R. J. Warburton, “Statistics of quantum dot exciton fine structure splittings and their polarization orientations,” Phys. E: Low-dimensional Syst. Nanostructures40, 2153–2155 (2008)
2008
-
[8]
Experimental investigation and modeling of the fine structure splitting of neutral excitons in strain-free GaAs/AlxGa1−xAs quantum dots,
J. D. Plumhof, V . Kˇ rápek, L. Wang, A. Schliwa, D. Bimberg, A. Rastelli, and O. G. Schmidt, 9 “Experimental investigation and modeling of the fine structure splitting of neutral excitons in strain-free GaAs/AlxGa1−xAs quantum dots,” Phys. Rev. B81, 121309 (2010)
2010
-
[9]
Three-Dimensional Electrical Control of the Excitonic Fine Structure for a Quantum Dot in a Cavity,
H. Ollivier, P . Priya, A. Harouri, I. Sagnes, A. Lemaître, O. Krebs, L. Lanco, N. Lanzillotti- Kimura, M. Esmann, and P . Senellart, “Three-Dimensional Electrical Control of the Excitonic Fine Structure for a Quantum Dot in a Cavity,” Phys. Rev. Lett.129, 057401 (2022)
2022
-
[10]
Single-particle-picture breakdown in laterally weakly confining GaAs quantum dots,
D. Huber, B. U. Lehner, D. Csontosová, M. Reindl, S. Schuler, S. F. Covre da Silva, P . Klen- ovský, and A. Rastelli, “Single-particle-picture breakdown in laterally weakly confining GaAs quantum dots,” Phys. Rev. B100, 235425 (2019)
2019
-
[11]
Traceable localization enables accurate integration of quantum emitters and photonic structures with high yield,
C. R. Copeland, A. L. Pintar, R. G. Dixson, A. Chanana, K. Srinivasan, D. A. Westly, B. R. Ilic, M. I. Davanco, and S. M. Stavis, “Traceable localization enables accurate integration of quantum emitters and photonic structures with high yield,” Opt. Quantum2, 72–84 (2024)
2024
-
[12]
Deterministic quantum dot cavity placement using hyperspectral imaging with high spatial accuracy and precision,
Q. Buchinger, C. Krause, A. Zhang, G. Peniakov, M. Helal, Y. Reum, A. T. Pfenning, S. Höfling, and T. Huber-Loyola, “Deterministic quantum dot cavity placement using hyperspectral imaging with high spatial accuracy and precision,” Nano Convergence12, 36 (2025)
2025
-
[13]
Density-Based Clustering Based on Hierar- chical Density Estimates,
R. J. G. B. Campello, D. Moulavi, and J. Sander, “Density-Based Clustering Based on Hierar- chical Density Estimates,” inAdvances in Knowledge Discovery and Data Mining,J. Pei, V . S. Tseng, L. Cao, H. Motoda, and G. Xu, eds. (Springer, Berlin, Heidelberg, 2013), pp. 160–172
2013
-
[14]
hdbscan: Hierarchical density based clustering,
L. McInnes, J. Healy, and S. Astels, “hdbscan: Hierarchical density based clustering,” J. Open Source Softw.2, 205 (2017)
2017
-
[15]
J. O. Ramsay and B. W. Silverman,Functional Data Analysis, Springer Series in Statistics (Springer, New York, NY, 2005). 10
2005
discussion (0)
Sign in with ORCID, Apple, or X to comment. Anyone can read and Pith papers without signing in.