Parameterizing Operating-Point-Dependent IBR Using Coherent Operating Regions for Sub-synchronous Oscillation Analysis
Pith reviewed 2026-07-02 17:22 UTC · model grok-4.3
The pith
Partitioning IBR operating space into coherent regions via SVD enables accurate linear parameterization of frequency responses.
A machine-rendered reading of the paper's core claim, the machinery that carries it, and where it could break.
Core claim
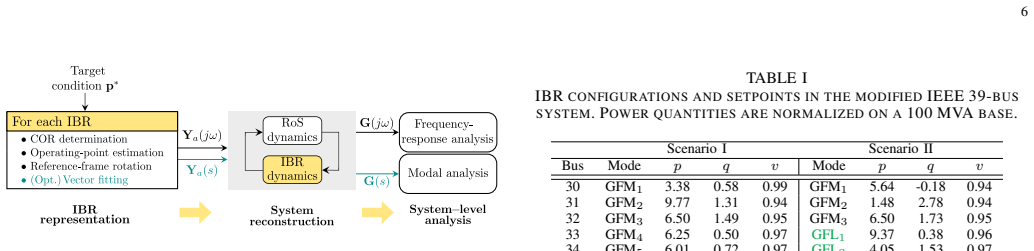
The paper claims that by partitioning the IBR operating space into dynamically consistent regions identified through singular value decomposition, and applying linear regression within each region, the operating-point-dependent frequency responses can be parameterized to accurately reconstruct system-level dynamics for sub-synchronous oscillation analysis without requiring new system-level frequency scans at each operating point.
What carries the argument
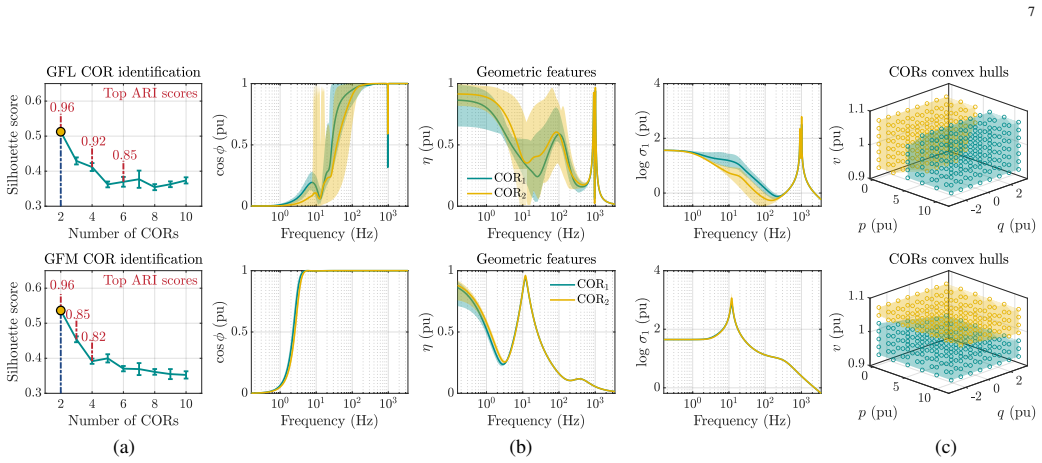
Singular value decomposition to identify coherent operating regions from a geometric representation of the operating space, enabling linear regression to capture frequency response variations inside each region.
Load-bearing premise
The premise that the operating space can be divided into regions where IBR frequency response changes smoothly enough for linear regression to suffice.
What would settle it
A direct frequency scan at an operating point inside one of the identified regions that shows large deviation from the linear regression prediction would falsify the claim.
Figures
read the original abstract
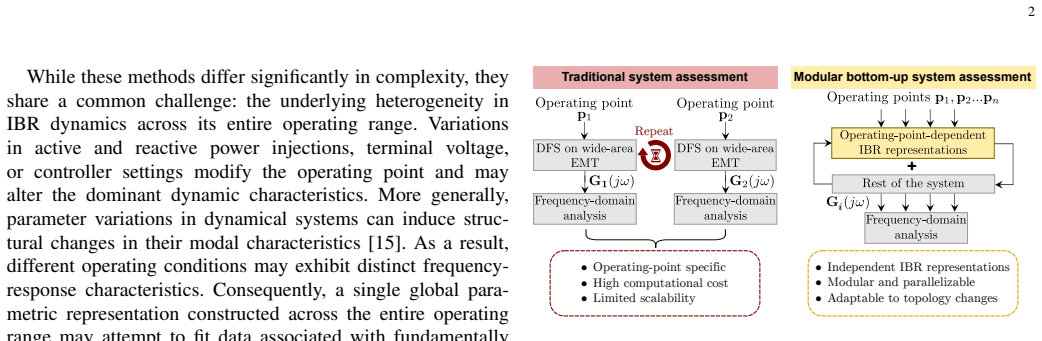
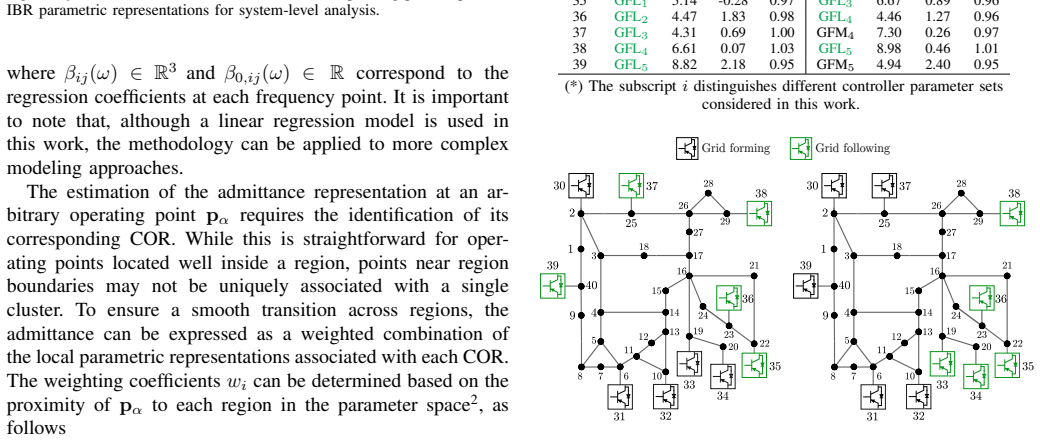
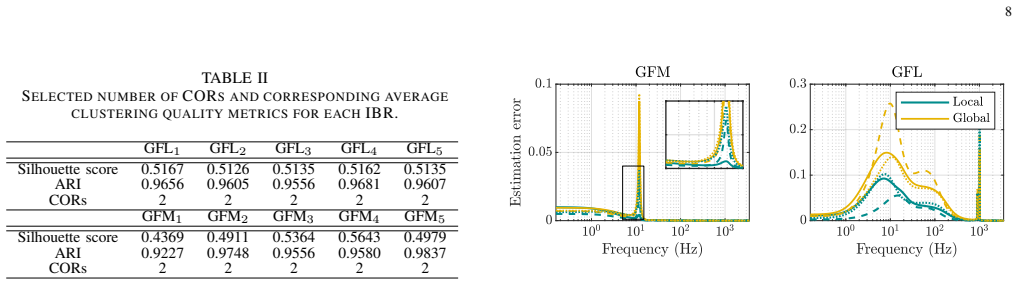
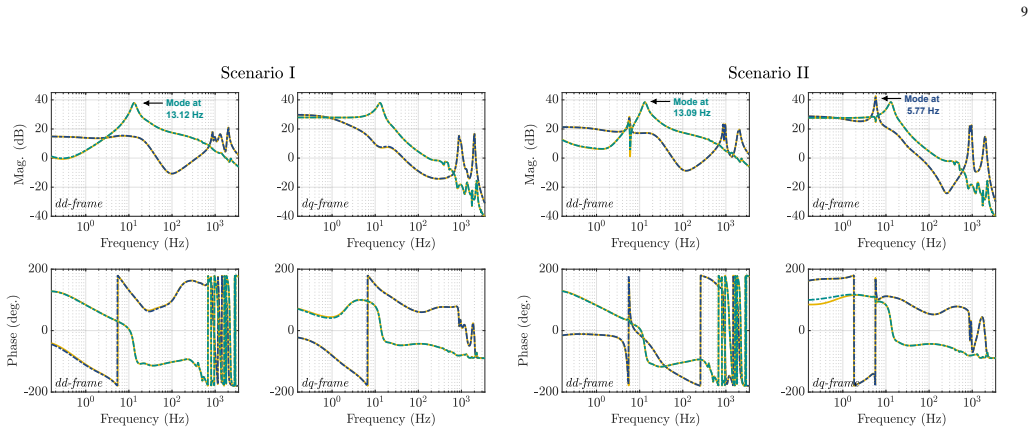
Analysis of sub-synchronous oscillations (SSO) in IBR-dominated grids relies on frequency scan-based estimation of black-box IBR models at selected operating points. Since IBRs may operate over a wide range of operating conditions, frequency responses obtained at a limited number of operating points may not adequately represent the dynamics required for system-level SSO analysis. Accurate parameterization of operating-point-dependent IBR dynamics is challenging due to the heterogeneous dynamic behaviors that may arise across the operating space. This paper addresses this challenge by analytically characterizing the conditions that give rise to discontinuous and non-smooth variations in IBR dynamics. Leveraging these insights, a geometric representation based on singular value decomposition is used to identify coherent operating regions and partition the operating space into dynamically consistent regions. Within each region, the operating-point dependence of the IBR frequency response is accurately captured using simple linear regression. The proposed framework is validated on a modified IEEE 39-bus system. Results demonstrate that the parameterized IBR frequency responses accurately reconstruct system-level dynamics at the prevailing operating condition, enabling frequency-response and modal analysis without repeated system-level frequency scans.
Editorial analysis
A structured set of objections, weighed in public.
Referee Report
Summary. The paper claims that analytically characterizing conditions for discontinuous/non-smooth IBR dynamics, followed by SVD-based identification of coherent operating regions and linear regression within each region, allows accurate parameterization of operating-point-dependent IBR frequency responses. This enables system-level SSO frequency-response and modal analysis on a modified IEEE 39-bus system without repeated full-system frequency scans.
Significance. If the central reconstruction claim holds with supporting metrics, the approach would reduce the computational burden of SSO studies in IBR-dominated grids by replacing repeated system-level scans with interpolated black-box models derived from limited frequency-scan data.
major comments (2)
- [Abstract] Abstract: the claim that 'the parameterized IBR frequency responses accurately reconstruct system-level dynamics' is presented without any quantitative error metrics, regression residuals, or fit-quality statistics; this directly underpins the assertion that modal analysis can proceed without repeated scans.
- [Abstract] Abstract (validation paragraph): no description is given of how the analytic discontinuity conditions were applied to define region boundaries, nor of the SVD rank or regression coefficients inside regions; without these, it is impossible to verify whether the frequency-response manifold is sufficiently low-rank and locally linear for the linear-regression step to be load-bearing.
minor comments (1)
- The abstract would be clearer if it stated the number of operating points sampled, the number of coherent regions identified, and the frequency range used for the scans.
Simulated Author's Rebuttal
We thank the referee for the detailed and constructive comments. We address each major comment below and agree to revise the abstract to improve clarity and support for the claims.
read point-by-point responses
-
Referee: [Abstract] Abstract: the claim that 'the parameterized IBR frequency responses accurately reconstruct system-level dynamics' is presented without any quantitative error metrics, regression residuals, or fit-quality statistics; this directly underpins the assertion that modal analysis can proceed without repeated scans.
Authors: We agree that quantitative metrics would make the abstract's claim more self-contained. The manuscript body (Section 5) already includes these details, such as regression residuals, R² statistics, and system-level reconstruction errors on the IEEE 39-bus test case. We will revise the abstract to incorporate key quantitative indicators (e.g., average fit quality and maximum frequency-response errors) to directly support the reconstruction assertion. revision: yes
-
Referee: [Abstract] Abstract (validation paragraph): no description is given of how the analytic discontinuity conditions were applied to define region boundaries, nor of the SVD rank or regression coefficients inside regions; without these, it is impossible to verify whether the frequency-response manifold is sufficiently low-rank and locally linear for the linear-regression step to be load-bearing.
Authors: Abstracts are necessarily concise summaries; the full methodology—including explicit application of analytic discontinuity conditions to set region boundaries, the SVD ranks confirming low-rank structure, and the regression coefficients—is provided in Sections 3 and 4 with supporting figures and tables. We will revise the abstract's validation paragraph to include a brief reference to these elements (e.g., SVD rank and confirmed local linearity) to aid immediate verifiability while retaining brevity. revision: yes
Circularity Check
No circularity: method uses external scans and standard linear algebra
full rationale
The paper's chain applies SVD to partition operating space based on frequency-response data obtained from external scans, then fits linear regression inside regions. No quoted step defines a quantity in terms of itself, renames a fitted input as a prediction, or reduces the central reconstruction claim to a self-citation chain. The approach remains self-contained against external frequency-scan benchmarks and does not invoke load-bearing self-citations or uniqueness theorems from the authors' prior work.
Axiom & Free-Parameter Ledger
axioms (1)
- domain assumption IBR dynamics exhibit heterogeneous behaviors across the operating space that can be partitioned into coherent regions where linear regression suffices
Reference graph
Works this paper leans on
-
[1]
Def- inition and Classification of Power System Stability – Revisited & Extended,
N. Hatziargyriou, J. Milanovic, C. Rahmann, V . Ajjarapu, C. Canizares, I. Erlich, D. Hill, I. Hiskens, I. Kamwa, B. Pal, P. Pourbeik, J. Sanchez- Gasca, A. Stankovic, T. Van Cutsem, V . Vittal, and C. V ournas, “Def- inition and Classification of Power System Stability – Revisited & Extended,”IEEE Trans. Power Syst., vol. 36, no. 4, pp. 3271–3281, 2021
2021
-
[2]
Multilayered defense against oscillations: Mitigation of oscillation risk in inverter-dominated power grids,
Y . Gu, B. Chaudhuri, T. C. Green, X. Zhou, and J. Ramachandran, “Multilayered defense against oscillations: Mitigation of oscillation risk in inverter-dominated power grids,”IEEE Power Energy Mag., vol. 24, no. 1, pp. 39–48, 2026
2026
-
[3]
Diagnosis and mitigation of ob- served oscillations in ibr-dominant power systems: A practical guide,
Energy Systems Integration Group, “Diagnosis and mitigation of ob- served oscillations in ibr-dominant power systems: A practical guide,” https://www.esig.energy/oscillations-guide/, Reston, V A, 2024
2024
-
[4]
Real-world subsynchronous oscillation events in power grids with high penetrations of inverter-based resources,
Y . Cheng, L. Fan, J. Rose, S.-H. Huang, J. Schmall, X. Wang, X. Xie, J. Shair, J. R. Ramamurthy, N. Modi, C. Li, C. Wang, S. Shah, B. Pal, Z. Miao, A. Isaacs, J. Mahseredjian, and J. Zhou, “Real-world subsynchronous oscillation events in power grids with high penetrations of inverter-based resources,”IEEE Trans. Power Syst., vol. 38, no. 1, pp. 316–330, 2023
2023
-
[5]
High inverter-based resource integration: The experience of five system operators,
N. Modi, M. V . Escudero, K. Aramaki, X. Zhou, and P. Partinen, “High inverter-based resource integration: The experience of five system operators,”IEEE Power Energy Mag., vol. 22, no. 2, pp. 78–88, 2024
2024
-
[6]
Z-tool: Frequency-domain char- acterization of emt models for small-signal stability analysis,
F. J. Cifuentes Garcia and J. Beerten, “Z-tool: Frequency-domain char- acterization of emt models for small-signal stability analysis,”Electric Power Systems Research, vol. 252, p. 112405, 2026
2026
-
[7]
Dq admittance extraction for inverter-based resources,
R. H. Ramakrishna, Z. Miao, L. Fan, and S. Shah, “Dq admittance extraction for inverter-based resources,” in2023 IEEE Power & Energy Society General Meeting (PESGM), 2023, pp. 1–5
2023
-
[8]
Guidance on Oscillation Assessment for Inverter-Based Resources (IBRs) – Version 2,
National Energy System Operator, “Guidance on Oscillation Assessment for Inverter-Based Resources (IBRs) – Version 2,” 2025, [Online]. Available: https://www.neso.energy/document/368341/download
2025
-
[9]
A new paradigm for small-signal stability analysis in modern power systems: Challenges, models, and methods in power systems rich in power electronics,
M. Cheah-Mane, J. Arevalo-Soler, D. Moutevelis, E. Mateu-Barriendos, E. Prieto-Araujo, O. Gomis-Bellmunt, J. Renedo, M. Martin-Almenta, E. Nu ˜no-Martinez, S. Martinez-Villanueva, J. Jung, N. Kim, and Y . Kwon, “A new paradigm for small-signal stability analysis in modern power systems: Challenges, models, and methods in power systems rich in power electr...
2026
-
[10]
Machine learning at the grid edge: Data-driven impedance models for model-free inverters,
Y . Li, Y . Liao, L. Zhao, M. Chen, X. Wang, L. Nordstr ¨om, P. Mittal, and H. Vincent Poor, “Machine learning at the grid edge: Data-driven impedance models for model-free inverters,”IEEE Trans. Power Elec- tron., vol. 39, no. 8, pp. 10 465–10 481, 2024
2024
-
[11]
Data-driven estimation of impedance of inverter-based resources for efficient stability evaluation,
N. Mohammed, W. Zhou, D. Ramasubramanian, B. Bahrani, S. Dutta, and M. Bello, “Data-driven estimation of impedance of inverter-based resources for efficient stability evaluation,”Electric Power Systems Research, vol. 244, p. 111559, 2025
2025
-
[12]
Support vector ma- chines for predicting the impedance model of inverter-based resources,
N. Mohammed, W. Zhou, B. Bahrani, and D. J. Hill, “Support vector ma- chines for predicting the impedance model of inverter-based resources,” IEEE Trans. Power Syst., vol. 39, no. 6, pp. 7359–7375, 2024
2024
-
[13]
Sequence impedance identification-based online small-signal stability assessment of grid-connected renewable energy stations considering measurement noise,
Z. Ge, W. Yao, H. Zhao, S. Wei, W. Gan, H. Shuai, Y . Lan, and J. Wen, “Sequence impedance identification-based online small-signal stability assessment of grid-connected renewable energy stations considering measurement noise,”Applied Energy, vol. 412, p. 127638, 2026
2026
-
[14]
Impedance profile prediction for grid-connected vscs with data-driven feature extraction,
Y . Wu, H. Wu, L. Cheng, J. Zhou, Z. Zhou, M. Chen, and X. Wang, “Impedance profile prediction for grid-connected vscs with data-driven feature extraction,”IEEE Trans. Power Electron., vol. 40, no. 2, pp. 3043–3061, 2025
2025
-
[15]
Enhanced meta-modelling technique for analysis of mode crossing, mode veering and mode coalescence in structural dynamics,
A. Gallina, L. Pichler, and T. Uhl, “Enhanced meta-modelling technique for analysis of mode crossing, mode veering and mode coalescence in structural dynamics,”Mechanical Systems and Signal Processing, vol. 25, no. 7, pp. 2297–2312, 2011
2011
-
[16]
Real-time solution of linear computational problems using databases of parametric reduced-order models with arbitrary underlying meshes,
D. Amsallem, R. Tezaur, and C. Farhat, “Real-time solution of linear computational problems using databases of parametric reduced-order models with arbitrary underlying meshes,”Journal of Computational Physics, vol. 326, pp. 373–397, Dec. 2016
2016
-
[17]
Nonlinear model order reduction based on local reduced-order bases,
D. Amsallem, M. J. Zahr, and C. Farhat, “Nonlinear model order reduction based on local reduced-order bases,”International Journal for Numerical Methods in Engineering, vol. 92, no. 10, pp. 891–916, 2012
2012
-
[18]
A survey of projection-based model reduction methods for parametric dynamical systems,
P. Benner, S. Gugercin, and K. Willcox, “A survey of projection-based model reduction methods for parametric dynamical systems,”SIAM Review, vol. 57, no. 4, pp. 483–531, 2015
2015
-
[19]
Inconsistency removal of reduced bases in parametric model order reduction by matrix inter- polation using adaptive sampling and clustering,
S. Resch-Schopper, R. Rumpler, and G. M ¨uller, “Inconsistency removal of reduced bases in parametric model order reduction by matrix inter- polation using adaptive sampling and clustering,”International Journal for Numerical Methods in Engineering, vol. 127, no. 1, p. e70241, 2026
2026
-
[20]
Data-driven parametrized model reduc- tion in the loewner framework,
A. C. Ionita and A. C. Antoulas, “Data-driven parametrized model reduc- tion in the loewner framework,”SIAM Journal on Scientific Computing, vol. 36, no. 3, pp. A984–A1007, 2014
2014
-
[21]
Emt — rms modeling trade-off for ibr-driven sub-synchronous oscillations,
M. S. Javaid, B. Chaudhuri, F. Teng, and Z. Akhtar, “Emt — rms modeling trade-off for ibr-driven sub-synchronous oscillations,”IEEE Trans. Power Syst., pp. 1–12, 2025
2025
-
[22]
Impedance-based whole-system modeling for a composite grid via embedding of frame dynamics,
Y . Gu, Y . Li, Y . Zhu, and T. C. Green, “Impedance-based whole-system modeling for a composite grid via embedding of frame dynamics,”IEEE Trans. Power Syst., vol. 36, no. 1, pp. 336–345, 2021
2021
-
[23]
Black-box impedance- based stability assessment of dynamic interactions between converters and grid,
N. Cifuentes, M. Sun, R. Gupta, and B. C. Pal, “Black-box impedance- based stability assessment of dynamic interactions between converters and grid,”IEEE Trans. Power Syst., vol. 37, no. 4, pp. 2976–2987, 2022
2022
-
[24]
Comparing partitions,
L. Hubert and P. Arabie, “Comparing partitions,”Journal of Classifica- tion, vol. 2, no. 1, pp. 193–218, 1985
1985
-
[25]
Silhouettes: A graphical aid to the interpretation and validation of cluster analysis,
P. J. Rousseeuw, “Silhouettes: A graphical aid to the interpretation and validation of cluster analysis,”Journal of Computational and Applied Mathematics, vol. 20, pp. 53–65, 1987
1987
discussion (0)
Sign in with ORCID, Apple, or X to comment. Anyone can read and Pith papers without signing in.