May (A)I Beautify Your Visualization? Expert Judgments of Acceptable Aesthetic Alterations
Pith reviewed 2026-07-02 17:10 UTC · model grok-4.3
The pith
Expert survey finds acceptability of visualization alterations driven by transformation meaning, with AI versions rated lower than human ones regardless of presentation or data level.
A machine-rendered reading of the paper's core claim, the machinery that carries it, and where it could break.
Core claim
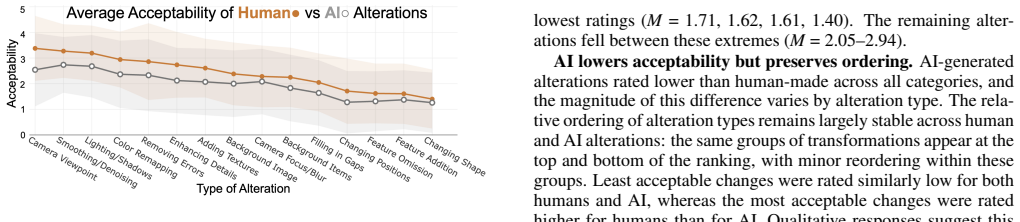
Through the survey, the authors establish that perceived acceptability of alterations is driven by the transformation's meaning, independent of whether it operates at the presentation or data level. Certain modifications are consistently judged more permissible regardless of human or AI authorship, while the relative ordering remains largely stable, yet AI-generated transformations are rated less acceptable than identical human-produced changes. This reveals a distinction between more permissible and more sensitive alterations.
What carries the argument
Expert survey (N=95) rating fifteen alterations spanning presentation-level and data-level modifications applied by humans or AI.
If this is right
- Designers should prioritize the meaning of a proposed alteration when evaluating its use in visualizations.
- AI-assisted visualization tools require guardrails that distinguish between more permissible and more sensitive alterations.
- The stable ordering of alterations can guide consistent decision-making across human and automated workflows.
- Both presentation-level and data-level changes need scrutiny based on their interpretive impact rather than their technical category.
Where Pith is reading between the lines
- Visualization software interfaces could surface warnings or approval steps for alterations that experts rate as more sensitive.
- The lower acceptability for AI authorship may affect how tools disclose or attribute automated edits to users.
- Testing whether these expert patterns hold for non-expert viewers or other visualization domains would clarify the scope of the results.
Load-bearing premise
The fifteen alterations selected for the survey represent the range of aesthetic modifications in real visualization practice, and expert self-reported judgments accurately capture concerns about data perception and integrity without significant response bias.
What would settle it
A follow-up study using a different or expanded set of alterations that finds presentation versus data level as the primary driver of acceptability differences, or that finds no difference between human and AI ratings, would challenge the central claims.
Figures
read the original abstract
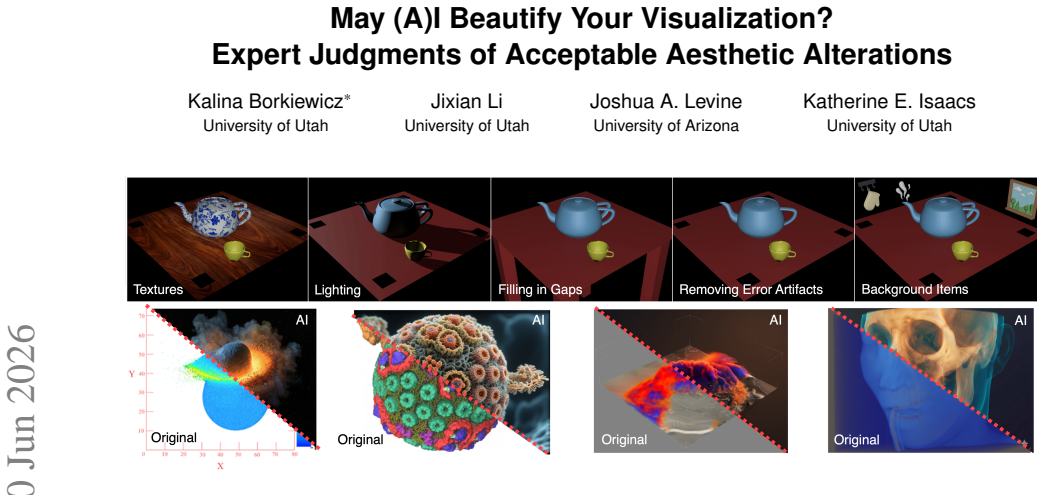
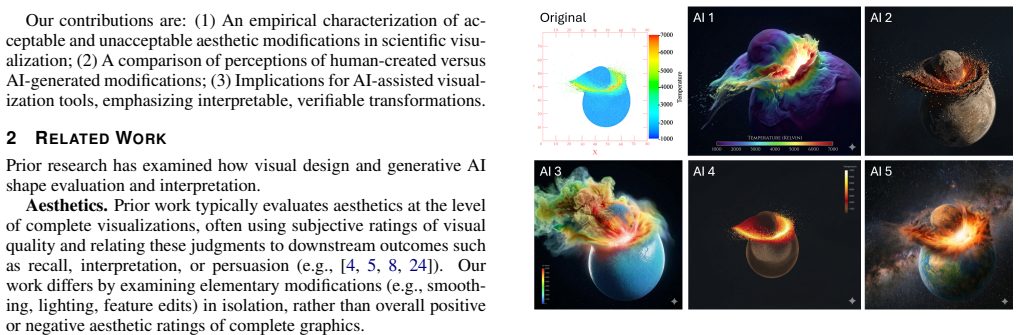
In 3D visualizations of natural phenomena, improving aesthetics can provide measurable benefits, but often involves transformations that affect how the data is perceived. As a growing range of tools - including AI-based methods - make visual design and modification more accessible, it is increasingly important to understand trade offs and concerns when making these changes. We conducted an expert survey (N=95) with visualization researchers, practitioners, and domain scientists, investigating reactions to fifteen alterations spanning presentation-level adjustments (e.g., lighting, camera position) and data-level modifications (e.g., removing errors, filling gaps), applied by both humans and AI systems. Results show differences in perceived acceptability are driven by the transformation's meaning, regardless of whether it operates at the presentation or data level. Additionally, certain modifications were consistently judged as more permissible than others regardless of human or AI authorship. While this relative ordering remains largely stable, AI-generated transformations are consistently rated as less acceptable than identical human-produced changes. These results reveal a distinction between more permissible and more sensitive alterations, and suggest the need for both designers and AI-assisted visualization tools to incorporate constraints and guardrails that reflect these differences.
Editorial analysis
A structured set of objections, weighed in public.
Referee Report
Summary. The manuscript reports results from an expert survey (N=95) with visualization researchers, practitioners, and domain scientists. Participants rated the acceptability of 15 aesthetic alterations in 3D visualizations of natural phenomena. Alterations span presentation-level (e.g., lighting, camera) and data-level (e.g., error removal, gap filling) changes, each applied by either humans or AI. Key claims are that perceived acceptability is driven by the meaning of the transformation independent of operational level, that certain modifications show stable relative permissibility rankings across authorship, and that AI versions are consistently rated less acceptable than identical human versions.
Significance. If the methodological gaps are resolved, the work supplies empirical evidence on expert perceptions of visualization aesthetics that can inform design guidelines and guardrails for both human and AI-assisted tools. The reported dissociation between meaning and level, plus the stable ordering with an AI penalty, offers a concrete basis for distinguishing permissible from sensitive alterations in visualization practice.
major comments (3)
- [Methods] Methods section: The description provides no information on survey design details, statistical tests, response rates, or controls for order effects and social desirability bias. The central claims about meaning-driven acceptability independent of level and the consistent AI penalty rest on these unexamined choices.
- [Methods / Results] The 15 alterations lack a described sampling frame, coverage validation, or pre-registered classification by 'meaning.' Without this, the reported dissociation between meaning and presentation/data level could be an artifact of item selection rather than a general property (see weakest assumption on representativeness).
- [Results] Results: No effect sizes, confidence intervals, or explicit tests for the stability of relative orderings across human/AI conditions are referenced, making it difficult to evaluate the strength of the 'largely stable' ordering claim.
minor comments (1)
- [Abstract] Abstract: The parenthetical examples of alterations could be expanded with one sentence on how many fall into each level (presentation vs. data) to clarify the balance of the stimulus set.
Simulated Author's Rebuttal
We thank the referee for the constructive feedback on our manuscript. We address each major comment below, indicating where we will revise the paper to improve clarity and rigor.
read point-by-point responses
-
Referee: [Methods] Methods section: The description provides no information on survey design details, statistical tests, response rates, or controls for order effects and social desirability bias. The central claims about meaning-driven acceptability independent of level and the consistent AI penalty rest on these unexamined choices.
Authors: We agree that the Methods section requires expansion to include these details. The revised manuscript will add subsections describing the survey instrument design (including question ordering and randomization), the specific statistical tests performed (e.g., mixed-effects models), response rate and completion metrics, and any steps taken to mitigate order effects or social desirability bias (such as anonymous administration and neutral phrasing). revision: yes
-
Referee: [Methods / Results] The 15 alterations lack a described sampling frame, coverage validation, or pre-registered classification by 'meaning.' Without this, the reported dissociation between meaning and presentation/data level could be an artifact of item selection rather than a general property (see weakest assumption on representativeness).
Authors: We acknowledge the need for greater transparency on item selection. In revision, we will add a dedicated subsection in Methods explaining the sampling frame for the 15 alterations, the process used to classify them by transformation meaning (including the rationale for balancing presentation- and data-level changes), and any coverage validation performed during pilot testing. While the classification was developed iteratively by the research team rather than pre-registered, we will document this procedure explicitly so readers can evaluate potential selection effects. revision: yes
-
Referee: [Results] Results: No effect sizes, confidence intervals, or explicit tests for the stability of relative orderings across human/AI conditions are referenced, making it difficult to evaluate the strength of the 'largely stable' ordering claim.
Authors: We will revise the Results section to report effect sizes (e.g., Cohen's d or partial eta-squared), 95% confidence intervals for key comparisons, and explicit statistical tests (such as rank correlation or permutation tests) assessing the stability of relative orderings between human and AI conditions. These additions will provide quantitative support for the stability claim. revision: yes
Circularity Check
No circularity: direct empirical survey with no derivations or fitted predictions
full rationale
This paper reports results from an expert survey (N=95) on acceptability of 15 visualization alterations. There are no equations, parameters, derivations, or first-principles claims that could reduce to inputs by construction. All findings derive from direct participant responses rather than any model fitting or self-referential logic. No load-bearing self-citations of theorems or ansatzes appear in the described methodology or results.
Axiom & Free-Parameter Ledger
axioms (1)
- domain assumption Expert self-reported judgments on visualization alterations accurately reflect real-world concerns about data perception and integrity.
Reference graph
Works this paper leans on
-
[1]
P. W. Anani, F. D. Mintah, A. A. A. Danso, and E. W. Churcher. Filtered reality: Exploring the motives and socio-demographic fac- tors of smartphone beauty filter usage among university students in Ghana.Cogent Arts & Humanities, 11(1):2392381, 2024. doi: 10. 1080/23311983.2024.2392381 4
-
[2]
J. Baca, D. Carruth, M. Stephens, and C. Lewis. Evidence for effect of aesthetic on interpretation of visualizations by engineers and non- engineers. InTareq Ahram and Christianne Falc ˜ao (eds) Usability and User Experience. AHFE (2022) International Conference, vol. 39,
2022
-
[3]
doi: 10.54941/ahfe1001718 1
-
[4]
R. C. Basole and T. Major. Generative AI for visualization: Oppor- tunities and challenges.IEEE Computer Graphics and Applications, 44(2):55–64, 2024. doi: 10.1109/MCG.2024.3362168 2
-
[5]
Bateman, R
S. Bateman, R. L. Mandryk, C. Gutwin, A. Genest, D. McDine, and C. Brooks. Useful junk? The effects of visual embellishment on com- prehension and memorability of charts. InProc. of CHI, pp. 2573–
-
[6]
doi: 10.1145/1753326.1753716 1, 2
ACM, 2010. doi: 10.1145/1753326.1753716 1, 2
-
[7]
M. A. Borkin, A. A. V o, Z. Bylinskii, P. Isola, S. Sunkavalli, A. Oliva, and H. Pfister. What makes a visualization memorable?IEEE Trans- actions on Visualization and Computer Graphics, 19(12):2306–2315, Dec 2013. doi: 10.1109/TVCG.2013.234 1, 2
-
[8]
Borland and R
D. Borland and R. M. Taylor II. Rainbow color map (still) considered harmful.IEEE Computer Graphics and Applications, 27(2):14–17,
-
[9]
doi: 10.1109/MCG.2007.323435 2
-
[10]
A. Carusi. Scientific visualisations and aesthetic grounds for trust. Ethics and Information Technology, 10(4):243–254, 2008. doi: 10. 1007/s10676-008-9159-5 1
2008
-
[11]
N. Cawthon and A. V . Moere. The effect of aesthetic on the usability of data visualization. In2007 11th International Conference Informa- tion Visualization (IV ’07), pp. 637–648, 2007. doi: 10.1109/IV.2007 .147 1, 2
-
[12]
W. S. Cleveland and R. McGill. Graphical perception: Theory, ex- perimentation, and application to the development of graphical meth- ods.Journal of the American Statistical Association, 79(387):531– 554, 1984. doi: 10.1080/01621459.1984.10478080 2
-
[13]
M. Correll and M. Gleicher. Error bars considered harmful: Exploring alternate encodings for mean and error.IEEE Transactions on Visu- alization and Computer Graphics, 20(12):2142–2151, 2014. doi: 10. 1109/TVCG.2014.2346298 2
-
[14]
H. Farid. Digital doctoring: Can we trust photographs? In B. Harring- ton, ed.,Deception: From Ancient Empires to Internet Dating, chap. 5. Stanford University Press, 2009. doi: 10.1515/9781503626607-007 4
-
[15]
I. Freiling, S. K. Yeo, and H. Xue. When AI and humans produce par- tial truths: Examining acceptability of perceived error and perceived associated harms.Health Communication, 0(0):1–12, 2026. PMID: 41482663. doi: 10.1080/10410236.2025.2608202 2
-
[16]
Gulati, M
A. Gulati, M. Mart ´ınez-Garcia, D. Fern´andez, M. A. Lozano, B. Lepri, and N. Oliver. What is beautiful is still good: The attractiveness halo effect in the era of beauty filters.Royal Society Open Science, 11(11),
-
[17]
doi: 10.1098/rsos.240882 4
-
[18]
Huang, W
L. Huang, W. Yu, W. Ma, W. Zhong, Z. Feng, H. Wang, Q. Chen, W. Peng, X. Feng, B. Qin, and T. Liu. A survey on hallucination in large language models: Principles, taxonomy, challenges, and open questions.ACM Trans. Inf. Syst., 43(2), Jan. 2025. doi: 10.1145/ 3703155 1
2025
-
[19]
E. A. Jensen, K. Borkiewicz, J. P. Naiman, S. Levy, and J. Carpen- ter. Picture perfect science communication: How public audiences respond to informational labels in cinematic-style 3D data visualiza- tion.PLOS ONE, 19(10):e0307733, 2024. doi: 10.1371/journal.pone .0307733 4
-
[20]
A. Joshi and P. Rheingans. Illustration-inspired techniques for visu- alizing time-varying data. InIEEE Visualization, pp. 679–686, 2005. doi: 10.1109/VISUAL.2005.1532857 4
-
[21]
P. M. Kumarage and M. Saarela. Explainable generative AI: A two- stage review of existing techniques and future research directions.AI, 7(1), 2026. doi: 10.3390/ai7010031 2
-
[22]
M. C. Laupichler, N. Knoth, J. Schleiss, and T. Raupach. Algorithm aversion revisited: The role of AI literacy and attitudes towards AI in shaping perceptions of AI-generated texts.British Journal of Educa- tional Technology, 2025. doi: 10.1111/bjet.70035 2
-
[23]
C. Lin and M. A. Thornton. Visualization aesthetics influence trust in science, news, and social media, 2021. doi: 10.31234/osf.io/dnr9s 1
-
[24]
S. Liu, H. Miao, and P.-T. Bremer. ParaView-MCP: An autonomous visualization agent with direct tool use. InIEEE Visualization and Visual Analytics (VIS), pp. 61–65, 2025. doi: 10.1109/VIS60296.2025 .00018 1
-
[25]
M. A. Lones. Pitfalls and risks of generative AI in machine learning. Patterns, p. 101534, 2026. doi: 10.1016/j.patter.2026.101534 2
-
[26]
M. Mucundorfeanu, D. C. Balaban, and M. Mauer. Exploring the ef- fectiveness of digital manipulation disclosures for instagram posts on source credibility and authenticity of social media influencers.Inter- national Journal of Advertising, 44(1):131–163, 2025. doi: 10.1080/ 02650487.2024.2381973 4
-
[27]
A. Nasim Saravi, J. Horacsek, U. Alim, and J. D. Silva. Transfer- ring transfer functions (TTF): A guided approach to transfer func- tion optimization in volume visualization.Computers & Graphics, 124:104067, 2024. doi: 10.1016/j.cag.2024.104067 1
-
[28]
A. V . Pandey, A. Manivannan, O. Nov, M. Satterthwaite, and E. Bertini. The persuasive power of data visualization.IEEE Trans- actions on Visualization and Computer Graphics, 20(12):2211–2220,
-
[29]
doi: 10.1109/TVCG.2014.2346419 2
-
[30]
A. V . Pandey, K. Rall, M. L. Satterthwaite, O. Nov, and E. Bertini. How deceptive are deceptive visualizations? An empirical analysis of common distortion techniques. InProc. of CHI, p. 1469–1478. ACM, New York, NY , USA, 2015. doi: 10.1145/2702123.2702608 2
-
[31]
We are visual thinkers, not verbal thinkers!
H. Park, J. Eirich, A. Luckow, and M. Sedlmair. “We are visual thinkers, not verbal thinkers!”: A thematic analysis of how profes- sional designers use generative AI image generation tools. InProceed- ings of the 13th Nordic Conference on Human-Computer Interaction, NordiCHI ’24. Association for Computing Machinery, New York, NY , USA, 2024. doi: 10.1145/...
-
[32]
A. Pfeuffer, H. R. Hatfield, N. Evans, and J. Kim. Illegally beau- tiful? The role of trust and persuasion knowledge in online image manipulation disclosure effects.International Journal of Advertising, 44(4):696–717, 2025. doi: 10.1080/02650487.2024.2403311 4
-
[33]
P. Rautek, S. Bruckner, E. Gr ¨oller, and I. Viola. Illustrative visual- ization: New technology or useless tautology?SIGGRAPH Comput. Graph., 42(3), Aug. 2008. doi: 10.1145/1408626.1408633 4
-
[34]
J. Rho, M. A. Rau, and X. Zhu. Comparing the deceptive impact of misleading data visualizations: Implications for adaptive data literacy support in computer-based learning environments.Computers & Ed- ucation, 242:105508, 2026. doi: 10.1016/j.compedu.2025.105508 2
-
[35]
V . Schetinger, S. Di Bartolomeo, M. El-Assady, A. McNutt, M. Miller, J. P. A. Passos, and J. L. Adams. Doom or deliciousness: Challenges and opportunities for visualization in the age of generative models. Computer Graphics Forum, 42(3):423–435, 2023. doi: 10.1111/cgf. 14841 2
work page doi:10.1111/cgf 2023
-
[36]
G. G. Starr. Aesthetic experience models human learning.Frontiers in Human Neuroscience, V olume 17 - 2023, 2023. doi: 10.3389/fnhum. 2023.1146083 1
-
[37]
K. Tang and C. Wang. StyleRF-V olVis: Style transfer of neural radi- ance fields for expressive volume visualization.IEEE Transactions on Visualization & Computer Graphics, 31(1):613–623, Jan. 2025. doi: 10.1109/TVCG.2024.3456342 1, 2
-
[38]
T. L. Weissgerber, N. M. Milic, S. J. Winham, and V . D. Garovic. Beyond bar and line graphs: Time for a new data presentation paradigm.PLOS Biology, 13(4):1–10, 04 2015. doi: 10.1371/journal. pbio.1002128 2
-
[39]
P. Wlekły. Aesthetics and usability of statistics data visualisation through charts: An eyetracking study as a tool for chart analysis. European Research Studies Journal, 27(B):848–868, 2024. doi: 10. 35808/ersj/3679 1
2024
-
[40]
Y . Ye, J. Hao, Y . Hou, Z. Wang, S. Xiao, Y . Luo, and W. Zeng. Gener- ative AI for visualization: State of the art and future directions.Visual Informatics, 8(2):43–66, 2024. doi: 10.1016/j.visinf.2024.04.003 2
discussion (0)
Sign in with ORCID, Apple, or X to comment. Anyone can read and Pith papers without signing in.