Data Comics for Education: Evaluating Effectiveness, Benefits, and the Ethics of AI-Assisted Creation
Pith reviewed 2026-07-03 05:53 UTC · model grok-4.3
The pith
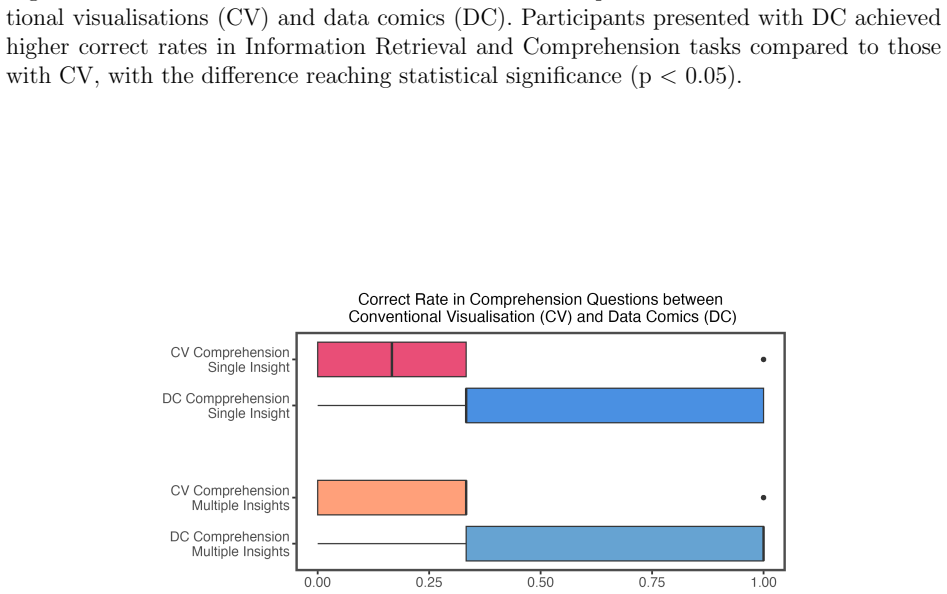
University students performed better on insight comprehension tasks with data comics than with conventional visualizations, regardless of their visualization literacy.
A machine-rendered reading of the paper's core claim, the machinery that carries it, and where it could break.
Core claim
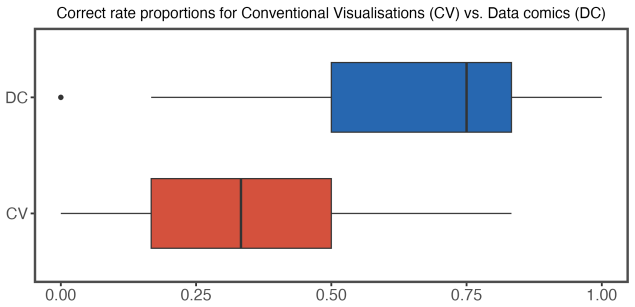
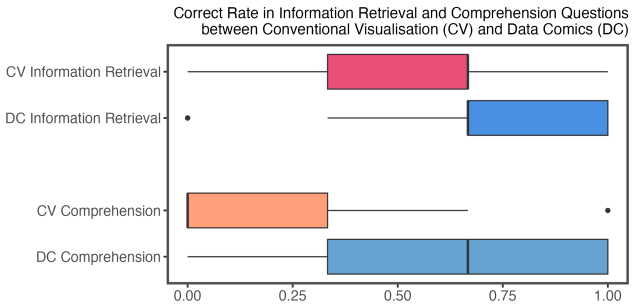
In a within-subjects study with 60 university students, data comics created with generative AI assistance led to higher performance on insight comprehension tasks compared to conventional visualizations. The advantage appeared independent of participants' prior visualization literacy. Students rated the comics as more engaging and easier to understand, while also raising concerns about potential misinformation and ownership issues arising from the AI-assisted production process.
What carries the argument
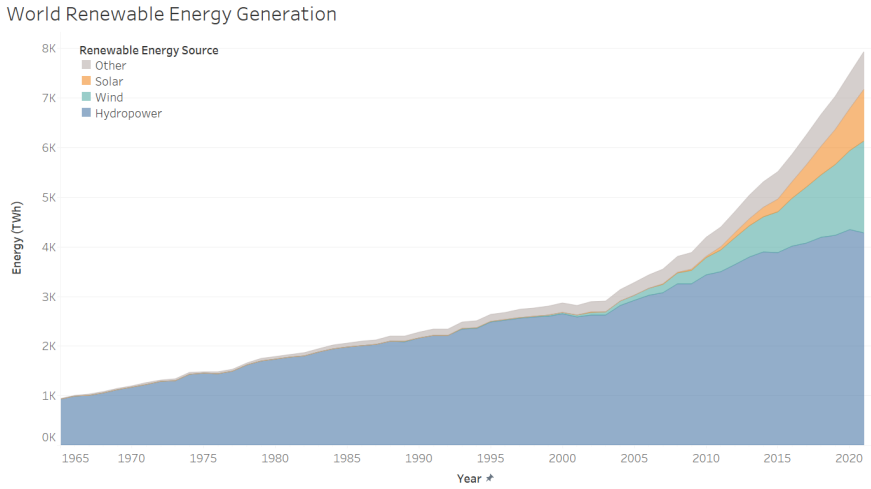
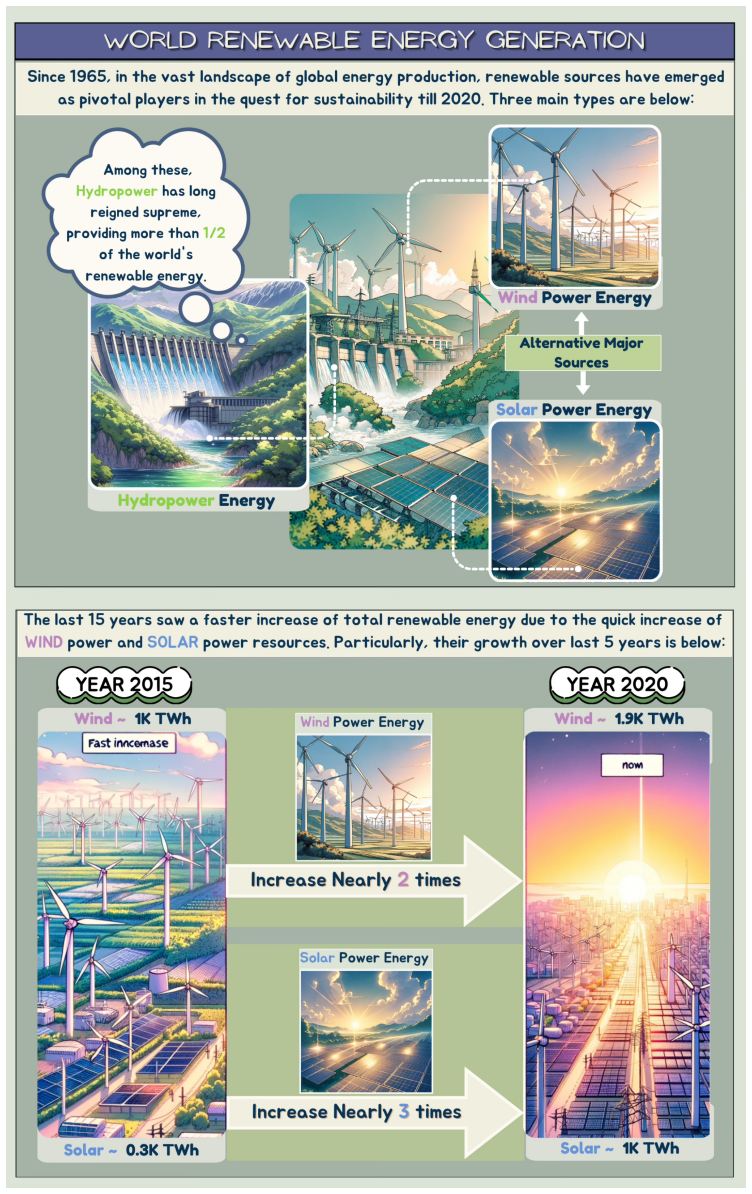
Within-subjects comparison of conventional visualizations versus GenAI-assisted data comics on information retrieval and insight comprehension tasks.
If this is right
- Data comics may function as an effective medium for improving data understanding in education.
- Generative AI can lower the creation effort needed to produce data comics for classroom use.
- Ethical questions around misinformation and ownership must be resolved before broad adoption of AI-assisted data comics.
- The performance benefit occurs across varying levels of visualization literacy.
Where Pith is reading between the lines
- The approach could be tested with younger students or in non-university settings to check if the gains generalize.
- If accuracy concerns are addressed, educators might more readily adopt narrative formats for data lessons.
- Studies could examine how much human editing is required to keep AI-generated comics reliable for teaching.
Load-bearing premise
The data comics made with generative AI help kept the same factual accuracy and teaching value as human-created ones and did not introduce errors or biases that would change the measured performance differences.
What would settle it
A follow-up experiment that uses only human-created data comics and still finds the same performance advantage on insight tasks would support the claim; finding no advantage would indicate the benefit may stem from the specific comic quality or AI process rather than the comic format.
Figures
read the original abstract
In today's data-driven world, students often struggle with interpreting visualisations due to limited visualisation literacy. Data comics have emerged as a promising medium to enhance engagement and understanding, but their educational value has seen little empirical examination, partly due to the effort required to create them. Recent advances in Generative AI (GenAI) offer a scalable solution to this challenge. We conducted a within-subjects study with 60 university students, comparing conventional visualisations with data comics, created with assistance from GenAI tools, across information retrieval and comprehension tasks. Students consistently performed better with data comics, particularly in insight comprehension tasks, independent of prior visualisation literacy. Students also commented data comics as more engaging and easier to understand, though concerns were raised about GenAI-driven misinformation and ownership. Our findings highlight the potential of data comics as a potentially effective tool for data communication in education, while underscoring the need to address ethical concerns related to AI-assisted creation.
Editorial analysis
A structured set of objections, weighed in public.
Referee Report
Summary. The paper reports a within-subjects user study (N=60 university students) comparing conventional visualizations to data comics created with GenAI assistance on information-retrieval and insight-comprehension tasks. It claims that participants performed better with data comics (especially on comprehension), that gains were independent of prior visualization literacy, and that comics were rated more engaging, while also documenting participant concerns about GenAI misinformation and ownership.
Significance. If the performance differences are robust and not confounded by content quality, the work would supply needed empirical evidence that data comics can improve educational outcomes in data interpretation and that GenAI can lower creation barriers. The within-subjects design and literacy-independence claim are potentially valuable for the HCI/education community, though the absence of reported accuracy-validation procedures for the GenAI materials limits the strength of the causal attribution to format.
major comments (2)
- [Methods] Methods section: the description of stimulus creation states that comics were 'created with assistance from GenAI tools' but supplies no post-generation factual-accuracy check, expert review protocol, or comparison of data fidelity between comic and conventional conditions. Because the central claim attributes performance gains to the comic format rather than to differences in content accuracy or pedagogical framing, this omission is load-bearing.
- [Results] Results section: the abstract and summary claim 'consistently performed better' and 'independent of prior visualisation literacy' yet the provided text contains no statistical tests, effect sizes, confidence intervals, or exclusion criteria. Without these details the independence claim cannot be evaluated and post-hoc selection cannot be ruled out.
minor comments (2)
- [Abstract] Abstract: reports performance differences without any statistical detail or task materials; this should be expanded or moved to a results summary.
- [Discussion] Ethics discussion: participant comments on misinformation and ownership are noted but not linked back to any concrete mitigation steps or study limitations; a short paragraph connecting these concerns to the GenAI creation process would improve clarity.
Simulated Author's Rebuttal
We thank the referee for the constructive feedback, which identifies key areas where additional detail will strengthen the manuscript's transparency and interpretability. We address each major comment below and will revise accordingly.
read point-by-point responses
-
Referee: [Methods] Methods section: the description of stimulus creation states that comics were 'created with assistance from GenAI tools' but supplies no post-generation factual-accuracy check, expert review protocol, or comparison of data fidelity between comic and conventional conditions. Because the central claim attributes performance gains to the comic format rather than to differences in content accuracy or pedagogical framing, this omission is load-bearing.
Authors: We agree this detail is necessary for causal attribution. The revised manuscript will add a dedicated subsection on stimulus creation that specifies: (1) the original data sources and conventional visualizations used in both conditions, (2) the exact GenAI tools and prompts, (3) the post-generation verification steps performed by the authors (including manual cross-checks against source data and any expert review), and (4) confirmation that the same underlying data values and pedagogical framing were preserved across formats. This will allow readers to evaluate content equivalence. revision: yes
-
Referee: [Results] Results section: the abstract and summary claim 'consistently performed better' and 'independent of prior visualisation literacy' yet the provided text contains no statistical tests, effect sizes, confidence intervals, or exclusion criteria. Without these details the independence claim cannot be evaluated and post-hoc selection cannot be ruled out.
Authors: We acknowledge that the current text does not report the statistical details. The revised results section will explicitly include: the full statistical models (e.g., mixed-effects ANOVA or regression), all test statistics, p-values, effect sizes, confidence intervals, power considerations, and participant exclusion criteria. We will also detail how the literacy-independence claim was tested (via interaction effects between condition and visualization literacy score) to allow direct evaluation of the claim. revision: yes
Circularity Check
No circularity: empirical user study with no derivations or self-referential modeling
full rationale
The paper reports a within-subjects user study (N=60) measuring task performance on information retrieval and insight comprehension, with no equations, fitted parameters, predictive models, or derivation chains. Central claims rest directly on observed scores and qualitative comments rather than any self-definition, fitted-input renaming, or self-citation load-bearing step. The GenAI creation detail is a methodological note, not a modeled input that is later re-predicted. No load-bearing uniqueness theorems or ansatzes appear. This is the expected 0 outcome for a purely empirical report whose results are externally falsifiable via replication.
Axiom & Free-Parameter Ledger
Reference graph
Works this paper leans on
-
[1]
Big data: A survey.Mobile Networks and Applications, 19:171–209, 2014
Min Chen, Shiwen Mao, and Yunhao Liu. Big data: A survey.Mobile Networks and Applications, 19:171–209, 2014. doi: 10.1007/s11036-013-0489-0. URLhttps: //doi.org/10.1007/s11036-013-0489-0
-
[2]
Seref Sagiroglu and Duygu Sinanc. Big data: A review. In2013 International Con- ference on Collaboration Technologies and Systems (CTS), pages 42–47, 2013. doi: 10.1109/CTS.2013.6567202
-
[3]
Clarence Maybee and Lisa Zilinski. Data informed learning: A next phase data literacy framework for higher education.Proceedings of the Association for Information Science and Technology, 52(1):1–4, 2015. doi: 10.1002/pra2.2015.1450520100108. URLhttps: //doi.org/10.1002/pra2.2015.1450520100108. 25
-
[4]
Cuilan Qiao, Yuqing Chen, Qing Guo, and Yunwei Yu. Understanding science data literacy: a conceptual framework and assessment tool for college students majoring in stem.International Journal of STEM Education, 11(1):25, 2024. doi: 10.1186/ s40594-024-00484-5. URLhttps://doi.org/10.1186/s40594-024-00484-5
-
[5]
M A Pratama, Supahar, D P Lestari, W K Sari, T S Y Putri, and V A K Adi- atmah. Data literacy assessment instrument for preparing 21 cs literacy: preliminary study.Journal of Physics: Conference Series, 1440(1):012085, jan 2020. doi: 10.1088/ 1742-6596/1440/1/012085. URLhttps://dx.doi.org/10.1088/1742-6596/1440/1/ 012085
-
[6]
Mikaela E Milesi, Riordan Alfredo, Vanessa Echeverria, Lixiang Yan, Linxuan Zhao, Yi-Shan Tsai, and Roberto Martinez-Maldonado. ”it’s really enjoyable to see me solve the problem like a hero”: Genai-enhanced data comics as a learning analytics tool. In Extended Abstracts of the CHI Conference on Human Factors in Computing Systems, CHI EA ’24, New York, NY...
-
[7]
Owen Corrigan and Alan F. Smeaton. Data visualisation literacy in higher education: An exploratory study of understanding of a learning dashboard tool.International Journal of Emerging Technologies in Learning (iJET), 15(17):115–126, 2020. doi: 10.3991/ijet.v15i17.15041. URLhttps://doi.org/10.3991/ijet.v15i17.15041
-
[8]
Haifeng Shen, Tomasz Bednarz, Huyen Nguyen, Frank Feng, Theodor Wyeld, Peter J. Hoek, and Edward H.S. Lo. Information visualisation methods and techniques: State- of-the-art and future directions.Journal of Industrial Information Integration, 16: 100102, 2019. ISSN 2452-414X. doi: https://doi.org/10.1016/j.jii.2019.07.003. URL https://www.sciencedirect.co...
-
[9]
Jonathan C. Roberts, Panagiotis D. Ritsos, James R. Jackson, and Christopher Headle- and. The explanatory visualization framework: An active learning framework for teaching creative computing using explanatory visualizations.IEEE Transactions on Visualization and Computer Graphics, 24(1):791–801, 2018. doi: 10.1109/TVCG.2017. 2745878
-
[10]
Graphics press Cheshire, CT, 2001
Edward R Tufte.The visual display of quantitative information, volume 2. Graphics press Cheshire, CT, 2001
2001
-
[11]
Adam V. Maltese, Joseph A. Harsh, and Dubravka Svetina. Data visualization lit- eracy: Investigating data interpretation along the novice–expert continuum.Journal of College Science Teaching, 45(1):84–90, 2015. doi: 10.2505/4/jcst15\ 045\ 01\ 84. URLhttps://doi.org/10.2505/4/jcst15_045_01_84
-
[12]
Trends and issues in student-facing learning analytics reporting systems research
Robert Bodily and Katrien Verbert. Trends and issues in student-facing learning analytics reporting systems research. InProceedings of the Seventh International Learning Analytics & Knowledge Conference, LAK ’17, page 309–318, New York, 26 NY, USA, 2017. Association for Computing Machinery. ISBN 9781450348706. doi: 10.1145/3027385.3027403. URLhttps://doi....
-
[13]
Gloria Milena Fernandez Nieto, Kirsty Kitto, Simon Buckingham Shum, and Roberto Martinez-Maldonado. Beyond the learning analytics dashboard: Alternative ways to communicate student data insights combining visualisation, narrative and storytelling. InLAK22: 12th International Learning Analytics and Knowledge Conference, LAK22, page 219–229, New York, NY, U...
-
[14]
Knaflic.Storytelling with Data: A Data Visualization Guide for Business Pro- fessionals
C.N. Knaflic.Storytelling with Data: A Data Visualization Guide for Business Pro- fessionals. Wiley, 2015. ISBN 9781119002253. URLhttps://books.google.com.au/ books?id=retRCgAAQBAJ
2015
-
[15]
Storytelling: The next step for visualization
Robert Kosara and Jock Mackinlay. Storytelling: The next step for visualization. Computer, 46(5):44–50, 2013. doi: 10.1109/MC.2013.36
-
[16]
Data storytelling: What it is and how it can be used to effectively communicate analysis results.Applied Marketing Analytics, 1(4):299–313, 2015
Brent Dykes. Data storytelling: What it is and how it can be used to effectively communicate analysis results.Applied Marketing Analytics, 1(4):299–313, 2015
2015
-
[17]
Driving data storytelling from learn- ing design
Vanessa Echeverria, Roberto Martinez-Maldonado, Roger Granda, Katherine Chiluiza, Cristina Conati, and Simon Buckingham Shum. Driving data storytelling from learn- ing design. InProceedings of the 8th International Conference on Learning Analytics and Knowledge, LAK ’18, page 131–140, New York, NY, USA, 2018. Association for Computing Machinery. ISBN 9781...
-
[18]
Gloria Milena Fernandez-Nieto, Roberto Martinez-Maldonado, Vanessa Echeverria, Kirsty Kitto, Dragan Gaˇ sevi´ c, and Simon Buckingham Shum. Data storytelling editor: A teacher-centred tool for customising learning analytics dashboard narratives. In Proceedings of the 14th Learning Analytics and Knowledge Conference, LAK ’24, page 678–689, New York, NY, US...
-
[19]
The emerging genre of data comics.IEEE Computer Graphics and Applications, 37 (3):6–13, 2017
Benjamin Bach, Nathalie Henry Riche, Sheelagh Carpendale, and Hanspeter Pfister. The emerging genre of data comics.IEEE Computer Graphics and Applications, 37 (3):6–13, 2017. doi: 10.1109/MCG.2017.33
-
[20]
Design patterns for data comics
Benjamin Bach, Zezhong Wang, Matteo Farinella, Dave Murray-Rust, and Nathalie Henry Riche. Design patterns for data comics. InProceedings of the 2018 CHI Con- ference on Human Factors in Computing Systems, CHI ’18, page 1–12, New York, NY, USA, 2018. Association for Computing Machinery. ISBN 9781450356206. doi: 10.1145/3173574.3173612. URLhttps://doi.org/...
-
[21]
Teaching data visualization and storytelling with data comic workshops
Zezhong Wang, Harvey Dingwall, and Benjamin Bach. Teaching data visualization and storytelling with data comic workshops. InExtended Abstracts of the 2019 CHI 27 Conference on Human Factors in Computing Systems, CHI EA ’19, page 1–9, New York, NY, USA, 2019. Association for Computing Machinery. ISBN 9781450359719. doi: 10.1145/3290607.3299043. URLhttps://...
-
[22]
Cheat sheets for data visualization techniques
Zezhong Wang, Lovisa Sundin, Dave Murray-Rust, and Benjamin Bach. Cheat sheets for data visualization techniques. InProceedings of the 2020 CHI Conference on Human Factors in Computing Systems, CHI ’20, page 1–13, New York, NY, USA, 2020. Associ- ation for Computing Machinery. ISBN 9781450367080. doi: 10.1145/3313831.3376271. URLhttps://doi.org/10.1145/33...
-
[23]
Magdalena Boucher, Benjamin Bach, Christina Stoiber, Zezhong Wang, and Wolfgang Aigner. Educational data comics: What can comics do for education in visualization? In2023 IEEE VIS Workshop on Visualization Education, Literacy, and Activities (EduVis), pages 34–40, 2023. doi: 10.1109/EduVis60792.2023.00012
-
[24]
Data storytelling in the classroom
Camillia Matuk, Anna Amato, Ido Davidesco, Laurie Rubel, Amy Stornaiuolo, Engin Bumbacher, Beth Chance, Kayla DesPortes, Adelmo Eloy, Emily Fagan, et al. Data storytelling in the classroom. InProceedings of the 16th International Conference of the Learning Sciences (ICLS 2022), pages 1779–1786. International Society of the Learning Sciences, 2022. doi: 10...
-
[25]
Marian Tes, Kayla DesPortes, Ralph Vacca, Megan Silander, Anna Amato, Camillia Matuk, and Peter J. Woods. Data comics: Using narratives to engage students in data reasoning. InProceedings of the 17th International Conference of the Learning Sciences (ICLS 2023), pages 1502–1505. International Society of the Learning Sciences, 2023. doi: 10.22318/icls2023....
-
[26]
Ralph Vacca, Kayla DesPortes, Marian Tes, Megan Silander, Camillia Matuk, Anna Amato, and Peter J. Woods. ”i happen to be one of 47.8%”: Social-emotional and data reasoning in middle school students’ comics about friendship. InProceedings of the 2022 CHI Conference on Human Factors in Computing Systems, CHI ’22, New York, NY, USA, 2022. Association for Co...
-
[27]
Md Tanvir Hasan, Annika Wolff, Antti Knutas, Anne P¨ assil¨ a, and Lasse Kantola. Playing games through interactive data comics to explore water quality in a lake: A case study exploring the use of a data-driven storytelling method in co-design. InExtended Abstracts of the 2022 CHI Conference on Human Factors in Com- puting Systems, CHI EA ’22, New York, ...
-
[28]
M. Boucher, M. AlKadi, B. Bach, and W. Aigner. Instructional comics for self-paced learning of data visualization tools and concepts.Computer Graphics Forum, 44(3): e70130, 2025. doi: https://doi.org/10.1111/cgf.70130. URLhttps://onlinelibrary. wiley.com/doi/abs/10.1111/cgf.70130. 28
-
[29]
R. LC, Z. Song, Y. Sun, and C. Yang. Designing narratives and data visuals in comic form for social influence in climate action.Frontiers in Psychology, 13:893181,
-
[30]
URLhttps://doi.org/10.3389/fpsyg.2022
doi: 10.3389/fpsyg.2022.893181. URLhttps://doi.org/10.3389/fpsyg.2022. 893181
-
[31]
Toonnote: Improving communication in computational notebooks using interactive data comics
DaYe Kang, Tony Ho, Nicolai Marquardt, Bilge Mutlu, and Andrea Bianchi. Toonnote: Improving communication in computational notebooks using interactive data comics. InProceedings of the 2021 CHI Conference on Human Factors in Computing Systems, CHI ’21, New York, NY, USA, 2021. Association for Computing Machinery. ISBN 9781450380966. doi: 10.1145/3411764.3...
-
[32]
Yuxuan Huang. The future of generative ai: How genai would change human- computer co-creation in the next 10 to 15 years. InCompanion Proceedings of the Annual Symposium on Computer-Human Interaction in Play, CHI PLAY Com- panion ’23, page 322–325, New York, NY, USA, 2023. Association for Computing Machinery. ISBN 9798400700293. doi: 10.1145/3573382.36160...
-
[33]
Text-to- image diffusion model in generative ai: A survey.arXiv preprint arXiv:2303.07909,
Chenshuang Zhang, Chaoning Zhang, Mengchun Zhang, and In So Kweon. Text-to- image diffusion model in generative ai: A survey.arXiv preprint arXiv:2303.07909,
-
[34]
Text-to- image diffusion model in generative ai: A survey.arXiv preprint arXiv:2303.07909,
doi: 10.48550/arXiv.2303.07909. URLhttps://doi.org/10.48550/arXiv. 2303.07909
-
[35]
Vizchat: Enhancing learning analytics dashboards with contextualised explanations using multimodal generative ai chatbots
Lixiang Yan, Linxuan Zhao, Vanessa Echeverria, Yueqiao Jin, Riordan Alfredo, Xinyu Li, Dragan Gaˇ sevi’c, and Roberto Martinez-Maldonado. Vizchat: Enhancing learning analytics dashboards with contextualised explanations using multimodal generative ai chatbots. In Andrew M. Olney, Irene-Angelica Chounta, Zitao Liu, Olga C. Santos, and Ig Ibert Bittencourt,...
2024
-
[36]
Tom Farrelly and Nick Baker. Generative artificial intelligence: Implications and considerations for higher education practice.Education Sciences, 13(11), 2023. ISSN 2227-7102. doi: 10.3390/educsci13111109. URLhttps://www.mdpi.com/2227-7102/ 13/11/1109
-
[37]
Hongbo Shao, Roberto Martinez-Maldonado, Vanessa Echeverria, Lixiang Yan, and Dragan Gasevic. Data storytelling in data visualisation: Does it enhance the efficiency and effectiveness of information retrieval and insights comprehension? InProceedings of the 2024 CHI Conference on Human Factors in Computing Systems, CHI ’24, New York, NY, USA, 2024. Associ...
-
[38]
Mikaela Elizabeth Milesi, Paola Mejia-Domenzain, Laura Brandl, Vanessa Echeverria, Yueqiao Jin, Dragan Gasevic, Yi-Shan Tsai, Tanja K¨ aser, and Roberto Martinez- Maldonado. ”piecing data connections together like a puzzle”: Effects of increasing task complexity on the effectiveness of data storytelling enhanced visualisations. In 29 Proceedings of the 20...
-
[39]
Mini-vlat: A short and effective measure of visu- alization literacy
Saugat Pandey and Alvitta Ottley. Mini-vlat: A short and effective measure of visu- alization literacy. InComputer Graphics Forum, volume 42, pages 1–11. Wiley Online Library, 2023. doi: 10.1111/cgf.14809. URLhttps://doi.org/10.1111/cgf.14809
-
[40]
Springer US, Boston, MA,
Hans Hinterberger.Data Visualization, pages 652–657. Springer US, Boston, MA,
-
[41]
doi: 10.1007/978-0-387-39940-9\ 1370
ISBN 978-0-387-39940-9. doi: 10.1007/978-0-387-39940-9\ 1370. URLhttps: //doi.org/10.1007/978-0-387-39940-9_1370
-
[42]
From data to insights: A layered storytelling approach for multimodal learning analytics
Roberto Martinez-Maldonado, Vanessa Echeverria, Gloria Fernandez Nieto, and Si- mon Buckingham Shum. From data to insights: A layered storytelling approach for multimodal learning analytics. InProceedings of the 2020 CHI Conference on Human Factors in Computing Systems, CHI ’20, page 1–15, New York, NY, USA, 2020. Associ- ation for Computing Machinery. IS...
-
[43]
Drucker, Alex Endert, and John Stasko
Arjun Srinivasan, Steven M. Drucker, Alex Endert, and John Stasko. Augmenting vi- sualizations with interactive data facts to facilitate interpretation and communication. IEEE Transactions on Visualization and Computer Graphics, 25(1):672–681, 2019. doi: 10.1109/TVCG.2018.2865145
-
[44]
Sukwon Lee, Sung-Hee Kim, and Bum Chul Kwon. Vlat: Development of a visual- ization literacy assessment test.IEEE Transactions on Visualization and Computer Graphics, 23(1):551–560, 2017. doi: 10.1109/TVCG.2016.2598920
-
[45]
Rensink, Enrico Bertini, and Jean-Daniel Fekete
Jeremy Boy, Ronald A. Rensink, Enrico Bertini, and Jean-Daniel Fekete. A princi- pled way of assessing visualization literacy.IEEE Transactions on Visualization and Computer Graphics, 20(12):1963–1972, 2014. doi: 10.1109/TVCG.2014.2346984
-
[46]
Seven goals for the design of constructivist learning environments
Peter C Honebein. Seven goals for the design of constructivist learning environments. Constructivist learning environments: Case studies in instructional design, 11(12):11, 1996
1996
-
[47]
A theoretical journey from so- cial constructivism to digital storytelling.The EuroCALL Review, 29(1):38–49, Apr
Lizzie Abderrahim and Mar Guti´ errez-Col´ on Plana. A theoretical journey from so- cial constructivism to digital storytelling.The EuroCALL Review, 29(1):38–49, Apr
-
[48]
URLhttps://polipapers.upv.es/index
doi: 10.4995/eurocall.2021.12853. URLhttps://polipapers.upv.es/index. php/eurocall/article/view/12853
-
[49]
Suzanne B. Cashman, Sarah Adeky, Alex J. Allen, Jason Corburn, Barbara A. Israel, Jaime Monta˜ no, Alvin Rafelito, Scott D. Rhodes, Samara Swanston, Nina Wallerstein, and Eugenia Eng. The power and the promise: Working with communities to analyze data, interpret findings, and get to outcomes.American Journal of Public Health, 98 (8):1407–1417, 2008. doi: ...
-
[50]
D. C. Phillips. The good, the bad, and the ugly: The many faces of constructivism. Educational Researcher, 24(7):5–12, 1995. doi: 10.3102/0013189X024007005. URL https://doi.org/10.3102/0013189X024007005
-
[51]
Katy B¨ orner, Adam Maltese, Russell Nelson Balliet, and Joe Heimlich. Investi- gating aspects of data visualization literacy using 20 information visualizations and 273 science museum visitors.Information Visualization, 15(3):198–213, 2016. doi: 10.1177/1473871615594652. URLhttps://doi.org/10.1177/1473871615594652
-
[52]
John dewey–philosopher and educational reformer.Online Submission, 1(1):1–13, 2015
Kandan Talebi. John dewey–philosopher and educational reformer.Online Submission, 1(1):1–13, 2015. doi: 10.6084/m9.figshare.2009706. URLhttps://dx.doi.org/10. 6084/m9.figshare.2009706
-
[53]
Vanessa Echeverria, Roberto Martinez-Maldonado,{Simon Buckingham}Shum, Katherine Chiluiza, Roger Granda, and Cristina Conati. Exploratory versus explana- tory visual learning analytics: driving teachers’ attention through educational data storytelling.Journal of Learning Analytics, 5(3):73–97, 2018. ISSN 1929-7750. doi: 10.18608/jla.2018.53.6
-
[54]
Mikaela Elizabeth Milesi and Roberto Martinez-Maldonado. Data storytelling in learning analytics? a qualitative investigation into educators’ perceptions of bene- fits and risks. InProceedings of the 14th Learning Analytics and Knowledge Con- ference, LAK ’24, page 167–177, New York, NY, USA, 2024. Association for Com- puting Machinery. ISBN 9798400716188...
-
[55]
Narrative visualization: Telling stories with data
Edward Segel and Jeffrey Heer. Narrative visualization: Telling stories with data. IEEE Transactions on Visualization and Computer Graphics, 16(6):1139–1148, 2010. doi: 10.1109/TVCG.2010.179
-
[56]
Comic computing: creation and communication with comic
Hiroaki Tobita. Comic computing: creation and communication with comic. In Proceedings of the 29th ACM International Conference on Design of Communica- tion, SIGDOC ’11, page 91–98, New York, NY, USA, 2011. Association for Com- puting Machinery. ISBN 9781450309363. doi: 10.1145/2038476.2038494. URL https://doi.org/10.1145/2038476.2038494
-
[57]
Data storytelling on multi-modal knowledge graph via data comics: a case study in yanyuwa language
Zhiping Liang, Zijie Zeng, Gloria Fernandez Nieto, Yuheng Li, Yi-Shan Tsai, Guan- liang Chen, Zachari Swiecki, Dragan Gaˇ sevi´ c, John Bradley, and Lele Sha. Data storytelling on multi-modal knowledge graph via data comics: a case study in yanyuwa language. In2024 Joint of International Conference on Learning Analytics and Knowledge Workshops, CEUR Works...
-
[59]
Comparing effectiveness and engagement of data comics and infographics
Zezhong Wang, Shunming Wang, Matteo Farinella, Dave Murray-Rust, Nathalie Henry Riche, and Benjamin Bach. Comparing effectiveness and engagement of data comics and infographics. InProceedings of the 2019 CHI Conference on Human Factors 31 in Computing Systems, CHI ’19, page 1–12, New York, NY, USA, 2019. Association for Computing Machinery. ISBN 978145035...
-
[60]
Personal data comics: A data storytelling approach supporting personal data literacy
Alejandra G´ omez Ortega, Jacky Bourgeois, and Gerd Kortuem. Personal data comics: A data storytelling approach supporting personal data literacy. InProceedings of the XI Latin American Conference on Human Computer Interaction, CLIHC ’23, New York, NY, USA, 2024. Association for Computing Machinery. ISBN 9798400716577. doi: 10.1145/3630970.3630982. URLhtt...
-
[61]
David Baidoo-anu and Leticia Owusu Ansah. Education in the era of generative ar- tificial intelligence (ai): Understanding the potential benefits of chatgpt in promoting teaching and learning.Journal of AI, 7(1):52–62, 2023. doi: 10.61969/jai.1337500
-
[62]
Text2video-zero: Text-to- image diffusion models are zero-shot video generators
Levon Khachatryan, Andranik Movsisyan, Vahram Tadevosyan, Roberto Henschel, Zhangyang Wang, Shant Navasardyan, and Humphrey Shi. Text2video-zero: Text-to- image diffusion models are zero-shot video generators. InProceedings of the IEEE/CVF International Conference on Computer Vision (ICCV), pages 15954–15964, 2023. doi: 10.1109/ICCV51070.2023.01462. URLht...
-
[63]
Haotian Li, Yun Wang, and Huamin Qu. Where are we so far? understanding data storytelling tools from the perspective of human-ai collaboration. InProceedings of the 2024 CHI Conference on Human Factors in Computing Systems, CHI ’24, New York, NY, USA, 2024. Association for Computing Machinery. ISBN 9798400703300. doi: 10.1145/3613904.3642726. URLhttps://d...
-
[64]
Danqing Shi, Xinyue Xu, Fuling Sun, Yang Shi, and Nan Cao. Calliope: Automatic visual data story generation from a spreadsheet.IEEE Transactions on Visualization and Computer Graphics, 27(2):453–463, 2021. doi: 10.1109/TVCG.2020.3030403
-
[65]
Constraint represen- tation towards precise data-driven storytelling
Leixian Shen, Haotian Li, Yun Wang, and Huamin Qu. From data to story: Towards automatic animated data video creation with llm-based multi-agent systems. In2024 IEEE VIS Workshop on Data Storytelling in an Era of Generative AI (GEN4DS), pages 20–27, 2024. doi: 10.1109/GEN4DS63889.2024.00008
-
[66]
CollabStory: Multi- LLM collaborative story generation and authorship analysis
Saranya Venkatraman, Nafis Irtiza Tripto, and Dongwon Lee. CollabStory: Multi- LLM collaborative story generation and authorship analysis. In Luis Chiruzzo, Alan Ritter, and Lu Wang, editors,Findings of the Association for Computational Linguis- tics: NAACL 2025, pages 3665–3679, Albuquerque, New Mexico, April 2025. Associa- tion for Computational Linguis...
-
[67]
Yi-Chun Chen and Arnav Jhala. Collaborative comic generation: Integrating visual narrative theories with ai models for enhanced creativity, 2024. URLhttps://arxiv. org/abs/2409.17263. 32
-
[68]
Crepant resolution conjecture in all genera for type A singularities
David Heidrich and Andreas Schreiber. Visualizing source code as comics using gen- erative ai. In2023 IEEE Working Conference on Software Visualization (VISSOFT), pages 40–44, 2023. doi: 10.1109/VISSOFT60811.2023.00014
work page internal anchor Pith review Pith/arXiv arXiv doi:10.1109/vissoft60811.2023.00014 2023
-
[69]
Constraint represen- tation towards precise data-driven storytelling
Yu-Zhe Shi, Haotian Li, Lecheng Ruan, and Huamin Qu. Constraint represen- tation towards precise data-driven storytelling. In2024 IEEE VIS Workshop on Data Storytelling in an Era of Generative AI (GEN4DS), pages 4–12, 2024. doi: 10.1109/GEN4DS63889.2024.00006
-
[70]
Ge, Yiren Ding, Lane Harrison, Fumeng Yang, and Matthew Kay
Yuan Cui, Lily W. Ge, Yiren Ding, Lane Harrison, Fumeng Yang, and Matthew Kay. Promises and pitfalls: Using large language models to generate visualization items. IEEE Transactions on Visualization and Computer Graphics, 31(1):1094–1104, 2025. doi: 10.1109/TVCG.2024.3456309
-
[71]
Eman A. Alasadi and Carlos R. Baiz. Generative ai in education and research: Op- portunities, concerns, and solutions.Journal of Chemical Education, 100(8):2965– 2971, 2023. doi: 10.1021/acs.jchemed.3c00323. URLhttps://doi.org/10.1021/ acs.jchemed.3c00323
-
[72]
Rosario Michel-Villarreal, Eliseo Vilalta-Perdomo, David Ernesto Salinas-Navarro, Ricardo Thierry-Aguilera, and Flor Silvestre Gerardou. Challenges and opportuni- ties of generative ai for higher education as explained by chatgpt.Education Sci- ences, 13(9), 2023. ISSN 2227-7102. doi: 10.3390/educsci13090856. URLhttps: //www.mdpi.com/2227-7102/13/9/856
-
[73]
An autoethnographic case study of generative artificial intelligence’s utility for accessibility
Kate S Glazko, Momona Yamagami, Aashaka Desai, Kelly Avery Mack, Venkatesh Potluri, Xuhai Xu, and Jennifer Mankoff. An autoethnographic case study of generative artificial intelligence’s utility for accessibility. InProceedings of the 25th International ACM SIGACCESS Conference on Computers and Accessibility, ASSETS ’23, New York, NY, USA, 2023. Associati...
-
[74]
Thomas K. F. Chiu. The impact of generative ai (genai) on practices, policies and research direction in education: a case of chatgpt and midjourney.Interactive Learning Environments, 32(10):6187–6203, 2024. doi: 10.1080/10494820.2023.2253861. URL https://doi.org/10.1080/10494820.2023.2253861
-
[75]
Riordan Alfredo, Vanessa Echeverria, Yueqiao Jin, Lixiang Yan, Zachari Swiecki, Dra- gan Gaˇ sevi´ c, and Roberto Martinez-Maldonado. Human-centred learning analytics and ai in education: A systematic literature review.Computers and Education: Ar- tificial Intelligence, 6:100215, 2024. ISSN 2666-920X. doi: https://doi.org/10.1016/j. caeai.2024.100215. URL...
work page doi:10.1016/j 2024
-
[76]
Jessie B. Arneson and Erika G. Offerdahl. Visual literacy in bloom: Using bloom’s taxonomy to support visual learning skills.CBE—Life Sciences Education, 17(1): ar7, 2018. doi: 10.1187/cbe.17-08-0178. URLhttps://doi.org/10.1187/cbe. 17-08-0178. PMID: 29351910. 33
-
[77]
Sheppard
Stephen R.J. Sheppard. Landscape visualisation and climate change: the potential for influencing perceptions and behaviour.Environmental Science & Policy, 8(6):637–654,
-
[78]
doi: https://doi.org/10.1016/j.envsci.2005.08.002
ISSN 1462-9011. doi: https://doi.org/10.1016/j.envsci.2005.08.002. URLhttps: //www.sciencedirect.com/science/article/pii/S1462901105001188. Mitigation and Adaptation Strategies for Climate Change
-
[79]
Melehat Gezer. Examination of secondary students’ visual images about climate change.Journal of Education in Science Environment and Health, 8(4):294–306, 2022. doi: 10.55549/jeseh.1193600
-
[80]
Jacob Cohen.Statistical Power Analysis for the Behavioral Sciences. Routledge, 2 edition, 1988. doi: 10.4324/9780203771587. URLhttps://doi.org/10.4324/ 9780203771587
-
[81]
Using bloom’s taxonomy to support data visualization capacity skills
Vetria Byrd. Using bloom’s taxonomy to support data visualization capacity skills. In Saul Carliner, editor,Proceedings of eLearn: World Conference on EdTech 2019, pages 1039–1053, New Orleans, Louisiana, United States, November 2019. Asso- ciation for the Advancement of Computing in Education (AACE). URLhttps: //www.learntechlib.org/p/212809
2019
discussion (0)
Sign in with ORCID, Apple, or X to comment. Anyone can read and Pith papers without signing in.